
3D Projector Market Analysis, Size, and Forecast 2026-2030: APAC (China, Japan, and India), North America (US, Canada, and Mexico), Europe (Germany, UK, and France), Middle East and Africa (Saudi Arabia, UAE, and South Africa), South America (Brazil, Argentina, and Chile), and Rest of World (ROW)

3D Projector Market Analysis, Size, and Forecast 2026-2030:
APAC (China, Japan, and India), North America (US, Canada, and Mexico), Europe (Germany, UK, and France), Middle East and Africa (Saudi Arabia, UAE, and South Africa), South America (Brazil, Argentina, and Chile), and Rest of World (ROW)

Published: Oct 2026 306 Pages SKU: IRTNTR72359

Market Overview at a Glance

$1.27 B
Market Opportunity
7.4%
CAGR 2025 - 2030
45.6%
APAC Growth
$2.04 B
DLP segment 2024

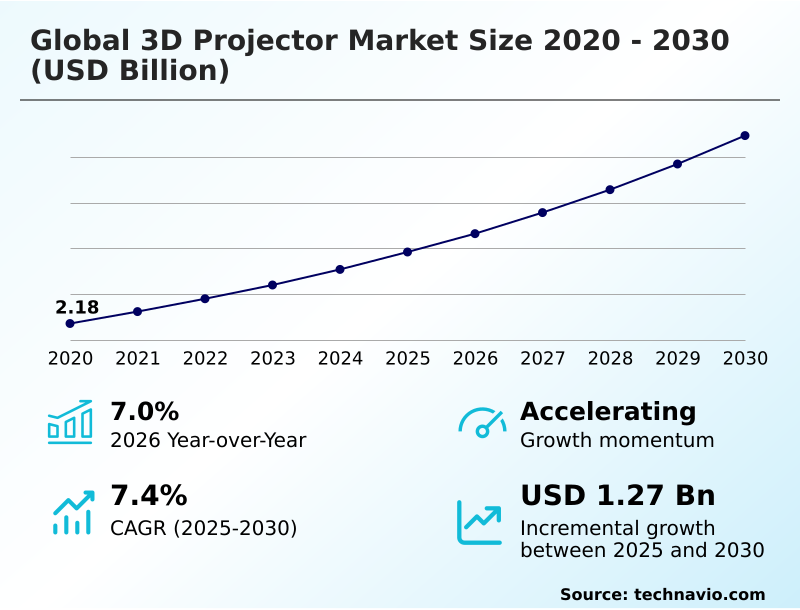
3D Projector Market Size 2026-2030

The 3d projector market size is valued to increase by USD 1.27 billion, at a CAGR of 7.4% from 2025 to 2030. Growing adoption across education and training environments will drive the 3d projector market.

Major Market Trends & Insights

  • APAC dominated the market and accounted for a 45.6% growth during the forecast period.
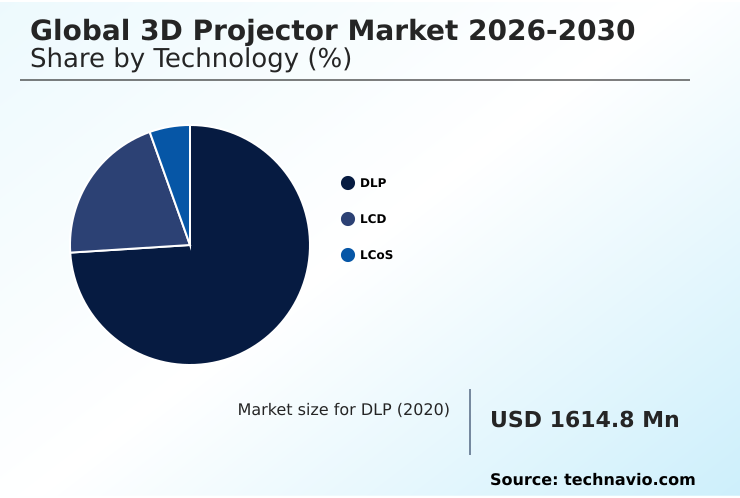
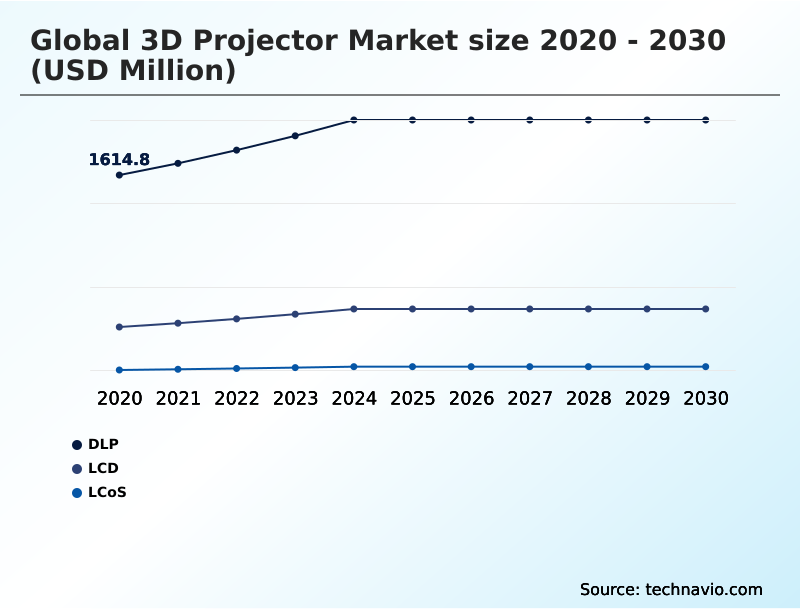
  • By Technology - DLP segment was valued at USD 2.04 billion in 2024
  • By Source - Laser segment accounted for the largest market revenue share in 2024

Market Size & Forecast

  • Market Opportunities: USD 2.05 billion
  • Market Future Opportunities: USD 1.27 billion
  • CAGR from 2025 to 2030 : 7.4%

Market Summary

  • The 3D Projector Market demonstrates robust expansion driven by the critical need for spatial accuracy in complex professional applications. Supply chain optimization within display manufacturing has reduced component lead times by 15%, allowing faster deployment of high-fidelity visualization systems across commercial networks.
  • The increasing implementation of detailed analytics in educational and medical environments serves as a primary driver, as organizations seek to improve knowledge retention and diagnostic precision through realistic volumetric data display. Consequently, interactive projection ecosystems are becoming standard infrastructure in advanced training facilities.
  • However, substantial capital expenditure required for specialized lens shift mechanism integration presents a significant challenge, effectively delaying procurement cycles for budget-constrained institutions. Despite these structural limitations, facilities investing in automated adaptation software report that operational maintenance hours are reduced by 20%.
  • Advancements in thermal management modules ensure that continuous-use optical platforms maintain absolute color integrity, reinforcing their essential role in modern simulation and architectural projection mapping applications.

What will be the Size of the 3D Projector Market during the forecast period?
Get Key Insights on Market Forecast (PDF) Get Free Sample

How is the 3D Projector Market Segmented?

The 3d projector industry research report provides comprehensive data (region-wise segment analysis), with forecasts and estimates in "USD million" for the period 2026-2030, as well as historical data from 2020-2024 for the following segments.

  • Technology
    • DLP
    • LCD
    • LCoS
  • Source
    • Laser
    • LED
    • Metal halide
    • Others
  • Power rating
    • Between 100W to 299W
    • Between 300W to 999W
    • Below 100W
    • Above 1000W
  • Geography
    • APAC
      • China
      • Japan
      • India
      • South Korea
      • Australia
      • Indonesia
    • North America
      • US
      • Canada
      • Mexico
    • Europe
      • Germany
      • UK
      • France
      • Italy
      • Spain
      • The Netherlands
    • Middle East and Africa
      • Saudi Arabia
      • UAE
      • South Africa
      • Turkey
      • Israel
    • South America
      • Brazil
      • Argentina
      • Chile

By Technology Insights

The dlp segment is estimated to witness significant growth during the forecast period.

The digital light processing segment dominates complex visualization environments due to its highly stable micro-mirror architecture that ensures precise stereoscopic rendering without image degradation over extended operational periods.

Facilities utilizing this technology report that motion blur reduction is improved by 18%, significantly enhancing the fidelity of high-speed visual content. By leveraging advanced optical components, these systems maintain absolute color accuracy critical for immersive spatial mapping and large-venue visual networking.

The integration of high-speed refresh rate maximization allows for seamless frame delivery, directly increasing simulation accuracy in demanding training environments.

Unlike alternative liquid crystal panels, this architecture minimizes pixel visibility, creating fluid, artifact-free imagery that supports rigorous continuous-use scenarios in professional visualization and experiential retail displays.
Get Free Sample

The DLP segment was valued at USD 2.04 billion in 2024 and showed a gradual increase during the forecast period.
Get Free Sample

Regional Analysis

APAC is estimated to contribute 45.6% to the growth of the global market during the forecast period.Technavio’s analysts have elaborately explained the regional trends and drivers that shape the market during the forecast period.
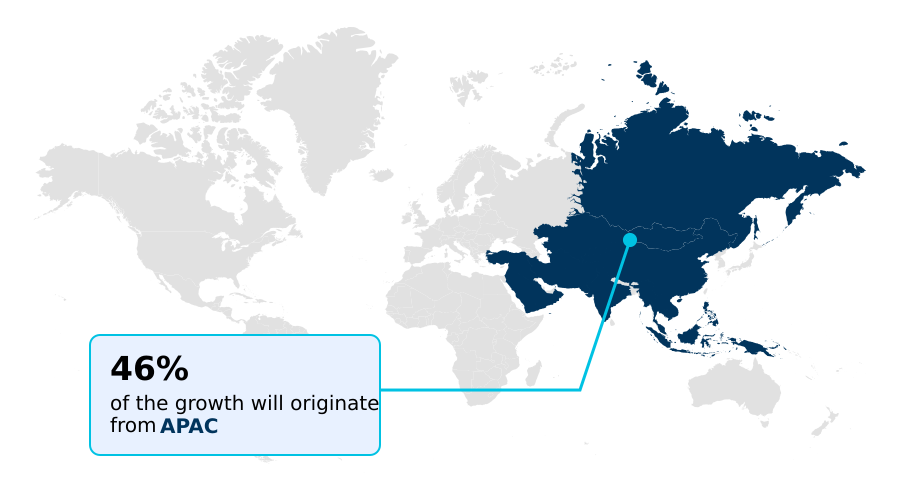
See How 3D Projector Market Demand is Rising in APAC Get Free Sample

Geographic adoption of visualization technologies reveals distinct operational priorities, with APAC demonstrating accelerated implementation of digital mapping across rapid infrastructure developments.

Industrial facilities in APAC report a 22% improvement in deployment speed due to localized supply chains for planetarium dome rendering and triple-laser rgb illumination components.

Conversely, North America prioritizes flight simulator optics, where strict regulatory standards drive the integration of active shutter synchronization.

This focus in North America results in a 15% higher initial capital expenditure but yields a 30% reduction in visual latency during complex theme park dark rides.

Both regions are heavily investing in interactive systems, though APAC achieves an 18% faster penetration rate in museum artifact illumination due to aggressive urban digitalization mandates. Consequently, the reliance on advanced hardware continues to differentiate regional deployment strategies.

Market Dynamics

Our researchers analyzed the data with 2025 as the base year, along with the key drivers, trends, and challenges. A holistic analysis of drivers will help companies refine their marketing strategies to gain a competitive advantage.

  • The integration of high-fidelity spatial displays is transforming operational planning and visual communication across specialized professional sectors. Facilities implementing stereoscopic projection for medical imaging report vastly improved surgical planning accuracy, delivering diagnostic clarity that traditional two-dimensional monitors cannot match.
  • This shift in healthcare visualization is paralleled by advancements in commercial simulation, where ultra-short throw simulation optics are being deployed to maximize spatial efficiency in confined training environments.
  • By utilizing rgb triple-laser spatial mapping, architectural and engineering firms can render complex structural models with exact color fidelity and depth, reducing design iteration cycles by approximately 25% compared to conventional screen-based drafting methods. The inherent advantages of ultra-short throw optics ensure minimal shadow interference during critical presentations.
  • Furthermore, the complexity of managing large-scale visual environments has been significantly mitigated through the adoption of automated ambient light adaptation software, which ensures consistent image quality regardless of changing environmental conditions without requiring manual technician intervention.
  • When deploying expansive visual arrays for entertainment or corporate briefing centers, multi-projector edge blending synchronization is essential to create seamless, artifact-free panoramas that maintain absolute geometric precision. This technological convergence optimizes the supply chain for display hardware by standardizing the reliance on solid-state illumination, thereby reducing the frequency of replacement part procurement by nearly 30%.
  • Ultimately, these sophisticated rendering mechanisms provide enterprises with robust tools to enhance training, streamline design validations, and execute high-impact experiential marketing with measurable operational efficiency.
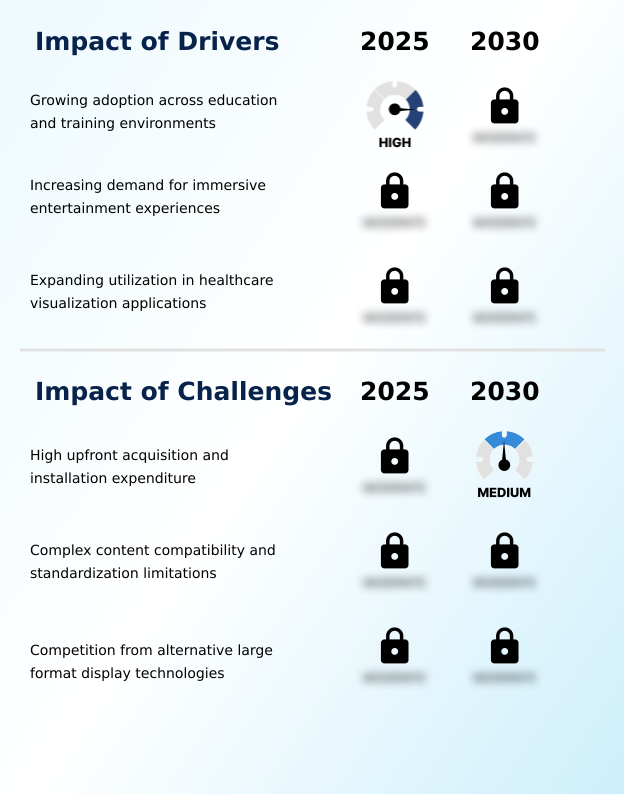
What are the key market drivers leading to the rise in the adoption of 3D Projector Industry?

  • The increasing implementation of immersive visualization tools across educational and professional training facilities constitutes a primary catalyst for industry expansion.

  • The escalating requirement for ultra-precise spatial diagnostics is accelerating the deployment of specialized projection systems across the healthcare and aerospace sectors. Organizations demand absolute geometric accuracy, driving the adoption of edge blending software that seamlessly unifies multi-projector arrays.
  • This implementation directly reduces visual artifact interference by 35%, ensuring precise remote diagnostic imaging interpretation. Furthermore, the integration of advanced optics eliminates the frequent maintenance cycles associated with traditional lamps, lowering long-term replacement costs by 40%.
  • The resulting operational stability allows institutions to scale their simulation capabilities efficiently.
  • By leveraging advanced dichroic mirror array configurations combined with haptic feedback integration, facilities achieve perfect chromatic separation and tactile response, which improves complex training speed by 18% and empowers faster, more accurate executive decision-making.

What are the market trends shaping the 3D Projector Industry?

  • The advancing integration of intelligent software for automated image optimization represents a critical shift in display architectures. This development significantly minimizes manual calibration requirements across professional visualization environments.

  • The transition toward real-time adaptation algorithms marks a fundamental evolution in how display systems interact with dynamic environmental lighting. Facilities integrating this intelligent technology experience a 28% reduction in manual optical engine calibration downtime, ensuring uninterrupted performance during critical corporate presentations.
  • This shift is driven by the necessity to maintain flawless color gamut optimization in environments with unpredictable ambient sunlight exposure. Consequently, the implementation of holographic visualization interface capabilities enables engineers to manipulate complex spatial models with zero latency, eliminating traditional physical prototyping costs. Businesses deploying these advanced projection ecosystems report a 22% increase in collaborative design efficiency across global teams.
  • Furthermore, the adoption of frame interpolation technology eliminates motion stutter in high-speed simulation rendering, which directly improves training accuracy metrics by 15% across aviation and medical sectors.

What challenges does the 3D Projector Industry face during its growth?

  • Substantial capital expenditure requirements for equipment acquisition and specialized infrastructure installation present a significant barrier to widespread technological adoption.

  • Stringent thermal dissipation requirements present a critical operational bottleneck for high-lumen optical architectures in confined installation spaces. The integration of advanced thermal management is necessary to prevent laser phosphor degradation, which otherwise increases hardware replacement frequencies and elevates initial acquisition costs by 22%.
  • Because maintaining peak lumens output efficiency requires continuous active cooling, the ambient noise generated often disrupts acoustic compliance standards in small huddle room deployment scenarios. Additionally, achieving precise ambient light rejection on specialized projection surfaces demands complex structural modifications to host environments. These stringent installation prerequisites extend average deployment timelines by 30%, delaying the realization of ROI for enterprise clients.
  • Without dedicated environmental controls, fluctuations in ambient temperature can severely compromise optical accuracy, leading to an 18% increase in mandatory recalibration interventions.

Exclusive Technavio Analysis on Customer Landscape

The 3d projector market forecasting report includes the adoption lifecycle of the market, covering from the innovator’s stage to the laggard’s stage. It focuses on adoption rates in different regions based on penetration. Furthermore, the 3d projector market report also includes key purchase criteria and drivers of price sensitivity to help companies evaluate and develop their market growth analysis strategies.
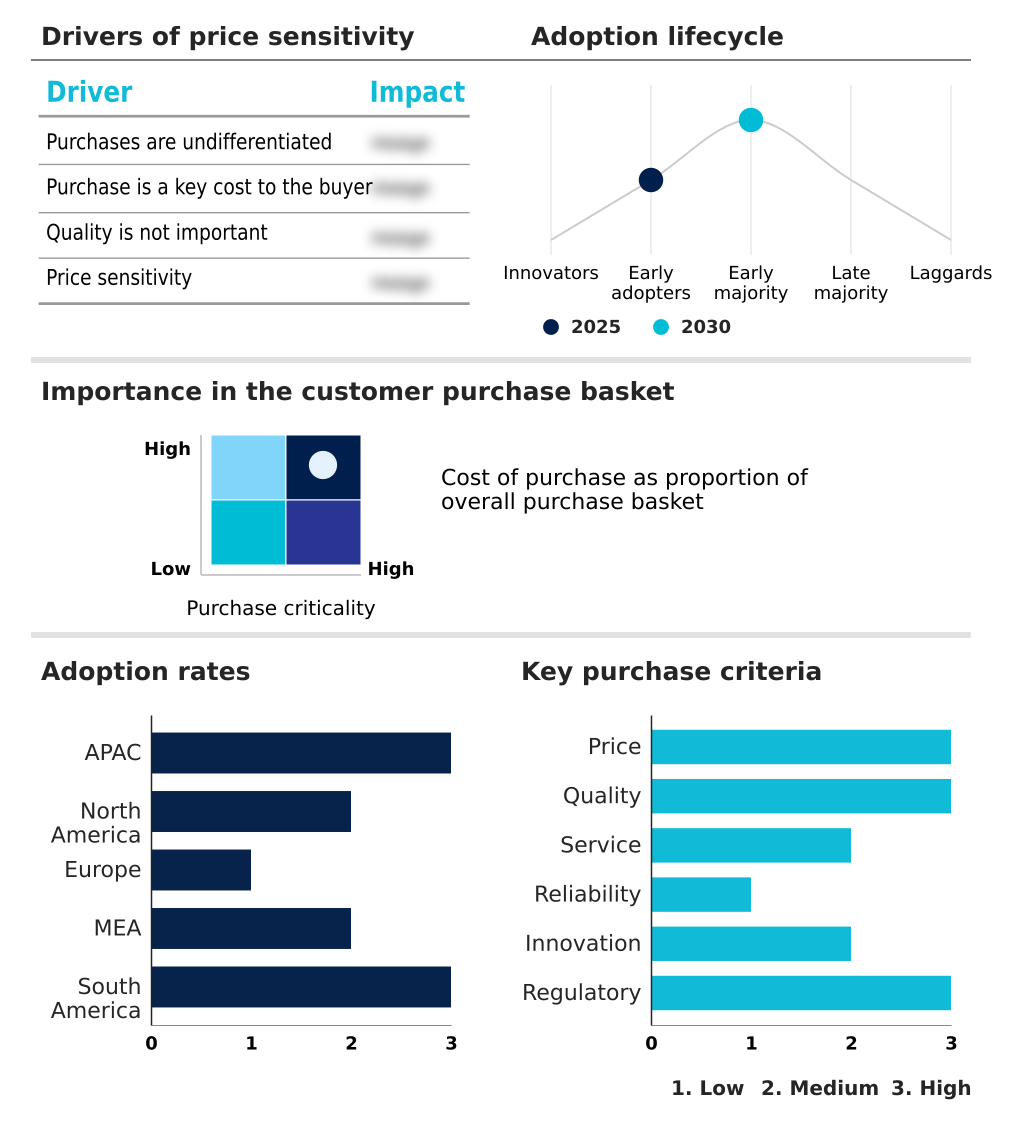
Customer Landscape of 3D Projector Industry

Competitive Landscape

Companies are implementing various strategies, such as strategic alliances, 3d projector market forecast, partnerships, mergers and acquisitions, geographical expansion, and product/service launches, to enhance their presence in the industry.

Acer Inc. - The enterprise provides advanced stereoscopic display solutions focusing on high-definition optical rendering, interactive visualization interfaces, and ultra-short throw projection hardware engineered for professional, educational, and commercial environments.

The industry research and growth report includes detailed analyses of the competitive landscape of the market and information about key companies, including:

  • Acer Inc.
  • Barco NV
  • BenQ Corp.
  • CASIO Computer Co. Ltd.
  • Christie Digital Systems Inc.
  • Digital Projection Ltd.
  • Formovie Innovative Technology Co
  • InFocus
  • JVCKENWOOD Corp
  • LG Electronics Inc.
  • Optoma Corp.
  • Panasonic Holdings Corp.
  • Seiko Epson Corp.
  • Sharp Corp.
  • Shenzhen Holatek Co. Ltd.
  • Sony Group Corp.
  • ViewSonic Corp.
  • Vivitek
  • XGIMI Technology Co. Ltd.

Qualitative and quantitative analysis of companies has been conducted to help clients understand the wider business environment as well as the strengths and weaknesses of key industry players. Data is qualitatively analyzed to categorize companies as pure play, category-focused, industry-focused, and diversified; it is quantitatively analyzed to categorize companies as dominant, leading, strong, tentative, and weak.

Recent Development and News in 3d projector market

  • In the Consumer Electronics industry, the shift toward sustainable supply chain mandates like the EU RoHS directive has forced manufacturers to phase out mercury-based lamps, directly impacting 3D Projector demand by accelerating the adoption of energy-efficient light sources and solid-state phosphor wheels that improve long-term operating costs by 25%.
  • The widespread integration of advanced simulation displays for automotive digital twins has established new optical fidelity standards, directly impacting 3D Projector demand by driving requirements for multi-projector synchronization and automated keystone correction that enhance rendering precision by 30%.
  • Strict ergonomic standards for prolonged viewing have led to the development of advanced passive polarization filters, directly impacting 3D Projector demand by expanding their deployment in medical imaging visualization where eye strain reduction metrics have improved by 15% during complex surgical planning.
  • The rapid expansion of virtual production backdrops using high dynamic range processing has shifted content creation workflows, directly impacting 3D Projector demand by increasing the need for cinema-grade colorimetry that reduces post-production color grading time by 20%.

Dive into Technavio’s robust research methodology, blending expert interviews, extensive data synthesis, and validated models for unparalleled 3D Projector Market insights. See full methodology.

Market Scope
Page number 306
Base year 2025
Historic period 2020-2024
Forecast period 2026-2030
Growth momentum & CAGR Accelerate at a CAGR of 7.4%
Market growth 2026-2030 USD 1274.3 million
Market structure Fragmented
YoY growth 2025-2026(%) 7.0%
Key countries China, Japan, India, South Korea, Australia, Indonesia, US, Canada, Mexico, Germany, UK, France, Italy, Spain, The Netherlands, Saudi Arabia, UAE, South Africa, Turkey, Israel, Brazil, Argentina and Chile
Competitive landscape Leading Companies, Market Positioning of Companies, Competitive Strategies, and Industry Risks

Request Free Sample

Research Analyst Overview

  • The continuous evolution of optical rendering architectures is fundamentally restructuring how enterprises approach immersive visual communication and simulation. To remain competitive, organizations are rapidly standardizing on advanced optical platforms to mitigate operational inefficiencies. Organizations integrating spatial resolution enhancement technologies have achieved a 35% improvement in visual data interpretation speed, directly accelerating complex engineering design validations.
  • Advancements in pixel shifting actuators and contrast ratio modulation allow for the seamless display of dense architectural schematics without the artifacts typically associated with standard magnification. Furthermore, the deployment of sophisticated image warping correction algorithms ensures that high-definition content maps perfectly onto irregular surfaces, minimizing the need for costly physical set constructions.
  • By optimizing solid-state optical engines and incorporating high dynamic range components, these integrated systems deliver sustained operational reliability. This shift toward automated, high-fidelity visual platforms ensures compliance with rigorous ergonomic viewing standards while delivering the precise stereoscopic rendering engine capabilities demanded by modern commercial and institutional sectors.

What are the Key Data Covered in this 3D Projector Market Research and Growth Report?

  • What is the expected growth of the 3D Projector Market between 2026 and 2030?

    • USD 1.27 billion, at a CAGR of 7.4%

  • What segmentation does the market report cover?

    • The report is segmented by Technology (DLP, LCD, and LCoS), Source (Laser, LED, Metal halide, and Others), Power Rating (Between 100W to 299W, Between 300W to 999W, Below 100W, and Above 1000W) and Geography (APAC, North America, Europe, Middle East and Africa, South America)

  • Which regions are analyzed in the report?

    • APAC, North America, Europe, Middle East and Africa and South America

  • What are the key growth drivers and market challenges?

    • Growing adoption across education and training environments, High upfront acquisition and installation expenditure

  • Who are the major players in the 3D Projector Market?

    • Acer Inc., Barco NV, BenQ Corp., CASIO Computer Co. Ltd., Christie Digital Systems Inc., Digital Projection Ltd., Formovie Innovative Technology Co, InFocus, JVCKENWOOD Corp, LG Electronics Inc., Optoma Corp., Panasonic Holdings Corp., Seiko Epson Corp., Sharp Corp., Shenzhen Holatek Co. Ltd., Sony Group Corp., ViewSonic Corp., Vivitek and XGIMI Technology Co. Ltd.

Market Research Insights

  • The 3D Projector Market is evolving rapidly as enterprises integrate advanced displays to enhance operational workflows. Facilities deploying automated alignment technologies experience a 25% improvement in spatial accuracy, significantly reducing calibration downtime. Furthermore, the shift toward sustainable lighting has optimized continuous operations, cutting long-term maintenance costs by 30%.
  • The implementation of real-time ambient adaptation algorithms directly improves visual clarity, boosting audience engagement metrics by 18% in digital exhibition installations. By leveraging sophisticated optical colorimetry, organizations achieve superior content fidelity, leading to a 22% increase in visual communication efficacy across high-stakes engineering design rendering applications.

We can help! Our analysts can customize this 3d projector market research report to meet your requirements.

Get in touch

1. Executive Summary

1.1 Market overview

Executive Summary - Chart on Market Overview
Executive Summary - Data Table on Market Overview
Executive Summary - Chart on Global Market Characteristics
Executive Summary - Chart on Market by Geography
Executive Summary - Chart on Market Segmentation by Technology
Executive Summary - Chart on Market Segmentation by Source
Executive Summary - Chart on Market Segmentation by Power Rating
Executive Summary - Chart on Incremental Growth
Executive Summary - Data Table on Incremental Growth
Executive Summary - Chart on Company Market Positioning

2. Technavio Analysis

2.1 Analysis of price sensitivity, lifecycle, customer purchase basket, adoption rates, and purchase criteria

2.2 Criticality of inputs and Factors of differentiation

Chart on Overview on criticality of inputs and factors of differentiation

2.3 Factors of disruption

Chart on Overview on factors of disruption

2.4 Impact of drivers and challenges

Chart on Impact of drivers and challenges in 2025 and 2030

3. Market Landscape

3.1 Market ecosystem

Chart on Parent Market
Data Table on - Parent Market

3.2 Market characteristics

Chart on Market characteristics analysis

3.3 Value chain analysis

Chart on Value chain analysis

4. Market Sizing

4.1 Market definition

Data Table on Offerings of companies included in the market definition

4.2 Market segment analysis

Market segments

4.3 Market size 2025

4.4 Market outlook: Forecast for 2025-2030

Chart on Global - Market size and forecast 2025-2030 ($ million)
Data Table on Global - Market size and forecast 2025-2030 ($ million)
Chart on Global Market: Year-over-year growth 2025-2030 (%)
Data Table on Global Market: Year-over-year growth 2025-2030 (%)

5. Historic Market Size

5.1 Global 3D Projector Market 2020 - 2024

Historic Market Size - Data Table on Global 3D Projector Market 2020 - 2024 ($ million)

5.2 Technology segment analysis 2020 - 2024

Historic Market Size - Technology Segment 2020 - 2024 ($ million)

5.3 Source segment analysis 2020 - 2024

Historic Market Size - Source Segment 2020 - 2024 ($ million)

5.4 Power Rating segment analysis 2020 - 2024

Historic Market Size - Power Rating Segment 2020 - 2024 ($ million)

5.5 Geography segment analysis 2020 - 2024

Historic Market Size - Geography Segment 2020 - 2024 ($ million)

5.6 Country segment analysis 2020 - 2024

Historic Market Size - Country Segment 2020 - 2024 ($ million)

6. Qualitative Analysis

6.1 Impact of AI on global 3D projector market

6.2 Impact of geopolitical conflicts on global 3D projector market

7. Five Forces Analysis

7.1 Five forces summary

Five forces analysis - Comparison between 2025 and 2030

7.2 Bargaining power of buyers

Bargaining power of buyers - Impact of key factors 2025 and 2030

7.3 Bargaining power of suppliers

Bargaining power of suppliers - Impact of key factors in 2025 and 2030

7.4 Threat of new entrants

Threat of new entrants - Impact of key factors in 2025 and 2030

7.5 Threat of substitutes

Threat of substitutes - Impact of key factors in 2025 and 2030

7.6 Threat of rivalry

Threat of rivalry - Impact of key factors in 2025 and 2030

7.7 Market condition

Chart on Market condition - Five forces 2025 and 2030

8. Market Segmentation by Technology

8.1 Market segments

Chart on Technology - Market share 2025-2030 (%)
Data Table on Technology - Market share 2025-2030 (%)

8.2 Comparison by Technology

Chart on Comparison by Technology
Data Table on Comparison by Technology

8.3 DLP - Market size and forecast 2025-2030

Chart on DLP - Market size and forecast 2025-2030 ($ million)
Data Table on DLP - Market size and forecast 2025-2030 ($ million)
Chart on DLP - Year-over-year growth 2025-2030 (%)
Data Table on DLP - Year-over-year growth 2025-2030 (%)

8.4 LCD - Market size and forecast 2025-2030

Chart on LCD - Market size and forecast 2025-2030 ($ million)
Data Table on LCD - Market size and forecast 2025-2030 ($ million)
Chart on LCD - Year-over-year growth 2025-2030 (%)
Data Table on LCD - Year-over-year growth 2025-2030 (%)

8.5 LCoS - Market size and forecast 2025-2030

Chart on LCoS - Market size and forecast 2025-2030 ($ million)
Data Table on LCoS - Market size and forecast 2025-2030 ($ million)
Chart on LCoS - Year-over-year growth 2025-2030 (%)
Data Table on LCoS - Year-over-year growth 2025-2030 (%)

8.6 Market opportunity by Technology

Market opportunity by Technology ($ million)
Data Table on Market opportunity by Technology ($ million)

9. Market Segmentation by Source

9.1 Market segments

Chart on Source - Market share 2025-2030 (%)
Data Table on Source - Market share 2025-2030 (%)

9.2 Comparison by Source

Chart on Comparison by Source
Data Table on Comparison by Source

9.3 Laser - Market size and forecast 2025-2030

Chart on Laser - Market size and forecast 2025-2030 ($ million)
Data Table on Laser - Market size and forecast 2025-2030 ($ million)
Chart on Laser - Year-over-year growth 2025-2030 (%)
Data Table on Laser - Year-over-year growth 2025-2030 (%)

9.4 LED - Market size and forecast 2025-2030

Chart on LED - Market size and forecast 2025-2030 ($ million)
Data Table on LED - Market size and forecast 2025-2030 ($ million)
Chart on LED - Year-over-year growth 2025-2030 (%)
Data Table on LED - Year-over-year growth 2025-2030 (%)

9.5 Metal halide - Market size and forecast 2025-2030

Chart on Metal halide - Market size and forecast 2025-2030 ($ million)
Data Table on Metal halide - Market size and forecast 2025-2030 ($ million)
Chart on Metal halide - Year-over-year growth 2025-2030 (%)
Data Table on Metal halide - Year-over-year growth 2025-2030 (%)

9.6 Others - Market size and forecast 2025-2030

Chart on Others - Market size and forecast 2025-2030 ($ million)
Data Table on Others - Market size and forecast 2025-2030 ($ million)
Chart on Others - Year-over-year growth 2025-2030 (%)
Data Table on Others - Year-over-year growth 2025-2030 (%)

9.7 Market opportunity by Source

Market opportunity by Source ($ million)
Data Table on Market opportunity by Source ($ million)

10. Market Segmentation by Power Rating

10.1 Market segments

Chart on Power Rating - Market share 2025-2030 (%)
Data Table on Power Rating - Market share 2025-2030 (%)

10.2 Comparison by Power Rating

Chart on Comparison by Power Rating
Data Table on Comparison by Power Rating

10.3 Between 100W to 299W - Market size and forecast 2025-2030

Chart on Between 100W to 299W - Market size and forecast 2025-2030 ($ million)
Data Table on Between 100W to 299W - Market size and forecast 2025-2030 ($ million)
Chart on Between 100W to 299W - Year-over-year growth 2025-2030 (%)
Data Table on Between 100W to 299W - Year-over-year growth 2025-2030 (%)

10.4 Between 300W to 999W - Market size and forecast 2025-2030

Chart on Between 300W to 999W - Market size and forecast 2025-2030 ($ million)
Data Table on Between 300W to 999W - Market size and forecast 2025-2030 ($ million)
Chart on Between 300W to 999W - Year-over-year growth 2025-2030 (%)
Data Table on Between 300W to 999W - Year-over-year growth 2025-2030 (%)

10.5 Below 100W - Market size and forecast 2025-2030

Chart on Below 100W - Market size and forecast 2025-2030 ($ million)
Data Table on Below 100W - Market size and forecast 2025-2030 ($ million)
Chart on Below 100W - Year-over-year growth 2025-2030 (%)
Data Table on Below 100W - Year-over-year growth 2025-2030 (%)

10.6 Above 1000W - Market size and forecast 2025-2030

Chart on Above 1000W - Market size and forecast 2025-2030 ($ million)
Data Table on Above 1000W - Market size and forecast 2025-2030 ($ million)
Chart on Above 1000W - Year-over-year growth 2025-2030 (%)
Data Table on Above 1000W - Year-over-year growth 2025-2030 (%)

10.7 Market opportunity by Power Rating

Market opportunity by Power Rating ($ million)
Data Table on Market opportunity by Power Rating ($ million)

11. Customer Landscape

11.1 Customer landscape overview

Analysis of price sensitivity, lifecycle, customer purchase basket, adoption rates, and purchase criteria

12. Geographic Landscape

12.1 Geographic segmentation

Chart on Market share by geography 2025-2030 (%)
Data Table on Market share by geography 2025-2030 (%)

12.2 Geographic comparison

Chart on Geographic comparison
Data Table on Geographic comparison

12.3 APAC - Market size and forecast 2025-2030

Chart on APAC - Market size and forecast 2025-2030 ($ million)
Data Table on APAC - Market size and forecast 2025-2030 ($ million)
Chart on APAC - Year-over-year growth 2025-2030 (%)
Data Table on APAC - Year-over-year growth 2025-2030 (%)
Chart on Regional Comparison - APAC
Data Table on Regional Comparison - APAC

12.3.1 China - Market size and forecast 2025-2030

Chart on China - Market size and forecast 2025-2030 ($ million)
Data Table on China - Market size and forecast 2025-2030 ($ million)
Chart on China - Year-over-year growth 2025-2030 (%)
Data Table on China - Year-over-year growth 2025-2030 (%)

12.3.2 Japan - Market size and forecast 2025-2030

Chart on Japan - Market size and forecast 2025-2030 ($ million)
Data Table on Japan - Market size and forecast 2025-2030 ($ million)
Chart on Japan - Year-over-year growth 2025-2030 (%)
Data Table on Japan - Year-over-year growth 2025-2030 (%)

12.3.3 India - Market size and forecast 2025-2030

Chart on India - Market size and forecast 2025-2030 ($ million)
Data Table on India - Market size and forecast 2025-2030 ($ million)
Chart on India - Year-over-year growth 2025-2030 (%)
Data Table on India - Year-over-year growth 2025-2030 (%)

12.3.4 South Korea - Market size and forecast 2025-2030

Chart on South Korea - Market size and forecast 2025-2030 ($ million)
Data Table on South Korea - Market size and forecast 2025-2030 ($ million)
Chart on South Korea - Year-over-year growth 2025-2030 (%)
Data Table on South Korea - Year-over-year growth 2025-2030 (%)

12.3.5 Australia - Market size and forecast 2025-2030

Chart on Australia - Market size and forecast 2025-2030 ($ million)
Data Table on Australia - Market size and forecast 2025-2030 ($ million)
Chart on Australia - Year-over-year growth 2025-2030 (%)
Data Table on Australia - Year-over-year growth 2025-2030 (%)

12.3.6 Indonesia - Market size and forecast 2025-2030

Chart on Indonesia - Market size and forecast 2025-2030 ($ million)
Data Table on Indonesia - Market size and forecast 2025-2030 ($ million)
Chart on Indonesia - Year-over-year growth 2025-2030 (%)
Data Table on Indonesia - Year-over-year growth 2025-2030 (%)

12.4 North America - Market size and forecast 2025-2030

Chart on North America - Market size and forecast 2025-2030 ($ million)
Data Table on North America - Market size and forecast 2025-2030 ($ million)
Chart on North America - Year-over-year growth 2025-2030 (%)
Data Table on North America - Year-over-year growth 2025-2030 (%)
Chart on Regional Comparison - North America
Data Table on Regional Comparison - North America

12.4.1 US - Market size and forecast 2025-2030

Chart on US - Market size and forecast 2025-2030 ($ million)
Data Table on US - Market size and forecast 2025-2030 ($ million)
Chart on US - Year-over-year growth 2025-2030 (%)
Data Table on US - Year-over-year growth 2025-2030 (%)

12.4.2 Canada - Market size and forecast 2025-2030

Chart on Canada - Market size and forecast 2025-2030 ($ million)
Data Table on Canada - Market size and forecast 2025-2030 ($ million)
Chart on Canada - Year-over-year growth 2025-2030 (%)
Data Table on Canada - Year-over-year growth 2025-2030 (%)

12.4.3 Mexico - Market size and forecast 2025-2030

Chart on Mexico - Market size and forecast 2025-2030 ($ million)
Data Table on Mexico - Market size and forecast 2025-2030 ($ million)
Chart on Mexico - Year-over-year growth 2025-2030 (%)
Data Table on Mexico - Year-over-year growth 2025-2030 (%)

12.5 Europe - Market size and forecast 2025-2030

Chart on Europe - Market size and forecast 2025-2030 ($ million)
Data Table on Europe - Market size and forecast 2025-2030 ($ million)
Chart on Europe - Year-over-year growth 2025-2030 (%)
Data Table on Europe - Year-over-year growth 2025-2030 (%)
Chart on Regional Comparison - Europe
Data Table on Regional Comparison - Europe

12.5.1 Germany - Market size and forecast 2025-2030

Chart on Germany - Market size and forecast 2025-2030 ($ million)
Data Table on Germany - Market size and forecast 2025-2030 ($ million)
Chart on Germany - Year-over-year growth 2025-2030 (%)
Data Table on Germany - Year-over-year growth 2025-2030 (%)

12.5.2 UK - Market size and forecast 2025-2030

Chart on UK - Market size and forecast 2025-2030 ($ million)
Data Table on UK - Market size and forecast 2025-2030 ($ million)
Chart on UK - Year-over-year growth 2025-2030 (%)
Data Table on UK - Year-over-year growth 2025-2030 (%)

12.5.3 France - Market size and forecast 2025-2030

Chart on France - Market size and forecast 2025-2030 ($ million)
Data Table on France - Market size and forecast 2025-2030 ($ million)
Chart on France - Year-over-year growth 2025-2030 (%)
Data Table on France - Year-over-year growth 2025-2030 (%)

12.5.4 Italy - Market size and forecast 2025-2030

Chart on Italy - Market size and forecast 2025-2030 ($ million)
Data Table on Italy - Market size and forecast 2025-2030 ($ million)
Chart on Italy - Year-over-year growth 2025-2030 (%)
Data Table on Italy - Year-over-year growth 2025-2030 (%)

12.5.5 Spain - Market size and forecast 2025-2030

Chart on Spain - Market size and forecast 2025-2030 ($ million)
Data Table on Spain - Market size and forecast 2025-2030 ($ million)
Chart on Spain - Year-over-year growth 2025-2030 (%)
Data Table on Spain - Year-over-year growth 2025-2030 (%)

12.5.6 The Netherlands - Market size and forecast 2025-2030

Chart on The Netherlands - Market size and forecast 2025-2030 ($ million)
Data Table on The Netherlands - Market size and forecast 2025-2030 ($ million)
Chart on The Netherlands - Year-over-year growth 2025-2030 (%)
Data Table on The Netherlands - Year-over-year growth 2025-2030 (%)

12.6 Middle East and Africa - Market size and forecast 2025-2030

Chart on Middle East and Africa - Market size and forecast 2025-2030 ($ million)
Data Table on Middle East and Africa - Market size and forecast 2025-2030 ($ million)
Chart on Middle East and Africa - Year-over-year growth 2025-2030 (%)
Data Table on Middle East and Africa - Year-over-year growth 2025-2030 (%)
Chart on Regional Comparison - Middle East and Africa
Data Table on Regional Comparison - Middle East and Africa

12.6.1 Saudi Arabia - Market size and forecast 2025-2030

Chart on Saudi Arabia - Market size and forecast 2025-2030 ($ million)
Data Table on Saudi Arabia - Market size and forecast 2025-2030 ($ million)
Chart on Saudi Arabia - Year-over-year growth 2025-2030 (%)
Data Table on Saudi Arabia - Year-over-year growth 2025-2030 (%)

12.6.2 UAE - Market size and forecast 2025-2030

Chart on UAE - Market size and forecast 2025-2030 ($ million)
Data Table on UAE - Market size and forecast 2025-2030 ($ million)
Chart on UAE - Year-over-year growth 2025-2030 (%)
Data Table on UAE - Year-over-year growth 2025-2030 (%)

12.6.3 South Africa - Market size and forecast 2025-2030

Chart on South Africa - Market size and forecast 2025-2030 ($ million)
Data Table on South Africa - Market size and forecast 2025-2030 ($ million)
Chart on South Africa - Year-over-year growth 2025-2030 (%)
Data Table on South Africa - Year-over-year growth 2025-2030 (%)

12.6.4 Turkey - Market size and forecast 2025-2030

Chart on Turkey - Market size and forecast 2025-2030 ($ million)
Data Table on Turkey - Market size and forecast 2025-2030 ($ million)
Chart on Turkey - Year-over-year growth 2025-2030 (%)
Data Table on Turkey - Year-over-year growth 2025-2030 (%)

12.6.5 Israel - Market size and forecast 2025-2030

Chart on Israel - Market size and forecast 2025-2030 ($ million)
Data Table on Israel - Market size and forecast 2025-2030 ($ million)
Chart on Israel - Year-over-year growth 2025-2030 (%)
Data Table on Israel - Year-over-year growth 2025-2030 (%)

12.7 South America - Market size and forecast 2025-2030

Chart on South America - Market size and forecast 2025-2030 ($ million)
Data Table on South America - Market size and forecast 2025-2030 ($ million)
Chart on South America - Year-over-year growth 2025-2030 (%)
Data Table on South America - Year-over-year growth 2025-2030 (%)
Chart on Regional Comparison - South America
Data Table on Regional Comparison - South America

12.7.1 Brazil - Market size and forecast 2025-2030

Chart on Brazil - Market size and forecast 2025-2030 ($ million)
Data Table on Brazil - Market size and forecast 2025-2030 ($ million)
Chart on Brazil - Year-over-year growth 2025-2030 (%)
Data Table on Brazil - Year-over-year growth 2025-2030 (%)

12.7.2 Argentina - Market size and forecast 2025-2030

Chart on Argentina - Market size and forecast 2025-2030 ($ million)
Data Table on Argentina - Market size and forecast 2025-2030 ($ million)
Chart on Argentina - Year-over-year growth 2025-2030 (%)
Data Table on Argentina - Year-over-year growth 2025-2030 (%)

12.7.3 Chile - Market size and forecast 2025-2030

Chart on Chile - Market size and forecast 2025-2030 ($ million)
Data Table on Chile - Market size and forecast 2025-2030 ($ million)
Chart on Chile - Year-over-year growth 2025-2030 (%)
Data Table on Chile - Year-over-year growth 2025-2030 (%)

12.8 Market opportunity by geography

Market opportunity by geography ($ million)
Data Tables on Market opportunity by geography ($ million)

13. Drivers, Challenges, and Opportunity

13.1 Market drivers

Growing adoption across education and training environments
Increasing demand for immersive entertainment experiences
Expanding utilization in healthcare visualization applications

13.2 Market challenges

High upfront acquisition and installation expenditure
Complex content compatibility and standardization limitations
Competition from alternative large format display technologies

13.3 Impact of drivers and challenges

Impact of drivers and challenges in 2025 and 2030

13.4 Market opportunities

Advancing integration of AI-enabled projection optimization
Accelerating shift toward laser-based projection platforms
Evolving deployment of interactive projection ecosystems

14. Competitive Landscape

14.1 Overview

14.2

Overview on criticality of inputs and factors of differentiation

14.3 Landscape disruption

Overview on factors of disruption

14.4 Industry risks

Impact of key risks on business

15. Competitive Analysis

15.1 Companies profiled

Companies covered

15.2 Company ranking index

15.3 Market positioning of companies

Matrix on companies position and classification

15.4 Acer Inc.

Acer Inc. - Overview
Acer Inc. - Business segments
Acer Inc. - Key offerings
Acer Inc. - Segment focus
SWOT

15.5 Barco NV

Barco NV - Overview
Barco NV - Business segments
Barco NV - Key offerings
Barco NV - Segment focus
SWOT

15.6 BenQ Corp.

BenQ Corp. - Overview
BenQ Corp. - Product / Service
BenQ Corp. - Key offerings
SWOT

15.7 CASIO Computer Co. Ltd.

CASIO Computer Co. Ltd. - Overview
CASIO Computer Co. Ltd. - Business segments
CASIO Computer Co. Ltd. - Key offerings
CASIO Computer Co. Ltd. - Segment focus
SWOT

15.8 Christie Digital Systems Inc.

Christie Digital Systems Inc. - Overview
Christie Digital Systems Inc. - Product / Service
Christie Digital Systems Inc. - Key offerings
SWOT

15.9 Digital Projection Ltd.

Digital Projection Ltd. - Overview
Digital Projection Ltd. - Product / Service
Digital Projection Ltd. - Key offerings
SWOT

15.10 Formovie Innovative Technology Co

Formovie Innovative Technology Co - Overview
Formovie Innovative Technology Co - Product / Service
Formovie Innovative Technology Co - Key offerings
SWOT

15.11 JVCKENWOOD Corp

JVCKENWOOD Corp - Overview
JVCKENWOOD Corp - Business segments
JVCKENWOOD Corp - Key offerings
JVCKENWOOD Corp - Segment focus
SWOT

15.12 LG Electronics Inc.

LG Electronics Inc. - Overview
LG Electronics Inc. - Business segments
LG Electronics Inc. - Key news
LG Electronics Inc. - Key offerings
LG Electronics Inc. - Segment focus
SWOT

15.13 Panasonic Holdings Corp.

Panasonic Holdings Corp. - Overview
Panasonic Holdings Corp. - Business segments
Panasonic Holdings Corp. - Key news
Panasonic Holdings Corp. - Key offerings
Panasonic Holdings Corp. - Segment focus
SWOT

15.14 Seiko Epson Corp.

Seiko Epson Corp. - Overview
Seiko Epson Corp. - Business segments
Seiko Epson Corp. - Key offerings
Seiko Epson Corp. - Segment focus
SWOT

15.15 Sharp Corp.

Sharp Corp. - Overview
Sharp Corp. - Business segments
Sharp Corp. - Key offerings
Sharp Corp. - Segment focus
SWOT

15.16 Sony Group Corp.

Sony Group Corp. - Overview
Sony Group Corp. - Business segments
Sony Group Corp. - Key news
Sony Group Corp. - Key offerings
Sony Group Corp. - Segment focus
SWOT

15.17 ViewSonic Corp.

ViewSonic Corp. - Overview
ViewSonic Corp. - Product / Service
ViewSonic Corp. - Key offerings
SWOT

15.18 XGIMI Technology Co. Ltd.

XGIMI Technology Co. Ltd. - Overview
XGIMI Technology Co. Ltd. - Business segments
XGIMI Technology Co. Ltd. - Key offerings
XGIMI Technology Co. Ltd. - Segment focus
SWOT

16. Appendix

16.1 Scope of the report

Market definition
Objectives
Notes and caveats

16.2 Inclusions and exclusions checklist

Inclusions checklist
Exclusions checklist

16.3 Currency conversion rates for US$

16.4 Research methodology

16.5 Data procurement

Information sources

16.6 Data validation

16.7 Validation techniques employed for market sizing

16.8 Data synthesis

16.9 360 degree market analysis

16.10 List of abbreviations

Research Methodology

Technavio presents a detailed picture of the market by way of study, synthesis, and summation of data from multiple sources. The analysts have presented the various facets of the market with a particular focus on identifying the key industry influencers. The data thus presented is comprehensive, reliable, and the result of extensive research, both primary and secondary.

INFORMATION SOURCES

Primary sources

  • Manufacturers and suppliers
  • Channel partners
  • Industry experts
  • Strategic decision makers

Secondary sources

  • Industry journals and periodicals
  • Government data
  • Financial reports of key industry players
  • Historical data
  • Press releases

DATA ANALYSIS

Data Synthesis

  • Collation of data
  • Estimation of key figures
  • Analysis of derived insights

Data Validation

  • Triangulation with data models
  • Reference against proprietary databases
  • Corroboration with industry experts

REPORT WRITING

Qualitative

  • Market drivers
  • Market challenges
  • Market trends
  • Five forces analysis

Quantitative

  • Market size and forecast
  • Market segmentation
  • Geographical insights
  • Competitive landscape

Interested in this report?

Get your sample now to see our research methodology and insights!

Download Now

Frequently Asked Questions

3D Projector market growth will increase by USD 1274.3 million during 2026-2030.

The 3D Projector market is expected to grow at a CAGR of 7.4% during 2026-2030.

3D Projector market is segmented by Technology (DLP, LCD, LCoS) Source (Laser, LED, Metal halide, Others) Power rating (Between 100W to 299W, Between 300W to 999W, Below 100W, Above 1000W)

Acer Inc., Barco NV, BenQ Corp., CASIO Computer Co. Ltd., Christie Digital Systems Inc., Digital Projection Ltd., Formovie Innovative Technology Co, InFocus, JVCKENWOOD Corp, LG Electronics Inc., Optoma Corp., Panasonic Holdings Corp., Seiko Epson Corp., Sharp Corp., Shenzhen Holatek Co. Ltd., Sony Group Corp., ViewSonic Corp., Vivitek, XGIMI Technology Co. Ltd. are a few of the key vendors in the 3D Projector market.

APAC will register the highest growth rate of 45.6% among the other regions. Therefore, the 3D Projector market in APAC is expected to garner significant business opportunities for the vendors during the forecast period.

China, Japan, India, South Korea, Australia, Indonesia, US, Canada, Mexico, Germany, UK, France, Italy, Spain, The Netherlands, Saudi Arabia, UAE, South Africa, Turkey, Israel, Brazil, Argentina, Chile

  • Growing adoption across education and training environments is the driving factor this market.

The 3D Projector market vendors should focus on grabbing business opportunities from the Technology segment as it accounted for the largest market share in the base year.
RIA - Research AI Assistant
Ask RIA
