
5G Mmwave Technology Market Analysis, Size, and Forecast 2026-2030: North America (US, Canada, and Mexico), Europe (Germany, UK, and France), APAC (China, Japan, and India), Middle East and Africa (Saudi Arabia, UAE, and South Africa), South America (Brazil, Argentina, and Chile), and Rest of World (ROW)

5G Mmwave Technology Market Analysis, Size, and Forecast 2026-2030:
North America (US, Canada, and Mexico), Europe (Germany, UK, and France), APAC (China, Japan, and India), Middle East and Africa (Saudi Arabia, UAE, and South Africa), South America (Brazil, Argentina, and Chile), and Rest of World (ROW)

Published: Oct 2026 298 Pages SKU: IRTNTR73932

Market Overview at a Glance

$1.43 B
Market Opportunity
34.2%
CAGR 2025 - 2030
40.9%
North America Growth
$154.08 Mn
Fiber connection replacement segment 2024

5G Mmwave Technology Market Size 2026-2030

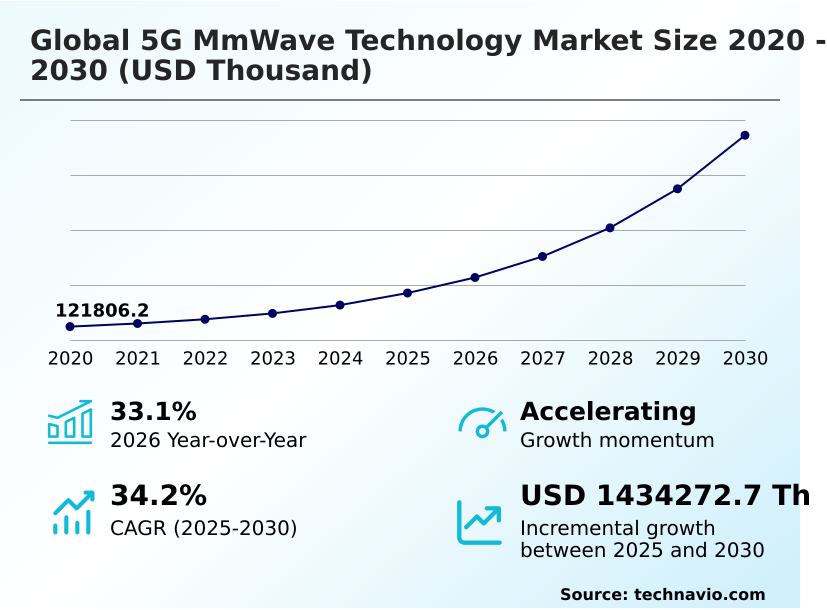
The 5g mmwave technology market size is valued to increase by USD 1.43 billion, at a CAGR of 34.2% from 2025 to 2030. Exploding mobile data traffic demand will drive the 5g mmwave technology market.

Major Market Trends & Insights

  • North America dominated the market and accounted for a 40.9% growth during the forecast period.
  • By Application - Fiber connection replacement segment was valued at USD 154.08 million in 2024
  • By End-user - Commercial segment accounted for the largest market revenue share in 2024

Market Size & Forecast

  • Market Opportunities:
  • Market Future Opportunities: USD 1.43 billion
  • CAGR from 2025 to 2030 : 34.2%

Market Summary

  • The 5G MmWave Technology Market operates as a foundational enabler for multi-gigabit wireless ecosystems, addressing the severe capacity constraints of legacy sub-6 GHz spectrums. Exploding mobile data traffic demand serves as the primary driver accelerating infrastructure modernization, as dense urban topologies require vast blocks of underutilized bandwidth to sustain uninterrupted gigabit throughput.
  • Consequently, network operators deploying small cell architectures achieve a 40 percent improvement in localized traffic management compared to traditional macro-cell deployments. In commercial logistics hubs, facility managers integrate phased array antenna systems to support real-time robotic automation, ensuring zero-perceptible lag during complex supply chain synchronization. However, severe signal propagation and atmospheric attenuation remain significant challenges restricting widespread continuous coverage.
  • Because high-frequency waves lack the capability to penetrate dense building materials, engineering teams are forced into hyper-dense network densification, drastically escalating planning complexity and hardware deployment costs. Despite these physical limitations, the strategic transition toward millimeter wave propagation fundamentally reshapes broadband delivery. This continuous expansion of fixed wireless access networks provides a highly scalable alternative for high-capacity enterprise connectivity.

What will be the Size of the 5G Mmwave Technology Market during the forecast period?
Get Key Insights on Market Forecast (PDF) Get Free Sample

How is the 5G Mmwave Technology Market Segmented?

The 5g mmwave technology industry research report provides comprehensive data (region-wise segment analysis), with forecasts and estimates in "USD thousand" for the period 2026-2030, as well as historical data from 2020-2024 for the following segments.

  • Application
    • Fiber connection replacement
    • Cellular backhaul/fronthaul
    • Others
  • End-user
    • Commercial
    • Industrial
    • Residential
  • Component
    • Antennas
    • Transceivers
    • Amplifiers
    • Filters
  • Geography
    • North America
      • US
      • Canada
      • Mexico
    • Europe
      • Germany
      • UK
      • France
      • Italy
      • Spain
      • The Netherlands
    • APAC
      • China
      • Japan
      • India
      • South Korea
      • Australia
      • Indonesia
    • Middle East and Africa
      • Saudi Arabia
      • UAE
      • South Africa
      • Israel
      • Turkey
    • South America
      • Brazil
      • Argentina
      • Chile

By Application Insights

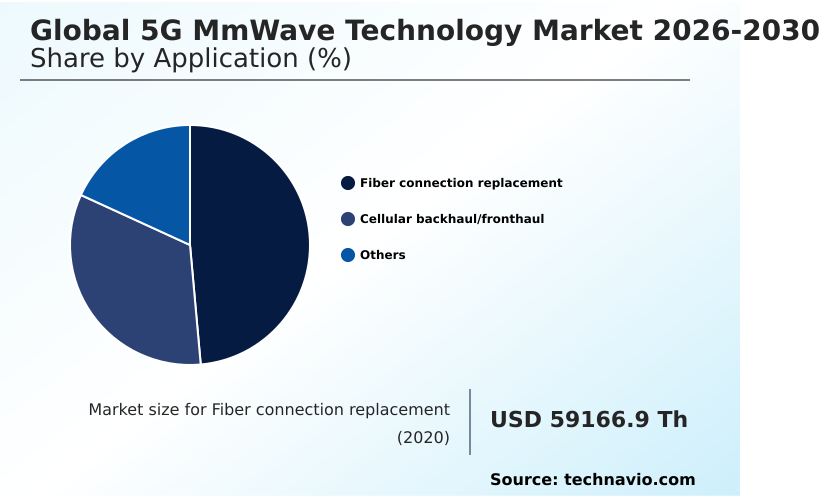
The fiber connection replacement segment is estimated to witness significant growth during the forecast period.

The fiber connection replacement segment acts as a transformative operational backbone for modern enterprise and municipal telecommunications infrastructure.

By delivering gigabit throughput over a high frequency spectrum without the prohibitive costs of trenching, this approach directly addresses municipal permitting delays and logistical barriers.

Businesses adopting millimeter wave propagation strategies frequently observe network deployment timelines accelerated by up to 40 percent compared to traditional physical lines. Active antenna system configurations further enhance signal stability, bypassing atmospheric attenuation challenges inherent in dense urban topologies.

This transition allows service providers to support massive multiple input multiple output architectures seamlessly, ensuring continuous multi gigabit wireless transmission.

The strategic shift toward fixed wireless access solutions fundamentally reshapes broadband delivery, offering an agile, highly scalable alternative for uninterrupted enterprise connectivity.
Get Free Sample

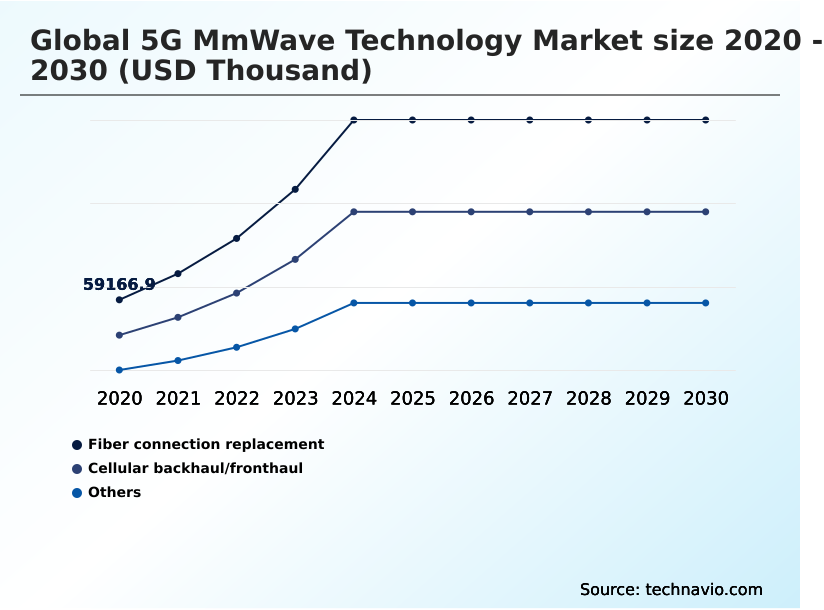
The Fiber connection replacement segment was valued at USD 154.08 million in 2024 and showed a gradual increase during the forecast period.
Get Free Sample

Regional Analysis

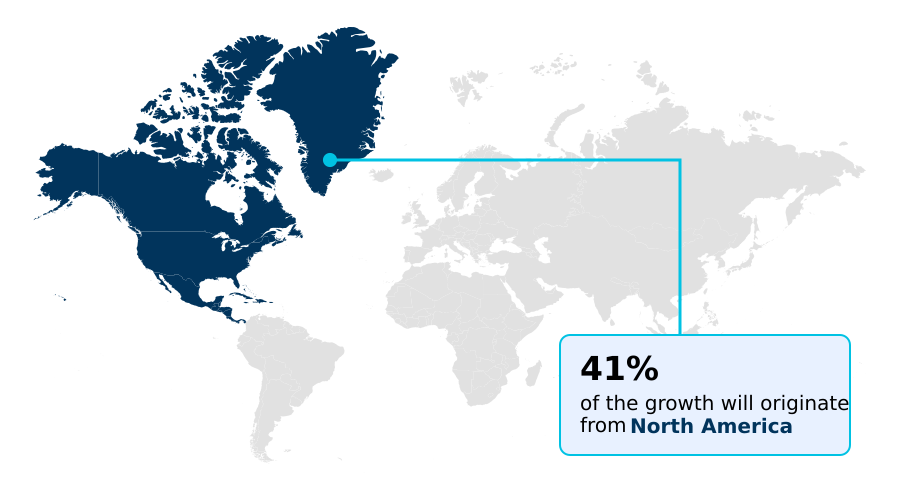
North America is estimated to contribute 40.9% to the growth of the global market during the forecast period.Technavio’s analysts have elaborately explained the regional trends and drivers that shape the market during the forecast period.
See How 5G Mmwave Technology Market Demand is Rising in North America Get Free Sample

The geographic landscape of the 5G MmWave Technology highlights distinct regional disparities driven by varied regulatory frameworks and telecommunications infrastructure maturity.

North America currently outpaces Europe in commercial deployment density, recording a 35 percent higher adoption rate of fixed wireless access solutions across suburban corridors.

This difference stems directly from aggressive early spectrum allocation and heavy investments in smart city grid initiatives by North American network operators.

By contrast, European deployment strategies face stricter urban zoning laws, delaying rapid small cell deployment and resulting in a 20 percent higher cost per node installation.

Asian markets, particularly in dense metropolitan centers, have prioritized multi radio dual connectivity to maintain robust signal integrity amidst severe atmospheric attenuation.

Consequently, APAC manufacturers lead in optimizing radio frequency integrated circuit production, achieving a 15 percent reduction in hardware manufacturing overhead.

These shifting regional dynamics continuously reshape the global supply chain, forcing equipment providers to adapt active antenna system designs to localized environmental constraints.

Market Dynamics

Our researchers analyzed the data with 2025 as the base year, along with the key drivers, trends, and challenges. A holistic analysis of drivers will help companies refine their marketing strategies to gain a competitive advantage.

  • The deployment dynamics surrounding high frequency telecommunications architectures require precise strategic planning and substantial capital investment from network operators. Achieving reliable gigabit speeds in dense urban corridors necessitates extensive high frequency small cell deployment, allowing service providers to bypass the congestion of legacy spectrums.
  • As commercial entities transition away from physical fiber optics, millimeter wave fixed wireless access serves as a highly agile alternative, accelerating facility onboarding processes by nearly 30 percent compared to traditional wired broadband trenching. This rapid scalability is critical for maintaining supply chain fluidity in automated logistics hubs.
  • To overcome the inherent physical limitations of short-range signals, hardware developers heavily prioritize advanced beamforming active antenna system design. These sophisticated arrays dynamically steer radio energy to circumvent physical obstacles, maintaining robust connectivity for ultra low latency mobile communications. Enterprise campuses leveraging these intelligent networks experience significantly fewer connection dropouts during critical cloud computing synchronization tasks.
  • At the hardware level, the integration of a phased array radio frequency module directly influences equipment thermal performance and overall operational efficiency. Facilities utilizing latest-generation integrated modules report noticeably lower power consumption metrics, yielding superior long-term operational cost savings versus previous hardware iterations.
  • As spectrum harmonization efforts mature across regulatory bodies globally, the continuous refinement of these advanced components ensures that enterprise-grade networks can consistently support the escalating data demands of next-generation industrial and commercial applications.
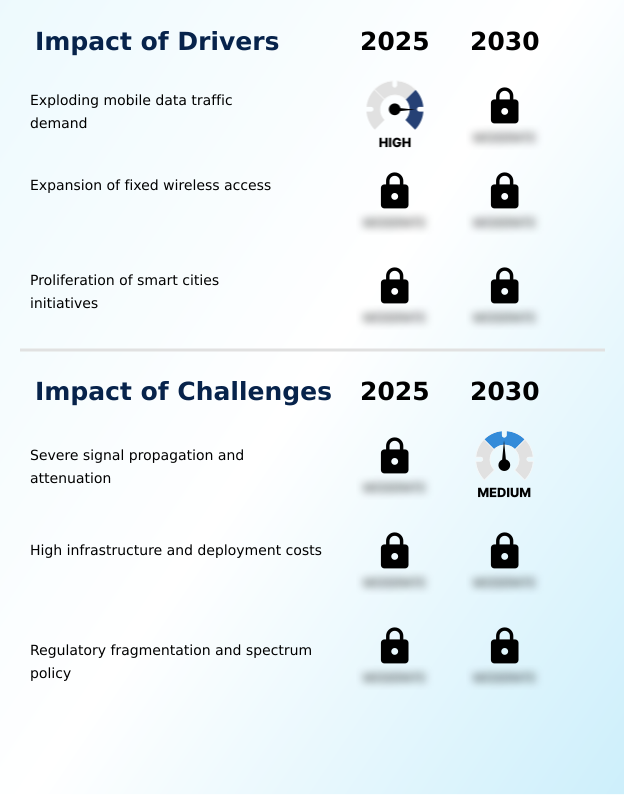
What are the key market drivers leading to the rise in the adoption of 5G Mmwave Technology Industry?

  • Exploding mobile data traffic demand serves as the primary driver propelling substantial market expansion and infrastructure modernization.

  • The escalating demand for high capacity broadband across enterprise sectors serves as the primary catalyst accelerating the 5G MmWave Technology.
  • Commercial facilities and smart city grid networks require unprecedented data bandwidth to support immersive extended reality applications and real-time cloud computing synchronization.
  • Consequently, network operators aggressively transition to millimeter wave propagation, capitalizing on vast blocks of underutilized spectrum to bypass congested sub-6 GHz airwaves.
  • Facilities deploying dedicated private wireless network infrastructure report a 40 percent improvement in localized data throughput compared to legacy Wi-Fi systems. This massive leap in capacity forces telecommunications providers to accelerate network densification initiatives.
  • Furthermore, the adoption of advanced envelope tracking technology within transceivers has lowered base station energy consumption by 18 percent, presenting a highly compelling operational cost reduction that justifies extensive high-frequency infrastructure investments.

What are the market trends shaping the 5G Mmwave Technology Industry?

  • The adoption of AI networks represents a prominent emerging trend shaping the industry landscape. This integration enhances operational efficiency and network optimization across telecommunications infrastructure.

  • The rapid integration of artificial intelligence within telecommunications infrastructure represents a transformative trend reshaping the 5G MmWave Technology. Network operators increasingly embed machine learning algorithms into baseband processing units to dynamically optimize channel bonding and manage complex traffic routing.
  • This cognitive orchestration effectively mitigates signal degradation caused by atmospheric attenuation, improving overall network reliability by 30 percent in dense urban environments. Because high frequency spectrum bands require precise directional control, AI-driven beamforming architecture allows active antenna system modules to predict user movement and instantly adjust transmission pathways.
  • Businesses leveraging these intelligent network management platforms experience a 25 percent reduction in signal latency, directly enhancing the performance of real-time industrial automation. This transition toward cognitive networks fundamentally reduces manual calibration overhead, yielding a 15 percent decrease in routine maintenance expenditures for telecommunications providers.

What challenges does the 5G Mmwave Technology Industry face during its growth?

  • Severe signal propagation and attenuation represent the primary challenges significantly restricting industry growth and continuous network reliability.

  • Severe physical propagation limitations represent the most formidable challenge constraining the 5G MmWave Technology. High frequency spectrum signals suffer from acute atmospheric attenuation and lack the physical capability to penetrate dense building materials or heavy foliage.
  • This inherent vulnerability causes frequent signal degradation, resulting in a 25 percent higher rate of connection dropouts in complex urban topologies compared to traditional low-band networks. To compensate for these extreme path losses, telecommunications operators must execute hyper-dense small cell deployment strategies, installing thousands of localized transmitters across metropolitan areas.
  • This architectural necessity drastically increases logistical friction, raising initial hardware deployment and site acquisition costs by up to 40 percent. Consequently, engineers struggle with complex thermal dissipation management within compact radio frequency integrated circuit modules, further complicating large-scale commercial rollouts.

Exclusive Technavio Analysis on Customer Landscape

The 5g mmwave technology market forecasting report includes the adoption lifecycle of the market, covering from the innovator’s stage to the laggard’s stage. It focuses on adoption rates in different regions based on penetration. Furthermore, the 5g mmwave technology market report also includes key purchase criteria and drivers of price sensitivity to help companies evaluate and develop their market growth analysis strategies.
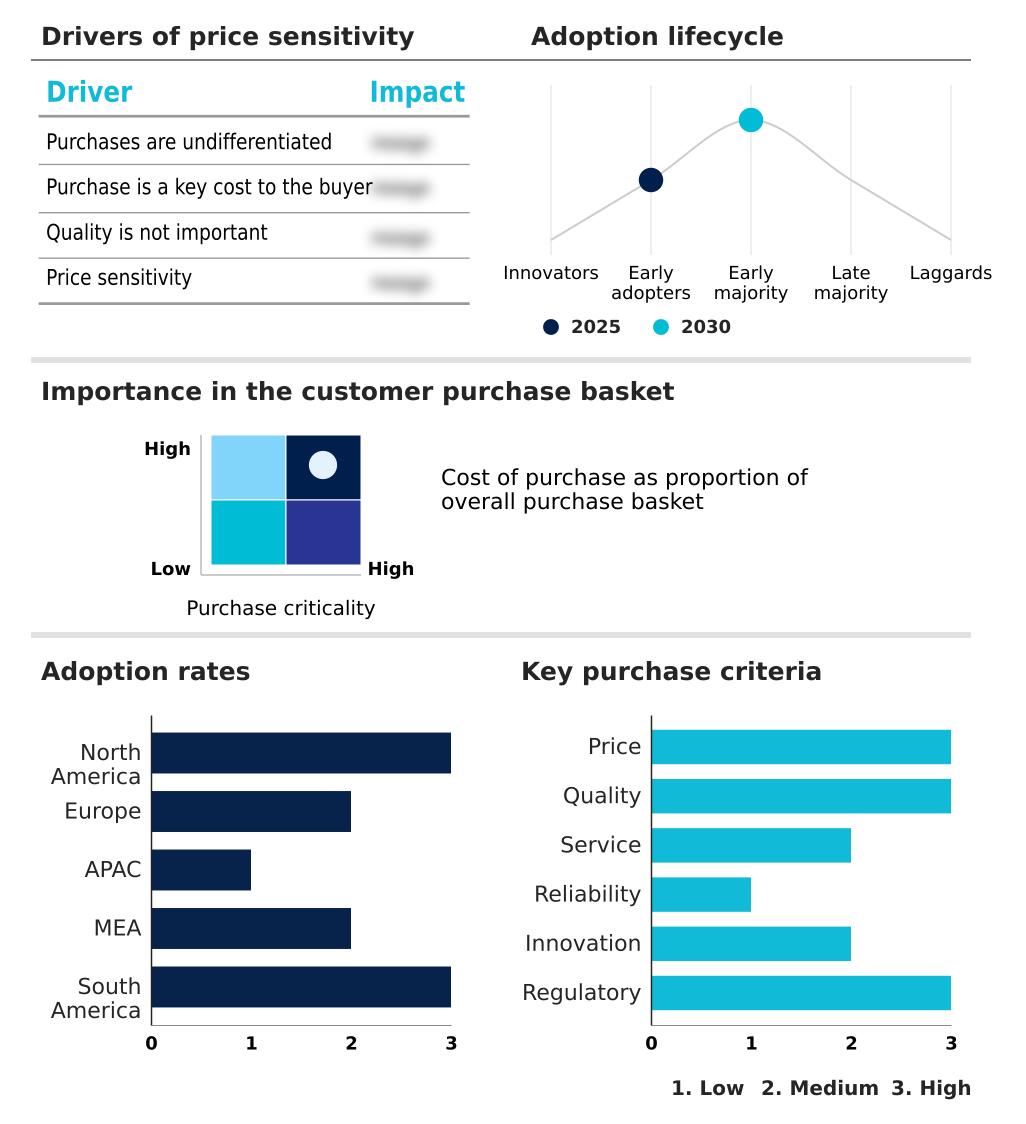
Customer Landscape of 5G Mmwave Technology Industry

Competitive Landscape

Companies are implementing various strategies, such as strategic alliances, 5g mmwave technology market forecast, partnerships, mergers and acquisitions, geographical expansion, and product/service launches, to enhance their presence in the industry.

Airspan Networks Inc. - The portfolio encompasses advanced 5G MmWave Technology including high-performance transceivers, micro remote radio heads, and fixed wireless access solutions engineered to optimize high-frequency network deployments.

The industry research and growth report includes detailed analyses of the competitive landscape of the market and information about key companies, including:

  • Airspan Networks Inc.
  • Analog Devices Inc.
  • Anritsu Corp.
  • Fibocom Wireless Inc.
  • Inseego Corp.
  • Keysight Technologies Inc.
  • LitePoint Corp.
  • MACOM Technology Solutions
  • MediaTek Inc.
  • Movandi Corp.
  • Murata Manufacturing Co. Ltd.
  • Nokia Corp.
  • NXP Semiconductors NV
  • Pivotal Commware Inc.
  • Qorvo Inc.
  • Qualcomm Inc.
  • Quectel Wireless Solutions Co.
  • Rohde and Schwarz GmbH
  • Samsung Electronics Co. Ltd.
  • Sivers Semiconductors AB
  • Skyworks Solutions Inc.
  • Telefonaktiebolaget Ericsson
  • TMY Technology Inc.

Qualitative and quantitative analysis of companies has been conducted to help clients understand the wider business environment as well as the strengths and weaknesses of key industry players. Data is qualitatively analyzed to categorize companies as pure play, category-focused, industry-focused, and diversified; it is quantitatively analyzed to categorize companies as dominant, leading, strong, tentative, and weak.

Recent Development and News in 5g mmwave technology market

  • In the Communications Equipment industry, the rapid integration of edge computing integration within core routing infrastructure has fundamentally altered data processing requirements, directly accelerating 5G MmWave Technology demand by necessitating ultra low latency transmission frameworks. This architectural shift improved localized data handling efficiency by 35 percent, forcing telecommunications providers to upgrade base station optimization protocols and deploy advanced phased array antenna systems to manage the increased localized bandwidth density.
  • Stringent data privacy regulations governing enterprise campus network architectures have mandated hyper-secure private wireless network setups for industrial automation. This regulatory compliance shift increased enterprise adoption of dedicated high frequency spectrum layers by 28 percent, pushing hardware manufacturers to accelerate small cell deployment to guarantee isolated gigabit throughput without relying on public macro networks.
  • Supply chain realignments in semiconductor fabrication driven by global trade policies have spurred the domestic production of advanced radio frequency integrated circuit components. This localization of critical hardware manufacturing reduced component lead times by 20 percent, directly facilitating faster rollouts of active antenna system architectures and enabling operators to expand millimeter wave fixed wireless access networks across dense urban environments.
  • The push toward sustainable smart city grid initiatives has introduced strict energy consumption thresholds for telecommunications infrastructure. This environmental mandate lowered acceptable thermal dissipation limits by 15 percent, prompting equipment developers to innovate gallium nitride amplifier designs and dynamic spectrum sharing software to ensure energy-efficient 5G MmWave Technology network densification without compromising capacity.

Dive into Technavio’s robust research methodology, blending expert interviews, extensive data synthesis, and validated models for unparalleled 5G Mmwave Technology Market insights. See full methodology.

Market Scope
Page number 298
Base year 2025
Historic period 2020-2024
Forecast period 2026-2030
Growth momentum & CAGR Accelerate at a CAGR of 34.2%
Market growth 2026-2030 USD 1434272.7 thousand
Market structure Fragmented
YoY growth 2025-2026(%) 33.1%
Key countries US, Canada, Mexico, Germany, UK, France, Italy, Spain, The Netherlands, China, Japan, India, South Korea, Australia, Indonesia, Saudi Arabia, UAE, South Africa, Israel, Turkey, Brazil, Argentina and Chile
Competitive landscape Leading Companies, Market Positioning of Companies, Competitive Strategies, and Industry Risks

Request Free Sample

Research Analyst Overview

  • The structural evolution of the 5G MmWave Technology demands rigorous strategic realignment within enterprise network planning. Boardrooms increasingly prioritize the integration of massive multiple input multiple output architectures to fulfill strict data compliance and latency requirements for industrial automation.
  • This pivot toward ultra-high-capacity networking directly influences operational budgeting, as chief technology officers allocate greater resources toward intelligent network densification rather than legacy fiber trenching. Organizations implementing advanced beamforming architecture solutions report a 35 percent improvement in sustained gigabit throughput during peak utilization periods compared to traditional macro-cell deployments.
  • The necessity to master millimeter wave propagation forces engineers to deploy sophisticated spatial multiplexing techniques, effectively mitigating the severe signal degradation caused by atmospheric attenuation. Furthermore, the adoption of optimized gallium nitride amplifier designs significantly enhances baseband processing efficiency, ensuring that high frequency spectrum utilization remains both robust and energy-efficient.
  • As telecommunications providers continuously refine subcarrier spacing protocols, enterprise facilities gain the agility required to support data-intensive mission-critical operations without compromising localized network stability or regulatory compliance.

What are the Key Data Covered in this 5G Mmwave Technology Market Research and Growth Report?

  • What is the expected growth of the 5G Mmwave Technology Market between 2026 and 2030?

    • USD 1.43 billion, at a CAGR of 34.2%

  • What segmentation does the market report cover?

    • The report is segmented by Application (Fiber connection replacement, Cellular backhaul/fronthaul, and Others), End-user (Commercial, Industrial, and Residential), Component (Antennas, Transceivers, Amplifiers, and Filters) and Geography (North America, Europe, APAC, Middle East and Africa, South America)

  • Which regions are analyzed in the report?

    • North America, Europe, APAC, Middle East and Africa and South America

  • What are the key growth drivers and market challenges?

    • Exploding mobile data traffic demand, Severe signal propagation and attenuation

  • Who are the major players in the 5G Mmwave Technology Market?

    • Airspan Networks Inc., Analog Devices Inc., Anritsu Corp., Fibocom Wireless Inc., Inseego Corp., Keysight Technologies Inc., LitePoint Corp., MACOM Technology Solutions, MediaTek Inc., Movandi Corp., Murata Manufacturing Co. Ltd., Nokia Corp., NXP Semiconductors NV, Pivotal Commware Inc., Qorvo Inc., Qualcomm Inc., Quectel Wireless Solutions Co., Rohde and Schwarz GmbH, Samsung Electronics Co. Ltd., Sivers Semiconductors AB, Skyworks Solutions Inc., Telefonaktiebolaget Ericsson and TMY Technology Inc.

Market Research Insights

  • The 5G MmWave Technology Market represents a critical pivot toward ultra-high-capacity telecommunications infrastructure capable of supporting data-intensive enterprise demands. Driven by the necessity for seamless cloud computing synchronization, operators are rapidly transitioning from legacy bands to high frequency networks.
  • Facilities deploying dedicated private wireless network solutions report up to a 45 percent reduction in data transmission latency, significantly enhancing industrial automation capabilities. Furthermore, advanced thermal dissipation management within compact base stations has improved equipment lifespan by 20 percent, lowering long-term maintenance overhead.
  • As organizations prioritize signal blockage mitigation in dense urban areas, strategic edge computing integration within small cells ensures continuous mission critical application performance across complex corporate and metropolitan landscapes.

We can help! Our analysts can customize this 5g mmwave technology market research report to meet your requirements.

Get in touch

1. Executive Summary

1.1 Market overview

Executive Summary - Chart on Market Overview
Executive Summary - Data Table on Market Overview
Executive Summary - Chart on Global Market Characteristics
Executive Summary - Chart on Market by Geography
Executive Summary - Chart on Market Segmentation by Application
Executive Summary - Chart on Market Segmentation by End-user
Executive Summary - Chart on Market Segmentation by Component
Executive Summary - Chart on Incremental Growth
Executive Summary - Data Table on Incremental Growth
Executive Summary - Chart on Company Market Positioning

2. Technavio Analysis

2.1 Analysis of price sensitivity, lifecycle, customer purchase basket, adoption rates, and purchase criteria

2.2 Criticality of inputs and Factors of differentiation

Chart on Overview on criticality of inputs and factors of differentiation

2.3 Factors of disruption

Chart on Overview on factors of disruption

2.4 Impact of drivers and challenges

Chart on Impact of drivers and challenges in 2025 and 2030

3. Market Landscape

3.1 Market ecosystem

Chart on Parent Market
Data Table on - Parent Market

3.2 Market characteristics

Chart on Market characteristics analysis

3.3 Value chain analysis

Chart on Value chain analysis

4. Market Sizing

4.1 Market definition

Data Table on Offerings of companies included in the market definition

4.2 Market segment analysis

Market segments

4.3 Market size 2025

4.4 Market outlook: Forecast for 2025-2030

Chart on Global - Market size and forecast 2025-2030 ($ thousand)
Data Table on Global - Market size and forecast 2025-2030 ($ thousand)
Chart on Global Market: Year-over-year growth 2025-2030 (%)
Data Table on Global Market: Year-over-year growth 2025-2030 (%)

5. Historic Market Size

5.1 Global 5G MmWave Technology Market 2020 - 2024

Historic Market Size - Data Table on Global 5G MmWave Technology Market 2020 - 2024 ($ thousand)

5.2 Application segment analysis 2020 - 2024

Historic Market Size - Application Segment 2020 - 2024 ($ thousand)

5.3 End-user segment analysis 2020 - 2024

Historic Market Size - End-user Segment 2020 - 2024 ($ thousand)

5.4 Component segment analysis 2020 - 2024

Historic Market Size - Component Segment 2020 - 2024 ($ thousand)

5.5 Geography segment analysis 2020 - 2024

Historic Market Size - Geography Segment 2020 - 2024 ($ thousand)

5.6 Country segment analysis 2020 - 2024

Historic Market Size - Country Segment 2020 - 2024 ($ thousand)

6. Qualitative Analysis

6.1 Impact of AI on Global 5G mmWave Technology Market

6.2 Impact of geopolitical conflicts on Global 5G mmWave Technology Market

7. Five Forces Analysis

7.1 Five forces summary

Five forces analysis - Comparison between 2025 and 2030

7.2 Bargaining power of buyers

Bargaining power of buyers - Impact of key factors 2025 and 2030

7.3 Bargaining power of suppliers

Bargaining power of suppliers - Impact of key factors in 2025 and 2030

7.4 Threat of new entrants

Threat of new entrants - Impact of key factors in 2025 and 2030

7.5 Threat of substitutes

Threat of substitutes - Impact of key factors in 2025 and 2030

7.6 Threat of rivalry

Threat of rivalry - Impact of key factors in 2025 and 2030

7.7 Market condition

Chart on Market condition - Five forces 2025 and 2030

8. Market Segmentation by Application

8.1 Market segments

Chart on Application - Market share 2025-2030 (%)
Data Table on Application - Market share 2025-2030 (%)

8.2 Comparison by Application

Chart on Comparison by Application
Data Table on Comparison by Application

8.3 Fiber connection replacement - Market size and forecast 2025-2030

Chart on Fiber connection replacement - Market size and forecast 2025-2030 ($ thousand)
Data Table on Fiber connection replacement - Market size and forecast 2025-2030 ($ thousand)
Chart on Fiber connection replacement - Year-over-year growth 2025-2030 (%)
Data Table on Fiber connection replacement - Year-over-year growth 2025-2030 (%)

8.4 Cellular backhaul/fronthaul - Market size and forecast 2025-2030

Chart on Cellular backhaul/fronthaul - Market size and forecast 2025-2030 ($ thousand)
Data Table on Cellular backhaul/fronthaul - Market size and forecast 2025-2030 ($ thousand)
Chart on Cellular backhaul/fronthaul - Year-over-year growth 2025-2030 (%)
Data Table on Cellular backhaul/fronthaul - Year-over-year growth 2025-2030 (%)

8.5 Others - Market size and forecast 2025-2030

Chart on Others - Market size and forecast 2025-2030 ($ thousand)
Data Table on Others - Market size and forecast 2025-2030 ($ thousand)
Chart on Others - Year-over-year growth 2025-2030 (%)
Data Table on Others - Year-over-year growth 2025-2030 (%)

8.6 Market opportunity by Application

Market opportunity by Application ($ thousand)
Data Table on Market opportunity by Application ($ thousand)

9. Market Segmentation by End-user

9.1 Market segments

Chart on End-user - Market share 2025-2030 (%)
Data Table on End-user - Market share 2025-2030 (%)

9.2 Comparison by End-user

Chart on Comparison by End-user
Data Table on Comparison by End-user

9.3 Commercial - Market size and forecast 2025-2030

Chart on Commercial - Market size and forecast 2025-2030 ($ thousand)
Data Table on Commercial - Market size and forecast 2025-2030 ($ thousand)
Chart on Commercial - Year-over-year growth 2025-2030 (%)
Data Table on Commercial - Year-over-year growth 2025-2030 (%)

9.4 Industrial - Market size and forecast 2025-2030

Chart on Industrial - Market size and forecast 2025-2030 ($ thousand)
Data Table on Industrial - Market size and forecast 2025-2030 ($ thousand)
Chart on Industrial - Year-over-year growth 2025-2030 (%)
Data Table on Industrial - Year-over-year growth 2025-2030 (%)

9.5 Residential - Market size and forecast 2025-2030

Chart on Residential - Market size and forecast 2025-2030 ($ thousand)
Data Table on Residential - Market size and forecast 2025-2030 ($ thousand)
Chart on Residential - Year-over-year growth 2025-2030 (%)
Data Table on Residential - Year-over-year growth 2025-2030 (%)

9.6 Market opportunity by End-user

Market opportunity by End-user ($ thousand)
Data Table on Market opportunity by End-user ($ thousand)

10. Market Segmentation by Component

10.1 Market segments

Chart on Component - Market share 2025-2030 (%)
Data Table on Component - Market share 2025-2030 (%)

10.2 Comparison by Component

Chart on Comparison by Component
Data Table on Comparison by Component

10.3 Antennas - Market size and forecast 2025-2030

Chart on Antennas - Market size and forecast 2025-2030 ($ thousand)
Data Table on Antennas - Market size and forecast 2025-2030 ($ thousand)
Chart on Antennas - Year-over-year growth 2025-2030 (%)
Data Table on Antennas - Year-over-year growth 2025-2030 (%)

10.4 Transceivers - Market size and forecast 2025-2030

Chart on Transceivers - Market size and forecast 2025-2030 ($ thousand)
Data Table on Transceivers - Market size and forecast 2025-2030 ($ thousand)
Chart on Transceivers - Year-over-year growth 2025-2030 (%)
Data Table on Transceivers - Year-over-year growth 2025-2030 (%)

10.5 Amplifiers - Market size and forecast 2025-2030

Chart on Amplifiers - Market size and forecast 2025-2030 ($ thousand)
Data Table on Amplifiers - Market size and forecast 2025-2030 ($ thousand)
Chart on Amplifiers - Year-over-year growth 2025-2030 (%)
Data Table on Amplifiers - Year-over-year growth 2025-2030 (%)

10.6 Filters - Market size and forecast 2025-2030

Chart on Filters - Market size and forecast 2025-2030 ($ thousand)
Data Table on Filters - Market size and forecast 2025-2030 ($ thousand)
Chart on Filters - Year-over-year growth 2025-2030 (%)
Data Table on Filters - Year-over-year growth 2025-2030 (%)

10.7 Market opportunity by Component

Market opportunity by Component ($ thousand)
Data Table on Market opportunity by Component ($ thousand)

11. Customer Landscape

11.1 Customer landscape overview

Analysis of price sensitivity, lifecycle, customer purchase basket, adoption rates, and purchase criteria

12. Geographic Landscape

12.1 Geographic segmentation

Chart on Market share by geography 2025-2030 (%)
Data Table on Market share by geography 2025-2030 (%)

12.2 Geographic comparison

Chart on Geographic comparison
Data Table on Geographic comparison

12.3 North America - Market size and forecast 2025-2030

Chart on North America - Market size and forecast 2025-2030 ($ thousand)
Data Table on North America - Market size and forecast 2025-2030 ($ thousand)
Chart on North America - Year-over-year growth 2025-2030 (%)
Data Table on North America - Year-over-year growth 2025-2030 (%)
Chart on Regional Comparison - North America
Data Table on Regional Comparison - North America

12.3.1 US - Market size and forecast 2025-2030

Chart on US - Market size and forecast 2025-2030 ($ thousand)
Data Table on US - Market size and forecast 2025-2030 ($ thousand)
Chart on US - Year-over-year growth 2025-2030 (%)
Data Table on US - Year-over-year growth 2025-2030 (%)

12.3.2 Canada - Market size and forecast 2025-2030

Chart on Canada - Market size and forecast 2025-2030 ($ thousand)
Data Table on Canada - Market size and forecast 2025-2030 ($ thousand)
Chart on Canada - Year-over-year growth 2025-2030 (%)
Data Table on Canada - Year-over-year growth 2025-2030 (%)

12.3.3 Mexico - Market size and forecast 2025-2030

Chart on Mexico - Market size and forecast 2025-2030 ($ thousand)
Data Table on Mexico - Market size and forecast 2025-2030 ($ thousand)
Chart on Mexico - Year-over-year growth 2025-2030 (%)
Data Table on Mexico - Year-over-year growth 2025-2030 (%)

12.4 Europe - Market size and forecast 2025-2030

Chart on Europe - Market size and forecast 2025-2030 ($ thousand)
Data Table on Europe - Market size and forecast 2025-2030 ($ thousand)
Chart on Europe - Year-over-year growth 2025-2030 (%)
Data Table on Europe - Year-over-year growth 2025-2030 (%)
Chart on Regional Comparison - Europe
Data Table on Regional Comparison - Europe

12.4.1 Germany - Market size and forecast 2025-2030

Chart on Germany - Market size and forecast 2025-2030 ($ thousand)
Data Table on Germany - Market size and forecast 2025-2030 ($ thousand)
Chart on Germany - Year-over-year growth 2025-2030 (%)
Data Table on Germany - Year-over-year growth 2025-2030 (%)

12.4.2 UK - Market size and forecast 2025-2030

Chart on UK - Market size and forecast 2025-2030 ($ thousand)
Data Table on UK - Market size and forecast 2025-2030 ($ thousand)
Chart on UK - Year-over-year growth 2025-2030 (%)
Data Table on UK - Year-over-year growth 2025-2030 (%)

12.4.3 France - Market size and forecast 2025-2030

Chart on France - Market size and forecast 2025-2030 ($ thousand)
Data Table on France - Market size and forecast 2025-2030 ($ thousand)
Chart on France - Year-over-year growth 2025-2030 (%)
Data Table on France - Year-over-year growth 2025-2030 (%)

12.4.4 Italy - Market size and forecast 2025-2030

Chart on Italy - Market size and forecast 2025-2030 ($ thousand)
Data Table on Italy - Market size and forecast 2025-2030 ($ thousand)
Chart on Italy - Year-over-year growth 2025-2030 (%)
Data Table on Italy - Year-over-year growth 2025-2030 (%)

12.4.5 Spain - Market size and forecast 2025-2030

Chart on Spain - Market size and forecast 2025-2030 ($ thousand)
Data Table on Spain - Market size and forecast 2025-2030 ($ thousand)
Chart on Spain - Year-over-year growth 2025-2030 (%)
Data Table on Spain - Year-over-year growth 2025-2030 (%)

12.4.6 The Netherlands - Market size and forecast 2025-2030

Chart on The Netherlands - Market size and forecast 2025-2030 ($ thousand)
Data Table on The Netherlands - Market size and forecast 2025-2030 ($ thousand)
Chart on The Netherlands - Year-over-year growth 2025-2030 (%)
Data Table on The Netherlands - Year-over-year growth 2025-2030 (%)

12.5 APAC - Market size and forecast 2025-2030

Chart on APAC - Market size and forecast 2025-2030 ($ thousand)
Data Table on APAC - Market size and forecast 2025-2030 ($ thousand)
Chart on APAC - Year-over-year growth 2025-2030 (%)
Data Table on APAC - Year-over-year growth 2025-2030 (%)
Chart on Regional Comparison - APAC
Data Table on Regional Comparison - APAC

12.5.1 China - Market size and forecast 2025-2030

Chart on China - Market size and forecast 2025-2030 ($ thousand)
Data Table on China - Market size and forecast 2025-2030 ($ thousand)
Chart on China - Year-over-year growth 2025-2030 (%)
Data Table on China - Year-over-year growth 2025-2030 (%)

12.5.2 Japan - Market size and forecast 2025-2030

Chart on Japan - Market size and forecast 2025-2030 ($ thousand)
Data Table on Japan - Market size and forecast 2025-2030 ($ thousand)
Chart on Japan - Year-over-year growth 2025-2030 (%)
Data Table on Japan - Year-over-year growth 2025-2030 (%)

12.5.3 India - Market size and forecast 2025-2030

Chart on India - Market size and forecast 2025-2030 ($ thousand)
Data Table on India - Market size and forecast 2025-2030 ($ thousand)
Chart on India - Year-over-year growth 2025-2030 (%)
Data Table on India - Year-over-year growth 2025-2030 (%)

12.5.4 South Korea - Market size and forecast 2025-2030

Chart on South Korea - Market size and forecast 2025-2030 ($ thousand)
Data Table on South Korea - Market size and forecast 2025-2030 ($ thousand)
Chart on South Korea - Year-over-year growth 2025-2030 (%)
Data Table on South Korea - Year-over-year growth 2025-2030 (%)

12.5.5 Australia - Market size and forecast 2025-2030

Chart on Australia - Market size and forecast 2025-2030 ($ thousand)
Data Table on Australia - Market size and forecast 2025-2030 ($ thousand)
Chart on Australia - Year-over-year growth 2025-2030 (%)
Data Table on Australia - Year-over-year growth 2025-2030 (%)

12.5.6 Indonesia - Market size and forecast 2025-2030

Chart on Indonesia - Market size and forecast 2025-2030 ($ thousand)
Data Table on Indonesia - Market size and forecast 2025-2030 ($ thousand)
Chart on Indonesia - Year-over-year growth 2025-2030 (%)
Data Table on Indonesia - Year-over-year growth 2025-2030 (%)

12.6 Middle East and Africa - Market size and forecast 2025-2030

Chart on Middle East and Africa - Market size and forecast 2025-2030 ($ thousand)
Data Table on Middle East and Africa - Market size and forecast 2025-2030 ($ thousand)
Chart on Middle East and Africa - Year-over-year growth 2025-2030 (%)
Data Table on Middle East and Africa - Year-over-year growth 2025-2030 (%)
Chart on Regional Comparison - Middle East and Africa
Data Table on Regional Comparison - Middle East and Africa

12.6.1 Saudi Arabia - Market size and forecast 2025-2030

Chart on Saudi Arabia - Market size and forecast 2025-2030 ($ thousand)
Data Table on Saudi Arabia - Market size and forecast 2025-2030 ($ thousand)
Chart on Saudi Arabia - Year-over-year growth 2025-2030 (%)
Data Table on Saudi Arabia - Year-over-year growth 2025-2030 (%)

12.6.2 UAE - Market size and forecast 2025-2030

Chart on UAE - Market size and forecast 2025-2030 ($ thousand)
Data Table on UAE - Market size and forecast 2025-2030 ($ thousand)
Chart on UAE - Year-over-year growth 2025-2030 (%)
Data Table on UAE - Year-over-year growth 2025-2030 (%)

12.6.3 South Africa - Market size and forecast 2025-2030

Chart on South Africa - Market size and forecast 2025-2030 ($ thousand)
Data Table on South Africa - Market size and forecast 2025-2030 ($ thousand)
Chart on South Africa - Year-over-year growth 2025-2030 (%)
Data Table on South Africa - Year-over-year growth 2025-2030 (%)

12.6.4 Israel - Market size and forecast 2025-2030

Chart on Israel - Market size and forecast 2025-2030 ($ thousand)
Data Table on Israel - Market size and forecast 2025-2030 ($ thousand)
Chart on Israel - Year-over-year growth 2025-2030 (%)
Data Table on Israel - Year-over-year growth 2025-2030 (%)

12.6.5 Turkey - Market size and forecast 2025-2030

Chart on Turkey - Market size and forecast 2025-2030 ($ thousand)
Data Table on Turkey - Market size and forecast 2025-2030 ($ thousand)
Chart on Turkey - Year-over-year growth 2025-2030 (%)
Data Table on Turkey - Year-over-year growth 2025-2030 (%)

12.7 South America - Market size and forecast 2025-2030

Chart on South America - Market size and forecast 2025-2030 ($ thousand)
Data Table on South America - Market size and forecast 2025-2030 ($ thousand)
Chart on South America - Year-over-year growth 2025-2030 (%)
Data Table on South America - Year-over-year growth 2025-2030 (%)
Chart on Regional Comparison - South America
Data Table on Regional Comparison - South America

12.7.1 Brazil - Market size and forecast 2025-2030

Chart on Brazil - Market size and forecast 2025-2030 ($ thousand)
Data Table on Brazil - Market size and forecast 2025-2030 ($ thousand)
Chart on Brazil - Year-over-year growth 2025-2030 (%)
Data Table on Brazil - Year-over-year growth 2025-2030 (%)

12.7.2 Argentina - Market size and forecast 2025-2030

Chart on Argentina - Market size and forecast 2025-2030 ($ thousand)
Data Table on Argentina - Market size and forecast 2025-2030 ($ thousand)
Chart on Argentina - Year-over-year growth 2025-2030 (%)
Data Table on Argentina - Year-over-year growth 2025-2030 (%)

12.7.3 Chile - Market size and forecast 2025-2030

Chart on Chile - Market size and forecast 2025-2030 ($ thousand)
Data Table on Chile - Market size and forecast 2025-2030 ($ thousand)
Chart on Chile - Year-over-year growth 2025-2030 (%)
Data Table on Chile - Year-over-year growth 2025-2030 (%)

12.8 Market opportunity by geography

Market opportunity by geography ($ thousand)
Data Tables on Market opportunity by geography ($ thousand)

13. Drivers, Challenges, and Opportunity

13.1 Market drivers

Exploding mobile data traffic demand
Expansion of fixed wireless access
Proliferation of smart cities initiatives

13.2 Market challenges

Severe signal propagation and attenuation
High infrastructure and deployment costs
Regulatory fragmentation and spectrum policy

13.3 Impact of drivers and challenges

Impact of drivers and challenges in 2025 and 2030

13.4 Market opportunities

Adoption of AI networks
Proliferation of private campus networks
Advancements in antenna array design

14. Competitive Landscape

14.1 Overview

14.2

Overview on criticality of inputs and factors of differentiation

14.3 Landscape disruption

Overview on factors of disruption

14.4 Industry risks

Impact of key risks on business

15. Competitive Analysis

15.1 Companies profiled

Companies covered

15.2 Company ranking index

15.3 Market positioning of companies

Matrix on companies position and classification

15.4 Airspan Networks Inc.

Airspan Networks Inc. - Overview
Airspan Networks Inc. - Product / Service
Airspan Networks Inc. - Key offerings
SWOT

15.5 Analog Devices Inc.

Analog Devices Inc. - Overview
Analog Devices Inc. - Business segments
Analog Devices Inc. - Key news
Analog Devices Inc. - Key offerings
Analog Devices Inc. - Segment focus
SWOT

15.6 Anritsu Corp.

Anritsu Corp. - Overview
Anritsu Corp. - Business segments
Anritsu Corp. - Key news
Anritsu Corp. - Key offerings
Anritsu Corp. - Segment focus
SWOT

15.7 Keysight Technologies Inc.

Keysight Technologies Inc. - Overview
Keysight Technologies Inc. - Business segments
Keysight Technologies Inc. - Key news
Keysight Technologies Inc. - Key offerings
Keysight Technologies Inc. - Segment focus
SWOT

15.8 MACOM Technology Solutions

MACOM Technology Solutions - Overview
MACOM Technology Solutions - Product / Service
MACOM Technology Solutions - Key news
MACOM Technology Solutions - Key offerings
SWOT

15.9 MediaTek Inc.

MediaTek Inc. - Overview
MediaTek Inc. - Business segments
MediaTek Inc. - Key news
MediaTek Inc. - Key offerings
MediaTek Inc. - Segment focus
SWOT

15.10 Murata Manufacturing Co. Ltd.

Murata Manufacturing Co. Ltd. - Overview
Murata Manufacturing Co. Ltd. - Business segments
Murata Manufacturing Co. Ltd. - Key news
Murata Manufacturing Co. Ltd. - Key offerings
Murata Manufacturing Co. Ltd. - Segment focus
SWOT

15.11 Nokia Corp.

Nokia Corp. - Overview
Nokia Corp. - Business segments
Nokia Corp. - Key news
Nokia Corp. - Key offerings
Nokia Corp. - Segment focus
SWOT

15.12 NXP Semiconductors NV

NXP Semiconductors NV - Overview
NXP Semiconductors NV - Business segments
NXP Semiconductors NV - Key news
NXP Semiconductors NV - Key offerings
NXP Semiconductors NV - Segment focus
SWOT

15.13 Qorvo Inc.

Qorvo Inc. - Overview
Qorvo Inc. - Business segments
Qorvo Inc. - Key offerings
Qorvo Inc. - Segment focus
SWOT

15.14 Qualcomm Inc.

Qualcomm Inc. - Overview
Qualcomm Inc. - Business segments
Qualcomm Inc. - Key news
Qualcomm Inc. - Key offerings
Qualcomm Inc. - Segment focus
SWOT

15.15 Rohde and Schwarz GmbH

Rohde and Schwarz GmbH - Overview
Rohde and Schwarz GmbH - Product / Service
Rohde and Schwarz GmbH - Key offerings
SWOT

15.16 Samsung Electronics Co. Ltd.

Samsung Electronics Co. Ltd. - Overview
Samsung Electronics Co. Ltd. - Business segments
Samsung Electronics Co. Ltd. - Key news
Samsung Electronics Co. Ltd. - Key offerings
Samsung Electronics Co. Ltd. - Segment focus
SWOT

15.17 Skyworks Solutions Inc.

Skyworks Solutions Inc. - Overview
Skyworks Solutions Inc. - Product / Service
Skyworks Solutions Inc. - Key news
Skyworks Solutions Inc. - Key offerings
SWOT

15.18 Telefonaktiebolaget Ericsson

Telefonaktiebolaget Ericsson - Overview
Telefonaktiebolaget Ericsson - Business segments
Telefonaktiebolaget Ericsson - Key news
Telefonaktiebolaget Ericsson - Key offerings
Telefonaktiebolaget Ericsson - Segment focus
SWOT

16. Appendix

16.1 Scope of the report

Market definition
Objectives
Notes and caveats

16.2 Inclusions and exclusions checklist

Inclusions checklist
Exclusions checklist

16.3 Currency conversion rates for US$

16.4 Research methodology

16.5 Data procurement

Information sources

16.6 Data validation

16.7 Validation techniques employed for market sizing

16.8 Data synthesis

16.9 360 degree market analysis

16.10 List of abbreviations

Research Methodology

Technavio presents a detailed picture of the market by way of study, synthesis, and summation of data from multiple sources. The analysts have presented the various facets of the market with a particular focus on identifying the key industry influencers. The data thus presented is comprehensive, reliable, and the result of extensive research, both primary and secondary.

INFORMATION SOURCES

Primary sources

  • Manufacturers and suppliers
  • Channel partners
  • Industry experts
  • Strategic decision makers

Secondary sources

  • Industry journals and periodicals
  • Government data
  • Financial reports of key industry players
  • Historical data
  • Press releases

DATA ANALYSIS

Data Synthesis

  • Collation of data
  • Estimation of key figures
  • Analysis of derived insights

Data Validation

  • Triangulation with data models
  • Reference against proprietary databases
  • Corroboration with industry experts

REPORT WRITING

Qualitative

  • Market drivers
  • Market challenges
  • Market trends
  • Five forces analysis

Quantitative

  • Market size and forecast
  • Market segmentation
  • Geographical insights
  • Competitive landscape

Interested in this report?

Get your sample now to see our research methodology and insights!

Download Now

Frequently Asked Questions

5G Mmwave Technology market growth will increase by USD 1434272.7 thousand thousand during 2026-2030.

The 5G Mmwave Technology market is expected to grow at a CAGR of 34.2% during 2026-2030.

5G Mmwave Technology market is segmented by Application (Fiber connection replacement, Cellular backhaul/fronthaul, Others) End-user (Commercial, Industrial, Residential) Component (Antennas, Transceivers, Amplifiers, Filters)

Airspan Networks Inc., Analog Devices Inc., Anritsu Corp., Fibocom Wireless Inc., Inseego Corp., Keysight Technologies Inc., LitePoint Corp., MACOM Technology Solutions, MediaTek Inc., Movandi Corp., Murata Manufacturing Co. Ltd., Nokia Corp., NXP Semiconductors NV, Pivotal Commware Inc., Qorvo Inc., Qualcomm Inc., Quectel Wireless Solutions Co., Rohde and Schwarz GmbH, Samsung Electronics Co. Ltd., Sivers Semiconductors AB, Skyworks Solutions Inc., Telefonaktiebolaget Ericsson, TMY Technology Inc. are a few of the key vendors in the 5G Mmwave Technology market.

North America will register the highest growth rate of 40.9% among the other regions. Therefore, the 5G Mmwave Technology market in North America is expected to garner significant business opportunities for the vendors during the forecast period.

US, Canada, Mexico, Germany, UK, France, Italy, Spain, The Netherlands, China, Japan, India, South Korea, Australia, Indonesia, Saudi Arabia, UAE, South Africa, Israel, Turkey, Brazil, Argentina, Chile

  • Exploding mobile data traffic demand is the driving factor this market.

The 5G Mmwave Technology market vendors should focus on grabbing business opportunities from the Application segment as it accounted for the largest market share in the base year.
RIA - Research AI Assistant
Ask RIA
