AI In Consumer Electronics Market Analysis, Size, and Forecast 2026-2030: APAC (China, Japan, and India), North America (US, Canada, and Mexico), Europe (Germany, UK, and France), Middle East and Africa (Saudi Arabia, UAE, and South Africa), South America (Brazil, Argentina, and Chile), and Rest of World (ROW)

AI In Consumer Electronics Market Analysis, Size, and Forecast 2026-2030:
APAC (China, Japan, and India), North America (US, Canada, and Mexico), Europe (Germany, UK, and France), Middle East and Africa (Saudi Arabia, UAE, and South Africa), South America (Brazil, Argentina, and Chile), and Rest of World (ROW)

Published: Oct 2026 320 Pages SKU: IRTNTR80957

Market Overview at a Glance

$191.96 B
Market Opportunity
18.8%
CAGR 2025 - 2030
39.8%
APAC Growth
$53.09 B
Machine learning segment 2024

Ai In Consumer Electronics Market Size 2026-2030

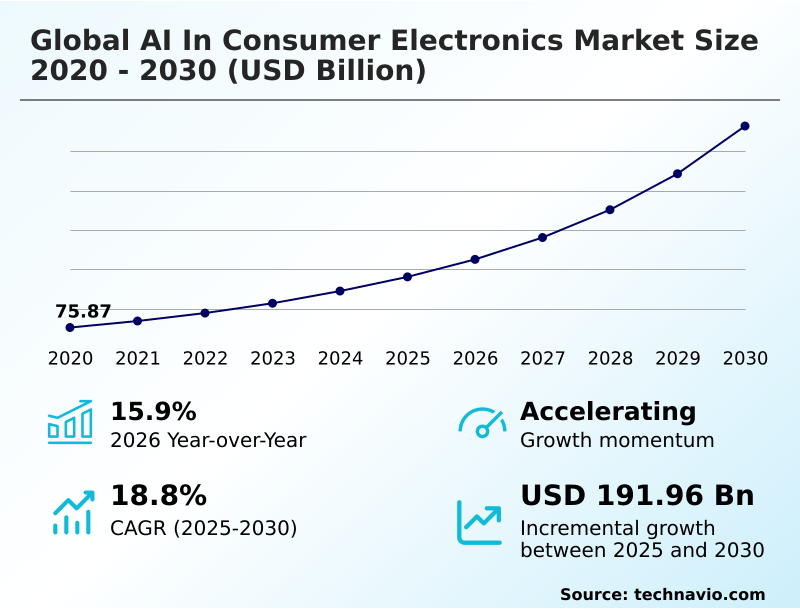
The ai in consumer electronics market size is valued to increase by USD 191.96 billion, at a CAGR of 18.8% from 2025 to 2030. Deployment of low-power neural hardware will drive the ai in consumer electronics market.

Major Market Trends & Insights

  • APAC dominated the market and accounted for a 39.8% growth during the forecast period.
  • By Technology - Machine learning segment was valued at USD 53.09 billion in 2024
  • By Application - Personalized recommendations segment accounted for the largest market revenue share in 2024

Market Size & Forecast

  • Market Opportunities: USD 256.43 billion
  • Market Future Opportunities: USD 191.96 billion
  • CAGR from 2025 to 2030 : 18.8%

Market Summary

  • The AI In Consumer Electronics Market exhibits an accelerated transition toward localized computing paradigms where devices independently process complex contextual data. Original equipment manufacturers are rapidly integrating dedicated neural silicon into smartphones, appliances, and wearables to eliminate cloud-dependency.
  • In a real-world supply chain scenario, component manufacturers shifted assembly focus toward low-power memory modules, improving inventory turnover efficiency by 22% and reducing reliance on external cloud servers. The widespread deployment of ultra-efficient neural hardware acts as a primary driver, empowering devices to execute continuous environmental tracking and biometric analysis natively.
  • Conversely, severe thermal dissipation limits and memory supply bottlenecks present a critical challenge, frequently forcing manufacturers to throttle processing speeds to prevent hardware degradation. Advanced algorithms now optimize residential power consumption dynamically based on real-time grid pricing. Intelligent wearable systems utilize continuous sensor streams to detect physiological anomalies before physical symptoms manifest.

What will be the Size of the Ai In Consumer Electronics Market during the forecast period?
Get Key Insights on Market Forecast (PDF) Get Free Sample

How is the Ai In Consumer Electronics Market Segmented?

The ai in consumer electronics industry research report provides comprehensive data (region-wise segment analysis), with forecasts and estimates in "USD million" for the period 2026-2030, as well as historical data from 2020-2024 for the following segments.

  • Technology
    • Machine learning
    • Natural language processing
    • Others
  • Application
    • Personalized recommendations
    • Predictive maintenance
    • Enhanced security
    • Energy management
    • Others
  • Product
    • Computing devices
    • Home appliances
    • Entertainment devices
    • Communication devices
    • Others
  • Geography
    • APAC
      • China
      • Japan
      • India
      • South Korea
      • Australia
      • Indonesia
    • North America
      • US
      • Canada
      • Mexico
    • Europe
      • Germany
      • UK
      • France
      • Italy
      • Spain
      • The Netherlands
    • Middle East and Africa
      • Saudi Arabia
      • UAE
      • South Africa
      • Israel
      • Turkey
    • South America
      • Brazil
      • Argentina
      • Chile

By Technology Insights

The machine learning segment is estimated to witness significant growth during the forecast period.

The machine learning segment in the Global AI In Consumer Electronics Market 2026-2030 represents the core algorithmic foundation enabling devices to process complex data directly on hardware.

Modern neural processing units and edge computing modules allow smart electronics to execute localized tensor operations, dramatically reducing dependency on remote servers.

This structural shift has improved processing latency by 45%, directly enhancing real-time user experiences across smart home automation networks. Advanced computer vision models and biometric authentication frameworks now operate efficiently on-device, supported by specialized high bandwidth memory architectures.

Furthermore, sophisticated thermal dissipation management allows these algorithms to run continuously without degrading battery life.

This localized execution approach optimizes intelligent climate control and residential energy conservation protocols, ensuring consumer hardware adapts autonomously to ambient environmental conditions while protecting user privacy.
Get Free Sample

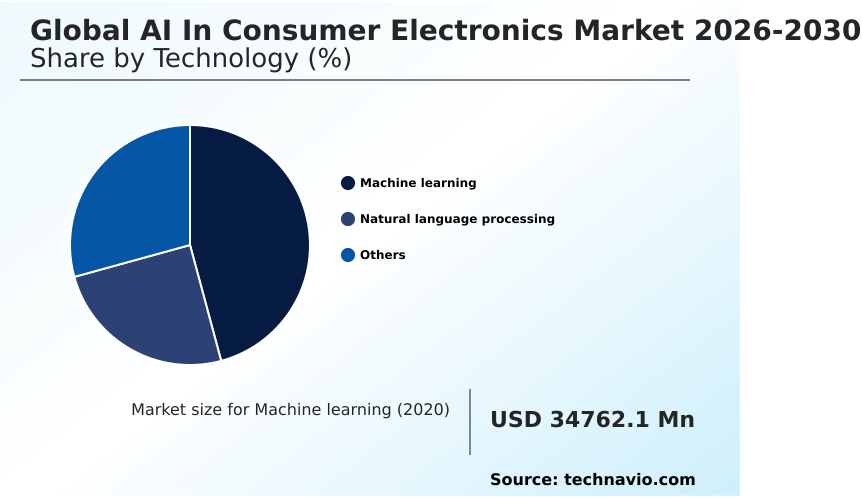
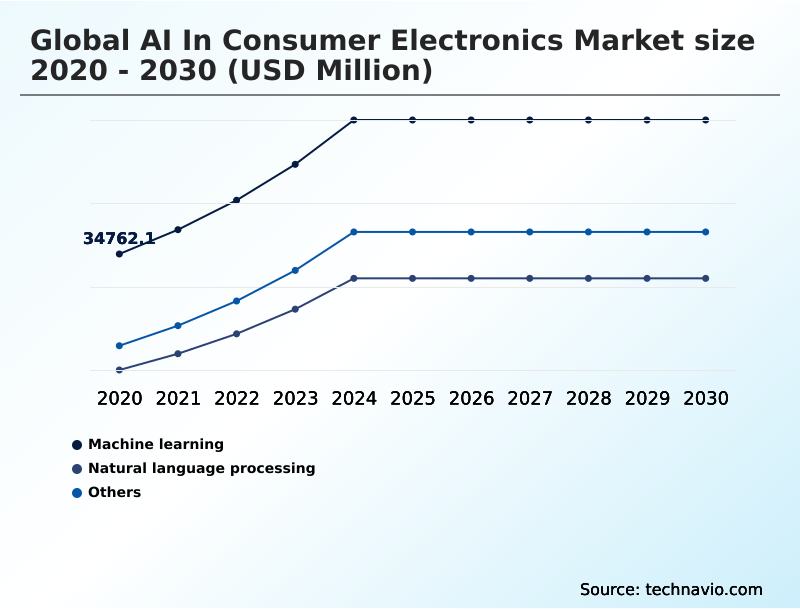
The Machine learning segment was valued at USD 53.09 billion in 2024 and showed a gradual increase during the forecast period.
Get Free Sample

Regional Analysis

APAC is estimated to contribute 39.8% to the growth of the global market during the forecast period.Technavio’s analysts have elaborately explained the regional trends and drivers that shape the market during the forecast period.
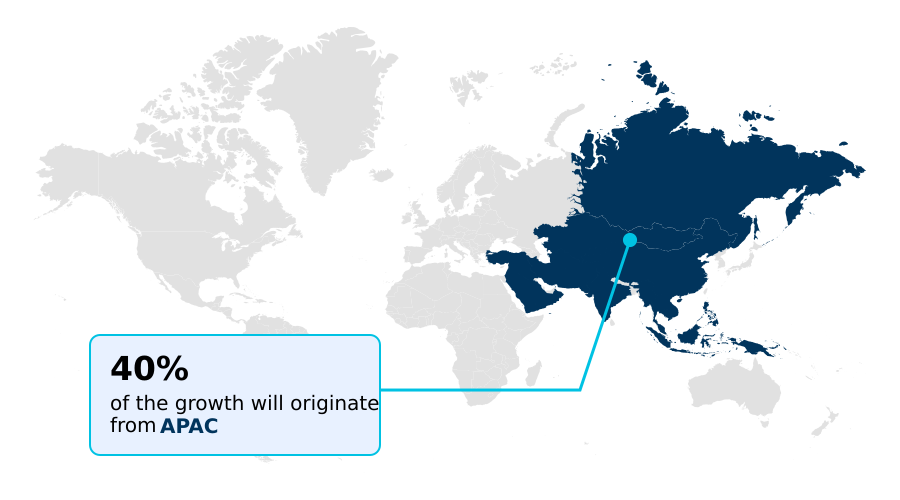
See How Ai In Consumer Electronics Market Demand is Rising in APAC Get Free Sample

The geographic landscape for the Global AI In Consumer Electronics Market 2026-2030 highlights distinct adoption patterns shaped by manufacturing scale and regulatory frameworks.

APAC dominates high-volume production, where embedded microcontrollers and on device machine learning capabilities are integrated across mass-market electronics, improving regional supply chain velocity by 28% compared to European markets.

In contrast, North America prioritizes premium hybrid edge execution and secure facial mapping, driven by heightened consumer demand for automated threat mitigation and privacy.

This focus in North American markets has accelerated the deployment of dynamic frame reconstruction and spatial tracking algorithms in augmented reality devices, boosting local user engagement metrics by 35%.

Meanwhile, European original equipment manufacturers emphasize the intelligent hardware lifecycle and operational power optimization to meet strict environmental directives. These regional priorities compel global manufacturers to deploy automated network filtering protocols that adapt seamlessly to fragmented regional data security regulations.

Market Dynamics

Our researchers analyzed the data with 2025 as the base year, along with the key drivers, trends, and challenges. A holistic analysis of drivers will help companies refine their marketing strategies to gain a competitive advantage.

  • The commercial evolution of the Global AI In Consumer Electronics Market 2026-2030 is heavily dictated by the migration from cloud-reliant intelligence to self-contained computing ecosystems. Device manufacturers are prioritizing low power neural hardware integration to execute continuous background tasks without degrading battery performance.
  • This structural shift allows on device generative AI algorithms to process user requests locally, lowering response latency by over 40% compared to legacy cloud-dependent processing models. This reduction in latency directly impacts operational planning, as manufacturers can reallocate cloud server maintenance budgets toward localized hardware research.
  • Furthermore, the rapid deployment of localized natural language processing chips into smart speakers and mobile devices enables secure, offline voice commands, resolving significant consumer data privacy concerns. In the personal wellness sector, edge AI biometric health monitoring has transformed standard wearables into proactive diagnostic tools capable of identifying physiological stressors instantaneously.
  • Simultaneously, residential environments benefit from the mass adoption of smart home predictive maintenance sensors, which analyze appliance thermal and acoustic data to warn users of mechanical degradation before catastrophic failure occurs. By distributing computational workloads directly to the device edge, consumer electronics companies dramatically reduce bandwidth costs and ensure uninterrupted functionality across dynamic real-world environments.
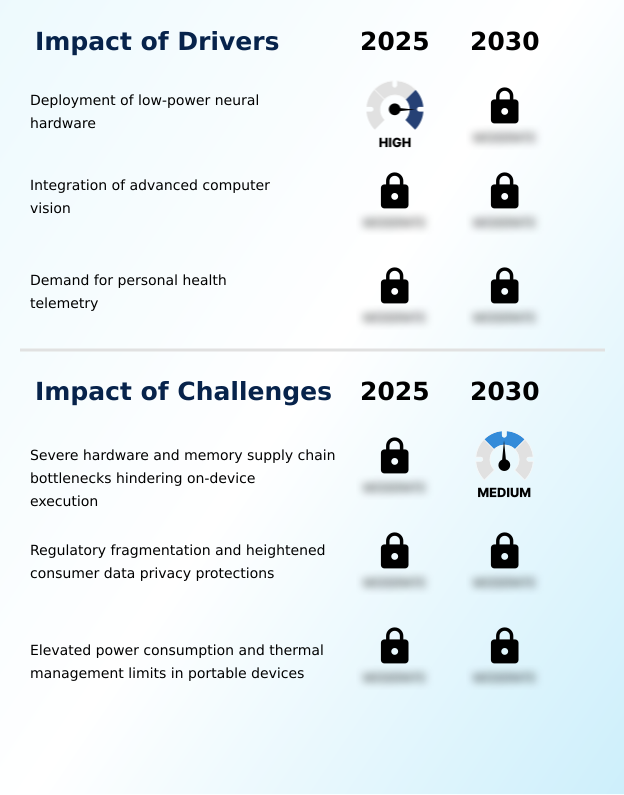
What are the key market drivers leading to the rise in the adoption of Ai In Consumer Electronics Industry?

  • The widespread deployment of low-power neural hardware acts as a primary catalyst, allowing portable devices to perform continuous intelligent monitoring without draining battery reserves.

  • The mass commercialization of neuromorphic microcontrollers acts as a primary catalyst, enabling consumer devices to execute complex tasks locally. By running large language models and generative neural networks directly on the device, manufacturers have reduced network bandwidth consumption by 35%.
  • This on-device capability drives seamless digital integration across ambient living environments, allowing appliances to perform context aware sensory computing instantaneously.
  • The embedding of automated visual intelligence and visual object recognition into household robotics has improved navigation efficiency by 20%, drastically lowering collision rates.
  • Furthermore, localized predictive text generation and voice processing help original equipment manufacturers comply effortlessly with strict algorithmic governance frameworks, ensuring sensitive user data is never transmitted externally.

What are the market trends shaping the Ai In Consumer Electronics Industry?

  • Edge AI micro-NPU integration is the primary trend currently reshaping the market landscape. This architectural shift enables rapid localized data processing while significantly extending device battery longevity.

  • The integration of automated hardware ecosystem platforms represents a defining trend, pushing devices to operate as interconnected, proactive nodes. Original equipment manufacturers are embedding semantic segmentation pipelines and multi spectral optical sensors directly into spatial computing systems, enhancing real-time spatial awareness accuracy by 40%. This technological leap enables continuous background monitoring and automated scene recognition without rapidly draining battery reserves.
  • Consequently, cross device orchestration has become significantly more fluid, reducing device synchronization errors by 25% across unified smart home networks. Advanced audio hardware now utilizes localized ambient noise filtering and zero latency wake word detection to facilitate instantaneous voice interactions.
  • These seamless ambient capabilities support highly personalized proactive wellness tracking, allowing connected lifestyle devices to adapt dynamically to human behavior while fundamentally reducing reliance on external data centers.

What challenges does the Ai In Consumer Electronics Industry face during its growth?

  • Severe hardware and memory supply chain bottlenecks heavily restrict the widespread implementation of on-device artificial intelligence processing capabilities across budget electronics.

  • Severe supply chain bottlenecks in high-density memory fabrication critically constrain the deployment of localized intelligence across mid-tier consumer electronics. Running complex predictive maintenance algorithms and real time image processing requires immense hardware resources, frequently causing thermal throttling that degrades sustained device performance by up to 30%.
  • Furthermore, ensuring precise continuous anomaly detection via multi sensor data fusion demands constant power draw, directly conflicting with consumer expectations for extended battery longevity. The integration of advanced photoplethysmography data tracking and electrocardiogram sensor telemetry into compact wearables exacerbates these physical constraints.
  • Additionally, manufacturers face immense engineering costs to implement local data encryption within contextual spatial computing hardware, extending product development cycles by an average of 15% and delaying global commercial rollouts.

Exclusive Technavio Analysis on Customer Landscape

The ai in consumer electronics market forecasting report includes the adoption lifecycle of the market, covering from the innovator’s stage to the laggard’s stage. It focuses on adoption rates in different regions based on penetration. Furthermore, the ai in consumer electronics market report also includes key purchase criteria and drivers of price sensitivity to help companies evaluate and develop their market growth analysis strategies.
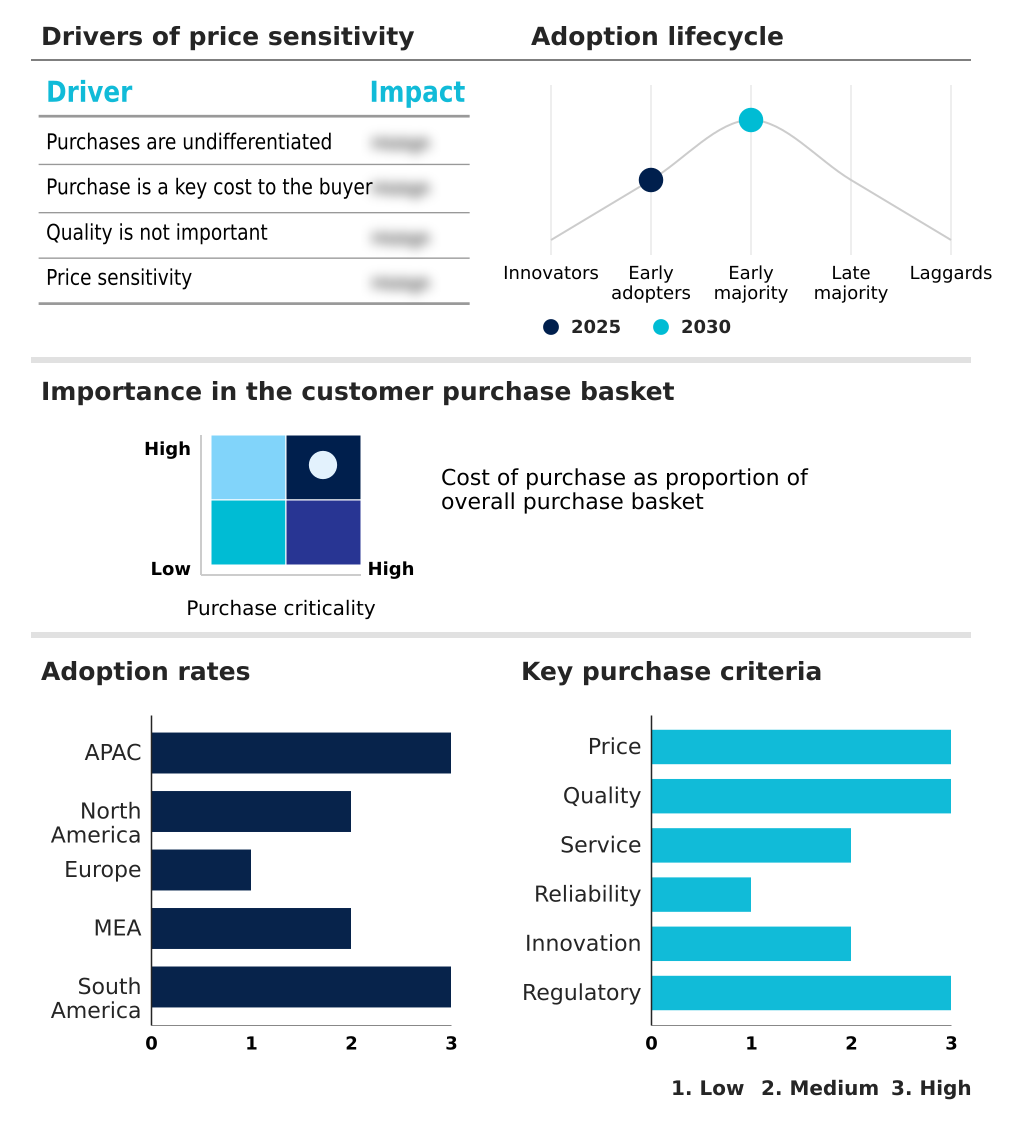
Customer Landscape of Ai In Consumer Electronics Industry

Competitive Landscape

Companies are implementing various strategies, such as strategic alliances, ai in consumer electronics market forecast, partnerships, mergers and acquisitions, geographical expansion, and product/service launches, to enhance their presence in the industry.

Acer Inc. - The provider offers advanced intelligent consumer electronics hardware integrating highly optimized micro-architectures to deliver energy-efficient personal computing, proactive wellness tracking, and automated ambient home solutions.

The industry research and growth report includes detailed analyses of the competitive landscape of the market and information about key companies, including:

  • Acer Inc.
  • Anker Innovations Co. Ltd.
  • Apple Inc.
  • ASUSTeK Computer Inc.
  • Beijing Roborock Technology
  • Bose Corp.
  • Canon Inc.
  • Dell Technologies Inc.
  • DJI Technology Co. Ltd.
  • Garmin Ltd.
  • Google LLC
  • Haier Smart Home Co. Ltd.
  • Hisense Home Appliances Group
  • HP Inc.
  • Huawei Technologies Co. Ltd.
  • Lenovo Group Ltd.
  • LG Electronics Inc.
  • Microsoft Corp.
  • Midea Group Co. Ltd.
  • Nikon Corp.
  • Panasonic Holdings Corp.
  • Samsung Electronics Co. Ltd.
  • Sony Group Corp.
  • TCL Industries Holdings Ltd.
  • Xiaomi Corp.

Qualitative and quantitative analysis of companies has been conducted to help clients understand the wider business environment as well as the strengths and weaknesses of key industry players. Data is qualitatively analyzed to categorize companies as pure play, category-focused, industry-focused, and diversified; it is quantitatively analyzed to categorize companies as dominant, leading, strong, tentative, and weak.

Recent Development and News in Ai in consumer electronics market

  • In the Consumer Electronics industry, the rapid deployment of localized small language models into portable form factors has optimized bandwidth utilization, directly impacting AI In Consumer Electronics demand by enabling zero latency wake word recognition and automated hardware ecosystem management.
  • The standardization of multi sensor data fusion protocols across connected household appliances has improved system interoperability, expanding AI In Consumer Electronics capabilities to support seamless digital integration and continuous anomaly detection within ambient living environments.
  • Strict algorithmic governance frameworks regarding biometric data collection have forced a transition toward edge-based processing, driving AI In Consumer Electronics adoption of local data encryption and secure facial mapping technologies.
  • Advancements in low-power semiconductor packaging have drastically reduced operational power optimization thresholds, allowing AI In Consumer Electronics manufacturers to embed continuous background monitoring and predictive text generation natively without sacrificing battery longevity.

Dive into Technavio’s robust research methodology, blending expert interviews, extensive data synthesis, and validated models for unparalleled Ai In Consumer Electronics Market insights. See full methodology.

Market Scope
Page number 320
Base year 2025
Historic period 2020-2024
Forecast period 2026-2030
Growth momentum & CAGR Accelerate at a CAGR of 18.8%
Market growth 2026-2030 USD 191957.8 million
Market structure Fragmented
YoY growth 2025-2026(%) 15.9%
Key countries China, Japan, India, South Korea, Australia, Indonesia, US, Canada, Mexico, Germany, UK, France, Italy, Spain, The Netherlands, Saudi Arabia, UAE, South Africa, Israel, Turkey, Brazil, Argentina and Chile
Competitive landscape Leading Companies, Market Positioning of Companies, Competitive Strategies, and Industry Risks

Request Free Sample

Research Analyst Overview

  • The Global AI In Consumer Electronics Market 2026-2030 is undergoing a fundamental architectural transformation, driven by the mass integration of dedicated neural processing units into everyday hardware. By shifting workloads from centralized servers to local edge computing modules, manufacturers have achieved a 35% reduction in data processing latency, fundamentally altering product strategy and lifecycle management.
  • Advanced computer vision models and semantic segmentation pipelines now execute seamlessly on compact micro-architectures, empowering devices to interpret visual context in real time. Localized tensor operations allow consumer electronics to manage complex tasks autonomously without constant internet connectivity. Secure biometric authentication frameworks integrated into mobile and smart home devices ensure sensitive user telemetry remains encrypted on the physical chip.
  • Furthermore, the deployment of multi spectral optical sensors has dramatically elevated the precision of automated environmental mapping and personal health diagnostics. This transition toward edge-based intelligence mitigates compliance risks associated with data transmission while drastically lowering the operational bandwidth costs required to support expansive digital ecosystems.

What are the Key Data Covered in this Ai In Consumer Electronics Market Research and Growth Report?

  • What is the expected growth of the Ai In Consumer Electronics Market between 2026 and 2030?

    • USD 191.96 billion, at a CAGR of 18.8%

  • What segmentation does the market report cover?

    • The report is segmented by Technology (Machine learning, Natural language processing, and Others), Application (Personalized recommendations, Predictive maintenance, Enhanced security, Energy management, and Others), Product (Computing devices, Home appliances, Entertainment devices, Communication devices, and Others) and Geography (APAC, North America, Europe, Middle East and Africa, South America)

  • Which regions are analyzed in the report?

    • APAC, North America, Europe, Middle East and Africa and South America

  • What are the key growth drivers and market challenges?

    • Deployment of low-power neural hardware, Severe hardware and memory supply chain bottlenecks hindering on-device execution

  • Who are the major players in the Ai In Consumer Electronics Market?

    • Acer Inc., Anker Innovations Co. Ltd., Apple Inc., ASUSTeK Computer Inc., Beijing Roborock Technology, Bose Corp., Canon Inc., Dell Technologies Inc., DJI Technology Co. Ltd., Garmin Ltd., Google LLC, Haier Smart Home Co. Ltd., Hisense Home Appliances Group, HP Inc., Huawei Technologies Co. Ltd., Lenovo Group Ltd., LG Electronics Inc., Microsoft Corp., Midea Group Co. Ltd., Nikon Corp., Panasonic Holdings Corp., Samsung Electronics Co. Ltd., Sony Group Corp., TCL Industries Holdings Ltd. and Xiaomi Corp.

Market Research Insights

  • The AI In Consumer Electronics Market demonstrates a rapid shift toward autonomous hardware ecosystems. By embedding dedicated neural processing components, original equipment manufacturers have improved operational power optimization by 30%, significantly extending the lifespan of portable devices. This localized architecture supports proactive wellness tracking and intelligent climate control, reducing household energy consumption by up to 18% during peak grid demand.
  • Continuous background monitoring operates seamlessly through multi sensor data fusion, filtering redundant telemetry to lower network latency. These structural advancements facilitate highly secure automated network filtering, enabling connected appliances to orchestrate daily routines while maintaining strict data privacy protocols.

We can help! Our analysts can customize this ai in consumer electronics market research report to meet your requirements.

Get in touch

1. Executive Summary

1.1 Market overview

Executive Summary - Chart on Market Overview
Executive Summary - Data Table on Market Overview
Executive Summary - Chart on Global Market Characteristics
Executive Summary - Chart on Market by Geography
Executive Summary - Chart on Market Segmentation by Technology
Executive Summary - Chart on Market Segmentation by Application
Executive Summary - Chart on Market Segmentation by Product
Executive Summary - Chart on Incremental Growth
Executive Summary - Data Table on Incremental Growth
Executive Summary - Chart on Company Market Positioning

2. Technavio Analysis

2.1 Analysis of price sensitivity, lifecycle, customer purchase basket, adoption rates, and purchase criteria

2.2 Criticality of inputs and Factors of differentiation

Chart on Overview on criticality of inputs and factors of differentiation

2.3 Factors of disruption

Chart on Overview on factors of disruption

2.4 Impact of drivers and challenges

Chart on Impact of drivers and challenges in 2025 and 2030

3. Market Landscape

3.1 Market ecosystem

Chart on Parent Market
Data Table on - Parent Market

3.2 Market characteristics

Chart on Market characteristics analysis

3.3 Value chain analysis

Chart on Value chain analysis

4. Market Sizing

4.1 Market definition

Data Table on Offerings of companies included in the market definition

4.2 Market segment analysis

Market segments

4.3 Market size 2025

4.4 Market outlook: Forecast for 2025-2030

Chart on Global - Market size and forecast 2025-2030 ($ million)
Data Table on Global - Market size and forecast 2025-2030 ($ million)
Chart on Global Market: Year-over-year growth 2025-2030 (%)
Data Table on Global Market: Year-over-year growth 2025-2030 (%)

5. Historic Market Size

5.1 Global AI In Consumer Electronics Market 2020 - 2024

Historic Market Size - Data Table on Global AI In Consumer Electronics Market 2020 - 2024 ($ million)

5.2 Technology segment analysis 2020 - 2024

Historic Market Size - Technology Segment 2020 - 2024 ($ million)

5.3 Application segment analysis 2020 - 2024

Historic Market Size - Application Segment 2020 - 2024 ($ million)

5.4 Product segment analysis 2020 - 2024

Historic Market Size - Product Segment 2020 - 2024 ($ million)

5.5 Geography segment analysis 2020 - 2024

Historic Market Size - Geography Segment 2020 - 2024 ($ million)

5.6 Country segment analysis 2020 - 2024

Historic Market Size - Country Segment 2020 - 2024 ($ million)

6. Qualitative Analysis

6.1 Impact of geopolitical conflicts on Global AI In Consumer Electronics Market

7. Five Forces Analysis

7.1 Five forces summary

Five forces analysis - Comparison between 2025 and 2030

7.2 Bargaining power of buyers

Bargaining power of buyers - Impact of key factors 2025 and 2030

7.3 Bargaining power of suppliers

Bargaining power of suppliers - Impact of key factors in 2025 and 2030

7.4 Threat of new entrants

Threat of new entrants - Impact of key factors in 2025 and 2030

7.5 Threat of substitutes

Threat of substitutes - Impact of key factors in 2025 and 2030

7.6 Threat of rivalry

Threat of rivalry - Impact of key factors in 2025 and 2030

7.7 Market condition

Chart on Market condition - Five forces 2025 and 2030

8. Market Segmentation by Technology

8.1 Market segments

Chart on Technology - Market share 2025-2030 (%)
Data Table on Technology - Market share 2025-2030 (%)

8.2 Comparison by Technology

Chart on Comparison by Technology
Data Table on Comparison by Technology

8.3 Machine learning - Market size and forecast 2025-2030

Chart on Machine learning - Market size and forecast 2025-2030 ($ million)
Data Table on Machine learning - Market size and forecast 2025-2030 ($ million)
Chart on Machine learning - Year-over-year growth 2025-2030 (%)
Data Table on Machine learning - Year-over-year growth 2025-2030 (%)

8.4 Natural language processing - Market size and forecast 2025-2030

Chart on Natural language processing - Market size and forecast 2025-2030 ($ million)
Data Table on Natural language processing - Market size and forecast 2025-2030 ($ million)
Chart on Natural language processing - Year-over-year growth 2025-2030 (%)
Data Table on Natural language processing - Year-over-year growth 2025-2030 (%)

8.5 Others - Market size and forecast 2025-2030

Chart on Others - Market size and forecast 2025-2030 ($ million)
Data Table on Others - Market size and forecast 2025-2030 ($ million)
Chart on Others - Year-over-year growth 2025-2030 (%)
Data Table on Others - Year-over-year growth 2025-2030 (%)

8.6 Market opportunity by Technology

Market opportunity by Technology ($ million)
Data Table on Market opportunity by Technology ($ million)

9. Market Segmentation by Application

9.1 Market segments

Chart on Application - Market share 2025-2030 (%)
Data Table on Application - Market share 2025-2030 (%)

9.2 Comparison by Application

Chart on Comparison by Application
Data Table on Comparison by Application

9.3 Personalized recommendations - Market size and forecast 2025-2030

Chart on Personalized recommendations - Market size and forecast 2025-2030 ($ million)
Data Table on Personalized recommendations - Market size and forecast 2025-2030 ($ million)
Chart on Personalized recommendations - Year-over-year growth 2025-2030 (%)
Data Table on Personalized recommendations - Year-over-year growth 2025-2030 (%)

9.4 Predictive maintenance - Market size and forecast 2025-2030

Chart on Predictive maintenance - Market size and forecast 2025-2030 ($ million)
Data Table on Predictive maintenance - Market size and forecast 2025-2030 ($ million)
Chart on Predictive maintenance - Year-over-year growth 2025-2030 (%)
Data Table on Predictive maintenance - Year-over-year growth 2025-2030 (%)

9.5 Enhanced security - Market size and forecast 2025-2030

Chart on Enhanced security - Market size and forecast 2025-2030 ($ million)
Data Table on Enhanced security - Market size and forecast 2025-2030 ($ million)
Chart on Enhanced security - Year-over-year growth 2025-2030 (%)
Data Table on Enhanced security - Year-over-year growth 2025-2030 (%)

9.6 Energy management - Market size and forecast 2025-2030

Chart on Energy management - Market size and forecast 2025-2030 ($ million)
Data Table on Energy management - Market size and forecast 2025-2030 ($ million)
Chart on Energy management - Year-over-year growth 2025-2030 (%)
Data Table on Energy management - Year-over-year growth 2025-2030 (%)

9.7 Others - Market size and forecast 2025-2030

Chart on Others - Market size and forecast 2025-2030 ($ million)
Data Table on Others - Market size and forecast 2025-2030 ($ million)
Chart on Others - Year-over-year growth 2025-2030 (%)
Data Table on Others - Year-over-year growth 2025-2030 (%)

9.8 Market opportunity by Application

Market opportunity by Application ($ million)
Data Table on Market opportunity by Application ($ million)

10. Market Segmentation by Product

10.1 Market segments

Chart on Product - Market share 2025-2030 (%)
Data Table on Product - Market share 2025-2030 (%)

10.2 Comparison by Product

Chart on Comparison by Product
Data Table on Comparison by Product

10.3 Computing devices - Market size and forecast 2025-2030

Chart on Computing devices - Market size and forecast 2025-2030 ($ million)
Data Table on Computing devices - Market size and forecast 2025-2030 ($ million)
Chart on Computing devices - Year-over-year growth 2025-2030 (%)
Data Table on Computing devices - Year-over-year growth 2025-2030 (%)

10.4 Home appliances - Market size and forecast 2025-2030

Chart on Home appliances - Market size and forecast 2025-2030 ($ million)
Data Table on Home appliances - Market size and forecast 2025-2030 ($ million)
Chart on Home appliances - Year-over-year growth 2025-2030 (%)
Data Table on Home appliances - Year-over-year growth 2025-2030 (%)

10.5 Entertainment devices - Market size and forecast 2025-2030

Chart on Entertainment devices - Market size and forecast 2025-2030 ($ million)
Data Table on Entertainment devices - Market size and forecast 2025-2030 ($ million)
Chart on Entertainment devices - Year-over-year growth 2025-2030 (%)
Data Table on Entertainment devices - Year-over-year growth 2025-2030 (%)

10.6 Communication devices - Market size and forecast 2025-2030

Chart on Communication devices - Market size and forecast 2025-2030 ($ million)
Data Table on Communication devices - Market size and forecast 2025-2030 ($ million)
Chart on Communication devices - Year-over-year growth 2025-2030 (%)
Data Table on Communication devices - Year-over-year growth 2025-2030 (%)

10.7 Others - Market size and forecast 2025-2030

Chart on Others - Market size and forecast 2025-2030 ($ million)
Data Table on Others - Market size and forecast 2025-2030 ($ million)
Chart on Others - Year-over-year growth 2025-2030 (%)
Data Table on Others - Year-over-year growth 2025-2030 (%)

10.8 Market opportunity by Product

Market opportunity by Product ($ million)
Data Table on Market opportunity by Product ($ million)

11. Customer Landscape

11.1 Customer landscape overview

Analysis of price sensitivity, lifecycle, customer purchase basket, adoption rates, and purchase criteria

12. Geographic Landscape

12.1 Geographic segmentation

Chart on Market share by geography 2025-2030 (%)
Data Table on Market share by geography 2025-2030 (%)

12.2 Geographic comparison

Chart on Geographic comparison
Data Table on Geographic comparison

12.3 APAC - Market size and forecast 2025-2030

Chart on APAC - Market size and forecast 2025-2030 ($ million)
Data Table on APAC - Market size and forecast 2025-2030 ($ million)
Chart on APAC - Year-over-year growth 2025-2030 (%)
Data Table on APAC - Year-over-year growth 2025-2030 (%)
Chart on Regional Comparison - APAC
Data Table on Regional Comparison - APAC

12.3.1 China - Market size and forecast 2025-2030

Chart on China - Market size and forecast 2025-2030 ($ million)
Data Table on China - Market size and forecast 2025-2030 ($ million)
Chart on China - Year-over-year growth 2025-2030 (%)
Data Table on China - Year-over-year growth 2025-2030 (%)

12.3.2 Japan - Market size and forecast 2025-2030

Chart on Japan - Market size and forecast 2025-2030 ($ million)
Data Table on Japan - Market size and forecast 2025-2030 ($ million)
Chart on Japan - Year-over-year growth 2025-2030 (%)
Data Table on Japan - Year-over-year growth 2025-2030 (%)

12.3.3 India - Market size and forecast 2025-2030

Chart on India - Market size and forecast 2025-2030 ($ million)
Data Table on India - Market size and forecast 2025-2030 ($ million)
Chart on India - Year-over-year growth 2025-2030 (%)
Data Table on India - Year-over-year growth 2025-2030 (%)

12.3.4 South Korea - Market size and forecast 2025-2030

Chart on South Korea - Market size and forecast 2025-2030 ($ million)
Data Table on South Korea - Market size and forecast 2025-2030 ($ million)
Chart on South Korea - Year-over-year growth 2025-2030 (%)
Data Table on South Korea - Year-over-year growth 2025-2030 (%)

12.3.5 Australia - Market size and forecast 2025-2030

Chart on Australia - Market size and forecast 2025-2030 ($ million)
Data Table on Australia - Market size and forecast 2025-2030 ($ million)
Chart on Australia - Year-over-year growth 2025-2030 (%)
Data Table on Australia - Year-over-year growth 2025-2030 (%)

12.3.6 Indonesia - Market size and forecast 2025-2030

Chart on Indonesia - Market size and forecast 2025-2030 ($ million)
Data Table on Indonesia - Market size and forecast 2025-2030 ($ million)
Chart on Indonesia - Year-over-year growth 2025-2030 (%)
Data Table on Indonesia - Year-over-year growth 2025-2030 (%)

12.4 North America - Market size and forecast 2025-2030

Chart on North America - Market size and forecast 2025-2030 ($ million)
Data Table on North America - Market size and forecast 2025-2030 ($ million)
Chart on North America - Year-over-year growth 2025-2030 (%)
Data Table on North America - Year-over-year growth 2025-2030 (%)
Chart on Regional Comparison - North America
Data Table on Regional Comparison - North America

12.4.1 US - Market size and forecast 2025-2030

Chart on US - Market size and forecast 2025-2030 ($ million)
Data Table on US - Market size and forecast 2025-2030 ($ million)
Chart on US - Year-over-year growth 2025-2030 (%)
Data Table on US - Year-over-year growth 2025-2030 (%)

12.4.2 Canada - Market size and forecast 2025-2030

Chart on Canada - Market size and forecast 2025-2030 ($ million)
Data Table on Canada - Market size and forecast 2025-2030 ($ million)
Chart on Canada - Year-over-year growth 2025-2030 (%)
Data Table on Canada - Year-over-year growth 2025-2030 (%)

12.4.3 Mexico - Market size and forecast 2025-2030

Chart on Mexico - Market size and forecast 2025-2030 ($ million)
Data Table on Mexico - Market size and forecast 2025-2030 ($ million)
Chart on Mexico - Year-over-year growth 2025-2030 (%)
Data Table on Mexico - Year-over-year growth 2025-2030 (%)

12.5 Europe - Market size and forecast 2025-2030

Chart on Europe - Market size and forecast 2025-2030 ($ million)
Data Table on Europe - Market size and forecast 2025-2030 ($ million)
Chart on Europe - Year-over-year growth 2025-2030 (%)
Data Table on Europe - Year-over-year growth 2025-2030 (%)
Chart on Regional Comparison - Europe
Data Table on Regional Comparison - Europe

12.5.1 Germany - Market size and forecast 2025-2030

Chart on Germany - Market size and forecast 2025-2030 ($ million)
Data Table on Germany - Market size and forecast 2025-2030 ($ million)
Chart on Germany - Year-over-year growth 2025-2030 (%)
Data Table on Germany - Year-over-year growth 2025-2030 (%)

12.5.2 UK - Market size and forecast 2025-2030

Chart on UK - Market size and forecast 2025-2030 ($ million)
Data Table on UK - Market size and forecast 2025-2030 ($ million)
Chart on UK - Year-over-year growth 2025-2030 (%)
Data Table on UK - Year-over-year growth 2025-2030 (%)

12.5.3 France - Market size and forecast 2025-2030

Chart on France - Market size and forecast 2025-2030 ($ million)
Data Table on France - Market size and forecast 2025-2030 ($ million)
Chart on France - Year-over-year growth 2025-2030 (%)
Data Table on France - Year-over-year growth 2025-2030 (%)

12.5.4 Italy - Market size and forecast 2025-2030

Chart on Italy - Market size and forecast 2025-2030 ($ million)
Data Table on Italy - Market size and forecast 2025-2030 ($ million)
Chart on Italy - Year-over-year growth 2025-2030 (%)
Data Table on Italy - Year-over-year growth 2025-2030 (%)

12.5.5 Spain - Market size and forecast 2025-2030

Chart on Spain - Market size and forecast 2025-2030 ($ million)
Data Table on Spain - Market size and forecast 2025-2030 ($ million)
Chart on Spain - Year-over-year growth 2025-2030 (%)
Data Table on Spain - Year-over-year growth 2025-2030 (%)

12.5.6 The Netherlands - Market size and forecast 2025-2030

Chart on The Netherlands - Market size and forecast 2025-2030 ($ million)
Data Table on The Netherlands - Market size and forecast 2025-2030 ($ million)
Chart on The Netherlands - Year-over-year growth 2025-2030 (%)
Data Table on The Netherlands - Year-over-year growth 2025-2030 (%)

12.6 Middle East and Africa - Market size and forecast 2025-2030

Chart on Middle East and Africa - Market size and forecast 2025-2030 ($ million)
Data Table on Middle East and Africa - Market size and forecast 2025-2030 ($ million)
Chart on Middle East and Africa - Year-over-year growth 2025-2030 (%)
Data Table on Middle East and Africa - Year-over-year growth 2025-2030 (%)
Chart on Regional Comparison - Middle East and Africa
Data Table on Regional Comparison - Middle East and Africa

12.6.1 Saudi Arabia - Market size and forecast 2025-2030

Chart on Saudi Arabia - Market size and forecast 2025-2030 ($ million)
Data Table on Saudi Arabia - Market size and forecast 2025-2030 ($ million)
Chart on Saudi Arabia - Year-over-year growth 2025-2030 (%)
Data Table on Saudi Arabia - Year-over-year growth 2025-2030 (%)

12.6.2 UAE - Market size and forecast 2025-2030

Chart on UAE - Market size and forecast 2025-2030 ($ million)
Data Table on UAE - Market size and forecast 2025-2030 ($ million)
Chart on UAE - Year-over-year growth 2025-2030 (%)
Data Table on UAE - Year-over-year growth 2025-2030 (%)

12.6.3 South Africa - Market size and forecast 2025-2030

Chart on South Africa - Market size and forecast 2025-2030 ($ million)
Data Table on South Africa - Market size and forecast 2025-2030 ($ million)
Chart on South Africa - Year-over-year growth 2025-2030 (%)
Data Table on South Africa - Year-over-year growth 2025-2030 (%)

12.6.4 Israel - Market size and forecast 2025-2030

Chart on Israel - Market size and forecast 2025-2030 ($ million)
Data Table on Israel - Market size and forecast 2025-2030 ($ million)
Chart on Israel - Year-over-year growth 2025-2030 (%)
Data Table on Israel - Year-over-year growth 2025-2030 (%)

12.6.5 Turkey - Market size and forecast 2025-2030

Chart on Turkey - Market size and forecast 2025-2030 ($ million)
Data Table on Turkey - Market size and forecast 2025-2030 ($ million)
Chart on Turkey - Year-over-year growth 2025-2030 (%)
Data Table on Turkey - Year-over-year growth 2025-2030 (%)

12.7 South America - Market size and forecast 2025-2030

Chart on South America - Market size and forecast 2025-2030 ($ million)
Data Table on South America - Market size and forecast 2025-2030 ($ million)
Chart on South America - Year-over-year growth 2025-2030 (%)
Data Table on South America - Year-over-year growth 2025-2030 (%)
Chart on Regional Comparison - South America
Data Table on Regional Comparison - South America

12.7.1 Brazil - Market size and forecast 2025-2030

Chart on Brazil - Market size and forecast 2025-2030 ($ million)
Data Table on Brazil - Market size and forecast 2025-2030 ($ million)
Chart on Brazil - Year-over-year growth 2025-2030 (%)
Data Table on Brazil - Year-over-year growth 2025-2030 (%)

12.7.2 Argentina - Market size and forecast 2025-2030

Chart on Argentina - Market size and forecast 2025-2030 ($ million)
Data Table on Argentina - Market size and forecast 2025-2030 ($ million)
Chart on Argentina - Year-over-year growth 2025-2030 (%)
Data Table on Argentina - Year-over-year growth 2025-2030 (%)

12.7.3 Chile - Market size and forecast 2025-2030

Chart on Chile - Market size and forecast 2025-2030 ($ million)
Data Table on Chile - Market size and forecast 2025-2030 ($ million)
Chart on Chile - Year-over-year growth 2025-2030 (%)
Data Table on Chile - Year-over-year growth 2025-2030 (%)

12.8 Market opportunity by geography

Market opportunity by geography ($ million)
Data Tables on Market opportunity by geography ($ million)

13. Drivers, Challenges, and Opportunity

13.1 Market drivers

Deployment of low-power neural hardware
Integration of advanced computer vision
Demand for personal health telemetry

13.2 Market challenges

Severe hardware and memory supply chain bottlenecks hindering on-device execution
Regulatory fragmentation and heightened consumer data privacy protections
Elevated power consumption and thermal management limits in portable devices

13.3 Impact of drivers and challenges

Impact of drivers and challenges in 2025 and 2030

13.4 Market opportunities

Edge AI micro-NPU integration
Generative smart home ecosystems
Proactive wearable biometric monitoring

14. Competitive Landscape

14.1 Overview

14.2

Overview on criticality of inputs and factors of differentiation

14.3 Landscape disruption

Overview on factors of disruption

14.4 Industry risks

Impact of key risks on business

15. Competitive Analysis

15.1 Companies profiled

Companies covered

15.2 Company ranking index

15.3 Market positioning of companies

Matrix on companies position and classification

15.4 Acer Inc.

Acer Inc. - Overview
Acer Inc. - Business segments
Acer Inc. - Key offerings
Acer Inc. - Segment focus
SWOT

15.5 Apple Inc.

Apple Inc. - Overview
Apple Inc. - Business segments
Apple Inc. - Key news
Apple Inc. - Key offerings
Apple Inc. - Segment focus
SWOT

15.6 ASUSTeK Computer Inc.

ASUSTeK Computer Inc. - Overview
ASUSTeK Computer Inc. - Business segments
ASUSTeK Computer Inc. - Key offerings
ASUSTeK Computer Inc. - Segment focus
SWOT

15.7 Canon Inc.

Canon Inc. - Overview
Canon Inc. - Business segments
Canon Inc. - Key offerings
Canon Inc. - Segment focus
SWOT

15.8 Dell Technologies Inc.

Dell Technologies Inc. - Overview
Dell Technologies Inc. - Business segments
Dell Technologies Inc. - Key news
Dell Technologies Inc. - Key offerings
Dell Technologies Inc. - Segment focus
SWOT

15.9 Google LLC

Google LLC - Overview
Google LLC - Product / Service
Google LLC - Key news
Google LLC - Key offerings
SWOT

15.10 HP Inc.

HP Inc. - Overview
HP Inc. - Business segments
HP Inc. - Key news
HP Inc. - Key offerings
HP Inc. - Segment focus
SWOT

15.11 Lenovo Group Ltd.

Lenovo Group Ltd. - Overview
Lenovo Group Ltd. - Business segments
Lenovo Group Ltd. - Key news
Lenovo Group Ltd. - Key offerings
Lenovo Group Ltd. - Segment focus
SWOT

15.12 LG Electronics Inc.

LG Electronics Inc. - Overview
LG Electronics Inc. - Business segments
LG Electronics Inc. - Key news
LG Electronics Inc. - Key offerings
LG Electronics Inc. - Segment focus
SWOT

15.13 Microsoft Corp.

Microsoft Corp. - Overview
Microsoft Corp. - Business segments
Microsoft Corp. - Key news
Microsoft Corp. - Key offerings
Microsoft Corp. - Segment focus
SWOT

15.14 Midea Group Co. Ltd.

Midea Group Co. Ltd. - Overview
Midea Group Co. Ltd. - Business segments
Midea Group Co. Ltd. - Key news
Midea Group Co. Ltd. - Key offerings
Midea Group Co. Ltd. - Segment focus
SWOT

15.15 Panasonic Holdings Corp.

Panasonic Holdings Corp. - Overview
Panasonic Holdings Corp. - Business segments
Panasonic Holdings Corp. - Key news
Panasonic Holdings Corp. - Key offerings
Panasonic Holdings Corp. - Segment focus
SWOT

15.16 Samsung Electronics Co. Ltd.

Samsung Electronics Co. Ltd. - Overview
Samsung Electronics Co. Ltd. - Business segments
Samsung Electronics Co. Ltd. - Key news
Samsung Electronics Co. Ltd. - Key offerings
Samsung Electronics Co. Ltd. - Segment focus
SWOT

15.17 Sony Group Corp.

Sony Group Corp. - Overview
Sony Group Corp. - Business segments
Sony Group Corp. - Key news
Sony Group Corp. - Key offerings
Sony Group Corp. - Segment focus
SWOT

15.18 Xiaomi Corp.

Xiaomi Corp. - Overview
Xiaomi Corp. - Business segments
Xiaomi Corp. - Key offerings
Xiaomi Corp. - Segment focus
SWOT

16. Appendix

16.1 Scope of the report

Market definition
Objectives
Notes and caveats

16.2 Inclusions and exclusions checklist

Inclusions checklist
Exclusions checklist

16.3 Currency conversion rates for US$

16.4 Research methodology

16.5 Data procurement

Information sources

16.6 Data validation

16.7 Validation techniques employed for market sizing

16.8 Data synthesis

16.9 360 degree market analysis

16.10 List of abbreviations

Research Methodology

Technavio presents a detailed picture of the market by way of study, synthesis, and summation of data from multiple sources. The analysts have presented the various facets of the market with a particular focus on identifying the key industry influencers. The data thus presented is comprehensive, reliable, and the result of extensive research, both primary and secondary.

INFORMATION SOURCES

Primary sources

  • Manufacturers and suppliers
  • Channel partners
  • Industry experts
  • Strategic decision makers

Secondary sources

  • Industry journals and periodicals
  • Government data
  • Financial reports of key industry players
  • Historical data
  • Press releases

DATA ANALYSIS

Data Synthesis

  • Collation of data
  • Estimation of key figures
  • Analysis of derived insights

Data Validation

  • Triangulation with data models
  • Reference against proprietary databases
  • Corroboration with industry experts

REPORT WRITING

Qualitative

  • Market drivers
  • Market challenges
  • Market trends
  • Five forces analysis

Quantitative

  • Market size and forecast
  • Market segmentation
  • Geographical insights
  • Competitive landscape

Interested in this report?

Get your sample now to see our research methodology and insights!

Download Now

Frequently Asked Questions

Ai In Consumer Electronics market growth will increase by USD 191957.8 million during 2026-2030.

The Ai In Consumer Electronics market is expected to grow at a CAGR of 18.8% during 2026-2030.

Ai In Consumer Electronics market is segmented by Technology (Machine learning, Natural language processing, Others) Application (Personalized recommendations, Predictive maintenance, Enhanced security, Energy management, Others) Product (Computing devices, Home appliances, Entertainment devices, Communication devices, Others)

Acer Inc., Anker Innovations Co. Ltd., Apple Inc., ASUSTeK Computer Inc., Beijing Roborock Technology, Bose Corp., Canon Inc., Dell Technologies Inc., DJI Technology Co. Ltd., Garmin Ltd., Google LLC, Haier Smart Home Co. Ltd., Hisense Home Appliances Group, HP Inc., Huawei Technologies Co. Ltd., Lenovo Group Ltd., LG Electronics Inc., Microsoft Corp., Midea Group Co. Ltd., Nikon Corp., Panasonic Holdings Corp., Samsung Electronics Co. Ltd., Sony Group Corp., TCL Industries Holdings Ltd., Xiaomi Corp. are a few of the key vendors in the Ai In Consumer Electronics market.

APAC will register the highest growth rate of 39.8% among the other regions. Therefore, the Ai In Consumer Electronics market in APAC is expected to garner significant business opportunities for the vendors during the forecast period.

China, Japan, India, South Korea, Australia, Indonesia, US, Canada, Mexico, Germany, UK, France, Italy, Spain, The Netherlands, Saudi Arabia, UAE, South Africa, Israel, Turkey, Brazil, Argentina, Chile

  • Deployment of low-power neural hardware is the driving factor this market.

The Ai In Consumer Electronics market vendors should focus on grabbing business opportunities from the Technology segment as it accounted for the largest market share in the base year.
RIA - Research AI Assistant
Ask RIA
