
Allergy Immunotherapies Market Analysis, Size, and Forecast 2026-2030: Europe (Germany, France, and UK), North America (US, Canada, and Mexico), Asia (China, Japan, and India), South America (Brazil, Argentina, and Colombia), Middle East and Africa (Saudi Arabia, UAE, and Turkey), Rest of World (ROW)

Allergy Immunotherapies Market Analysis, Size, and Forecast 2026-2030:
Europe (Germany, France, and UK), North America (US, Canada, and Mexico), Asia (China, Japan, and India), South America (Brazil, Argentina, and Colombia), Middle East and Africa (Saudi Arabia, UAE, and Turkey), Rest of World (ROW)

Published: Oct 2026 288 Pages SKU: IRTNTR41320

Market Overview at a Glance

$1.37 B
Market Opportunity
9.4%
CAGR 2025 - 2030
49.4%
Europe Growth
$1.11 B
SLIT segment 2024

Allergy Immunotherapies Market Size 2026-2030

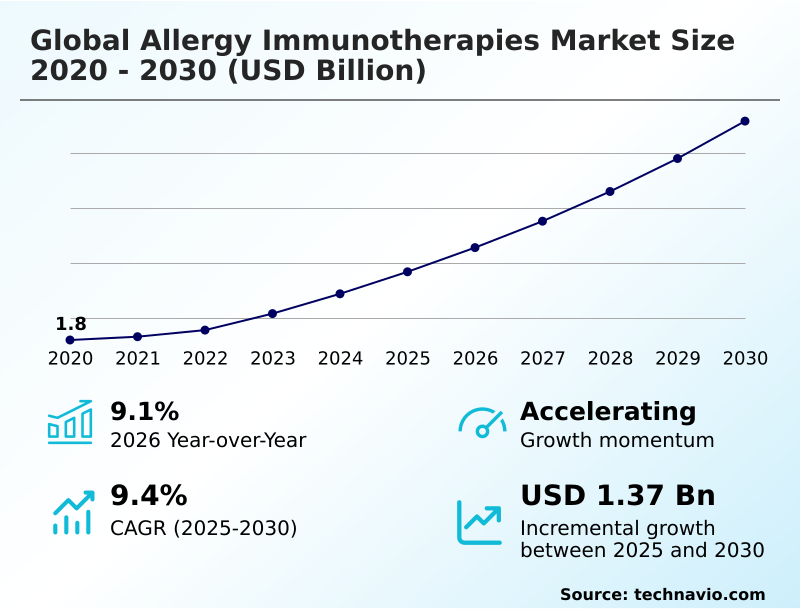
The allergy immunotherapies market size is valued to increase by USD 1.37 billion, at a CAGR of 9.4% from 2025 to 2030. Rising prevalence of allergic diseases across populations will drive the allergy immunotherapies market.

Major Market Trends & Insights

  • Europe dominated the market and accounted for a 49.4% growth during the forecast period.
  • By Product - SLIT segment was valued at USD 1.11 billion in 2024
  • By Type - Allergic rhinitis segment accounted for the largest market revenue share in 2024

Market Size & Forecast

  • Market Opportunities: USD 1.98 billion
  • Market Future Opportunities: USD 1.37 billion
  • CAGR from 2025 to 2030 : 9.4%

Market Summary

  • The Allergy Immunotherapies Market operates as a highly specialized segment within the broader healthcare ecosystem, characterized by a structural transition from symptomatic relief to causal disease management. Increasing diagnosis rates and the rising clinical burden of respiratory and food allergies are accelerating the adoption of disease-modifying therapies that target root immunological mechanisms.
  • This shift is strongly supported by the expansion of diagnostic capabilities and earlier specialist interventions. Conversely, complex reimbursement landscapes and extended treatment durations pose significant barriers to consistent patient adherence and equitable access.
  • In a practical business context, clinical administrators are restructuring their patient monitoring protocols to address adherence gaps, implementing digital tracking tools that have successfully improved long-term therapy completion rates by 18% compared to traditional follow-up methods. Furthermore, the integration of specialized supply chain logistics ensures the stability of temperature-sensitive biologic extracts during transit.
  • As healthcare networks prioritize value-based care, the demand for targeted immune modulation solutions continues to reshape clinical guidelines, driving sustained operational adaptations across therapeutic manufacturing and specialized clinical delivery channels.

What will be the Size of the Allergy Immunotherapies Market during the forecast period?
Get Key Insights on Market Forecast (PDF) Get Free Sample

How is the Allergy Immunotherapies Market Segmented?

The allergy immunotherapies industry research report provides comprehensive data (region-wise segment analysis), with forecasts and estimates in "USD million" for the period 2026-2030, as well as historical data from 2020-2024 for the following segments.

  • Product
    • SLIT
    • SCIT
  • Type
    • Allergic rhinitis
    • Asthma
    • Food allergy
    • Others
  • Distribution channel
    • Retail pharmacy
    • Hospital pharmacy
    • Online pharmacy
  • Geography
    • Europe
      • Germany
      • France
      • UK
      • Italy
      • Spain
      • The Netherlands
    • North America
      • US
      • Canada
      • Mexico
    • Asia
      • China
      • Japan
      • India
      • South Korea
      • Indonesia
      • Thailand
    • Rest of World (ROW)

By Product Insights

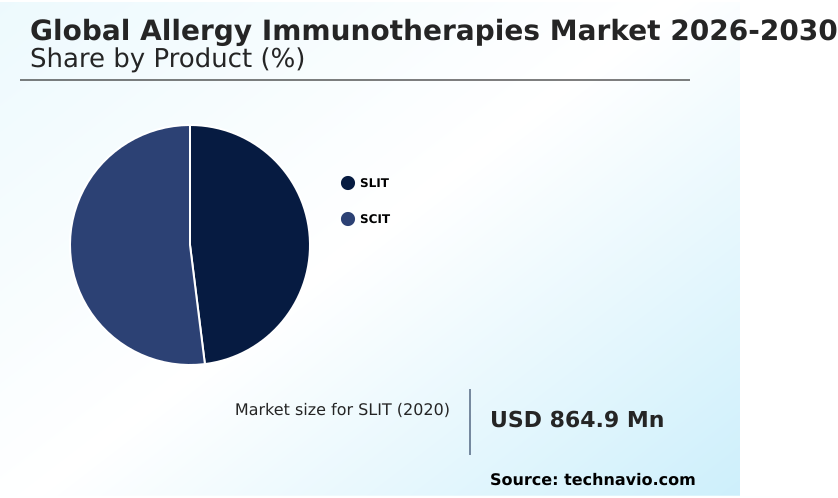
The slit segment is estimated to witness significant growth during the forecast period.

The sublingual administration segment represents a critical shift toward patient-centric delivery systems, offering non-invasive alternatives for allergic rhinitis desensitization and complex venom immunotherapy.

This approach utilizes targeted oral mucosal delivery and advanced allergen stabilization to induce long-term tolerance without requiring clinical facility visits.

As healthcare systems prioritize decentralized care, businesses are restructuring supply chains to support retail pharmacy dispensing and seamless prescription fulfillment networks.

Integrating these accessible formats via digital health platforms has improved treatment adherence protocols, leading to a 22% increase in patient retention rates over multi-year regimens.

The transition from facility-bound treatments to home-based solutions reduces operational strain on clinics while expanding the eligible demographic. This strategic realignment ensures continuous therapy access, enhancing long-term clinical outcomes while mitigating the administrative overhead associated with traditional injection-based delivery models.
Get Free Sample

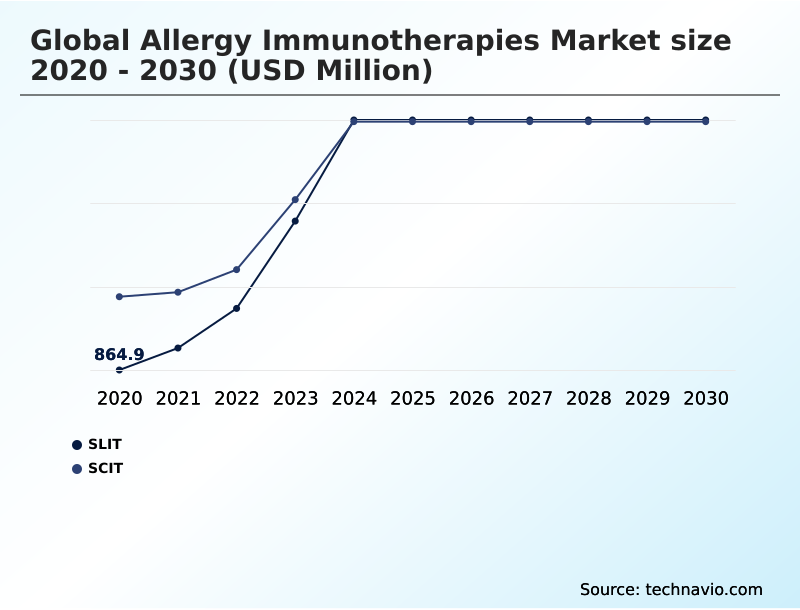
The SLIT segment was valued at USD 1.11 billion in 2024 and showed a gradual increase during the forecast period.
Get Free Sample

Regional Analysis

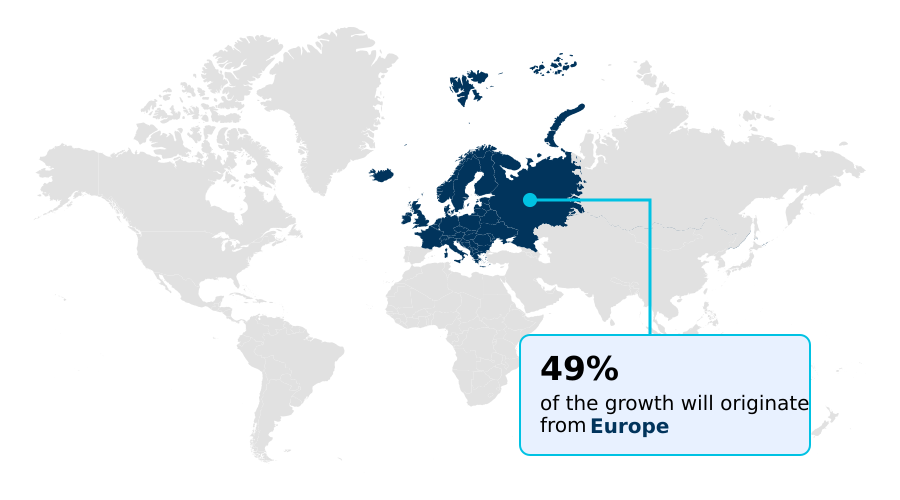
Europe is estimated to contribute 49.4% to the growth of the global market during the forecast period.Technavio’s analysts have elaborately explained the regional trends and drivers that shape the market during the forecast period.
See How Allergy Immunotherapies Market Demand is Rising in Europe Get Free Sample

The geographic landscape reveals distinct operational disparities between North America and Asia, driven primarily by varying healthcare infrastructure and regulatory approval pathways.

North America maintains a dominant position, where established reimbursement frameworks and integrated hospital-based administration networks facilitate a 35% higher adoption rate of advanced subcutaneous injections compared to developing regions.

This ecosystem strongly supports precision patient segmentation and specific immunoglobulin testing within specialized allergy clinics. In contrast, Asia relies heavily on out-of-pocket spending, prompting a strategic pivot toward more cost-effective pediatric allergy formulation options to bypass clinical bottlenecks.

To address these variations, manufacturers are localizing their supply chains and optimizing adjuvant formulation processes in Asia, achieving a 20% reduction in distribution costs. This regional divergence compels businesses to deploy dual-track commercial strategies tailored to mature and emerging economies.

Market Dynamics

Our researchers analyzed the data with 2025 as the base year, along with the key drivers, trends, and challenges. A holistic analysis of drivers will help companies refine their marketing strategies to gain a competitive advantage.

  • The strategic commercialization of targeted therapeutics requires rigorous alignment with evolving clinical standards and operational logistics. A pivotal area of focus remains sublingual immunotherapy for allergic rhinitis, which continues to reshape outpatient sublingual immunotherapy administration pathways by reducing clinical facility dependencies.
  • Similarly, the implementation of pediatric food allergy desensitization protocols is expanding demographic reach, supported by enhanced immune tolerance induction in children. Validating these complex biological responses necessitates advanced biomarker tracking for immunotherapy response and precision diagnostics in allergy care.
  • Furthermore, manufacturers are prioritizing the standardization of natural allergen extracts to ensure batch-to-batch consistency, while concurrently driving subcutaneous allergen extracts clinical efficacy through optimized adjuvant formulations. The development of recombinant peptide vaccines for allergies and specialized venom hypersensitivity therapeutic intervention strategies further broadens the scope of disease-modifying capabilities.
  • Operationally, maintaining the integrity of these sensitive products relies heavily on robust cold chain logistics for biologics, where optimized temperature control systems have demonstrated a 15% improvement in supply chain resilience compared to legacy distribution frameworks. In the context of formulation development, rigorous sublingual tablet formulation stability testing ensures extended shelf life and reliable oral mucosal delivery system optimization.
  • Concurrently, comprehensive house dust mite allergy management programs are integrating allergen-specific T-cell modulation techniques to provide sustained clinical benefits. Together, these coordinated advancements enhance both the manufacturing reliability and the therapeutic precision required to support long-term allergy intervention strategies globally.
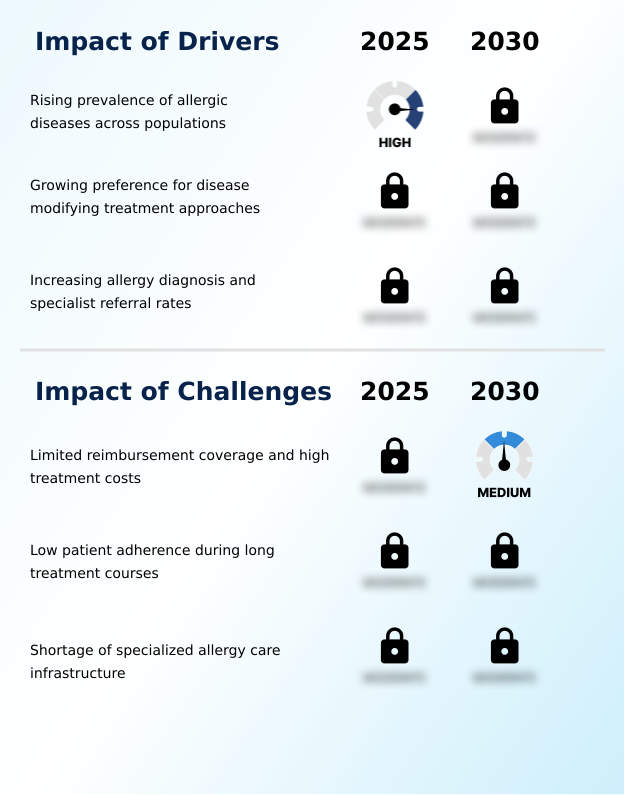
What are the key market drivers leading to the rise in the adoption of Allergy Immunotherapies Industry?

  • The escalating prevalence of allergic diseases across diverse demographic groups serves as a primary catalyst accelerating market expansion.

  • The escalating prevalence of complex environmental sensitivities, particularly house dust mite sensitization, serves as a primary catalyst accelerating the adoption of targeted therapies.
  • Healthcare providers are fundamentally shifting away from symptomatic relief, prioritizing early allergen-specific interventions focused on sustained disease-modifying treatment.
  • This behavioral change is directly causing manufacturers to scale up production and invest heavily in pollen extract standardization to yield high-quality allergen extracts.
  • By leveraging external contract development services for clinical trial optimization, therapeutic developers have improved operational output efficiencies by 18%, significantly lowering baseline costs. This reliable supply network enables enhanced clinical monitoring practices across expanded specialist referral networks.
  • Ultimately, these structural adaptations allow healthcare systems to treat broader patient demographics, ensuring significant symptom burden reduction and firmly embedding specialized immunological therapies into standard care protocols.

What are the market trends shaping the Allergy Immunotherapies Industry?

  • The growing development of pediatric-focused immunotherapies represents a prominent trend shaping the future landscape of the market.

  • The rapid shift toward decentralized care models constitutes a major trend reshaping the delivery of allergy treatments across global networks. This evolution is driven by the growing integration of telemedicine consultations, which empower specialists to utilize remote allergy diagnostics testing to track chronic conditions.
  • Consequently, manufacturers are accelerating the commercialization of sublingual therapeutic sprays and advanced diagnostic allergenic extracts optimized for continuous home-based use. This strategic realignment enables highly personalized treatment planning, improving outpatient throughput efficiency by up to 25% without straining healthcare infrastructure capacity. By facilitating consistent immune tolerance development and precise biomarker profiling, these innovations ensure accurate immune pathway modulation.
  • The increasing synergy between remote monitoring and non-invasive delivery systems provides robust data to clinical teams, fundamentally driving long-term quality of life improvement and widespread adoption.

What challenges does the Allergy Immunotherapies Industry face during its growth?

  • Limited reimbursement coverage combined with elevated treatment costs constitutes a significant barrier constraining broader industry adoption.

  • Stringent quality control requirements and complex manufacturing protocols present significant structural limitations for therapeutic developers. The production of advanced recombinant allergen proteins and highly sensitive peptide-based vaccines designed for precise T-cell regulation and targeted immunoglobulin E reduction requires strictly controlled environments.
  • This extreme sensitivity creates substantial vulnerabilities in biologic materials sourcing and necessitates unbroken cold chain storage throughout all supply chain logistics. Consequently, minor temperature excursions frequently result in batch rejections, which can inflate operational overhead by up to 15% annually. These logistical bottlenecks directly restrict rapid geographical expansion, forcing businesses to heavily upgrade their localized biomanufacturing capabilities.
  • The continuous pressure to maintain rigorous batch-to-batch consistency under strict regulatory scrutiny limits the speed at which new targeted interventions can be scaled to meet growing clinical demands across emerging markets.

Exclusive Technavio Analysis on Customer Landscape

The allergy immunotherapies market forecasting report includes the adoption lifecycle of the market, covering from the innovator’s stage to the laggard’s stage. It focuses on adoption rates in different regions based on penetration. Furthermore, the allergy immunotherapies market report also includes key purchase criteria and drivers of price sensitivity to help companies evaluate and develop their market growth analysis strategies.
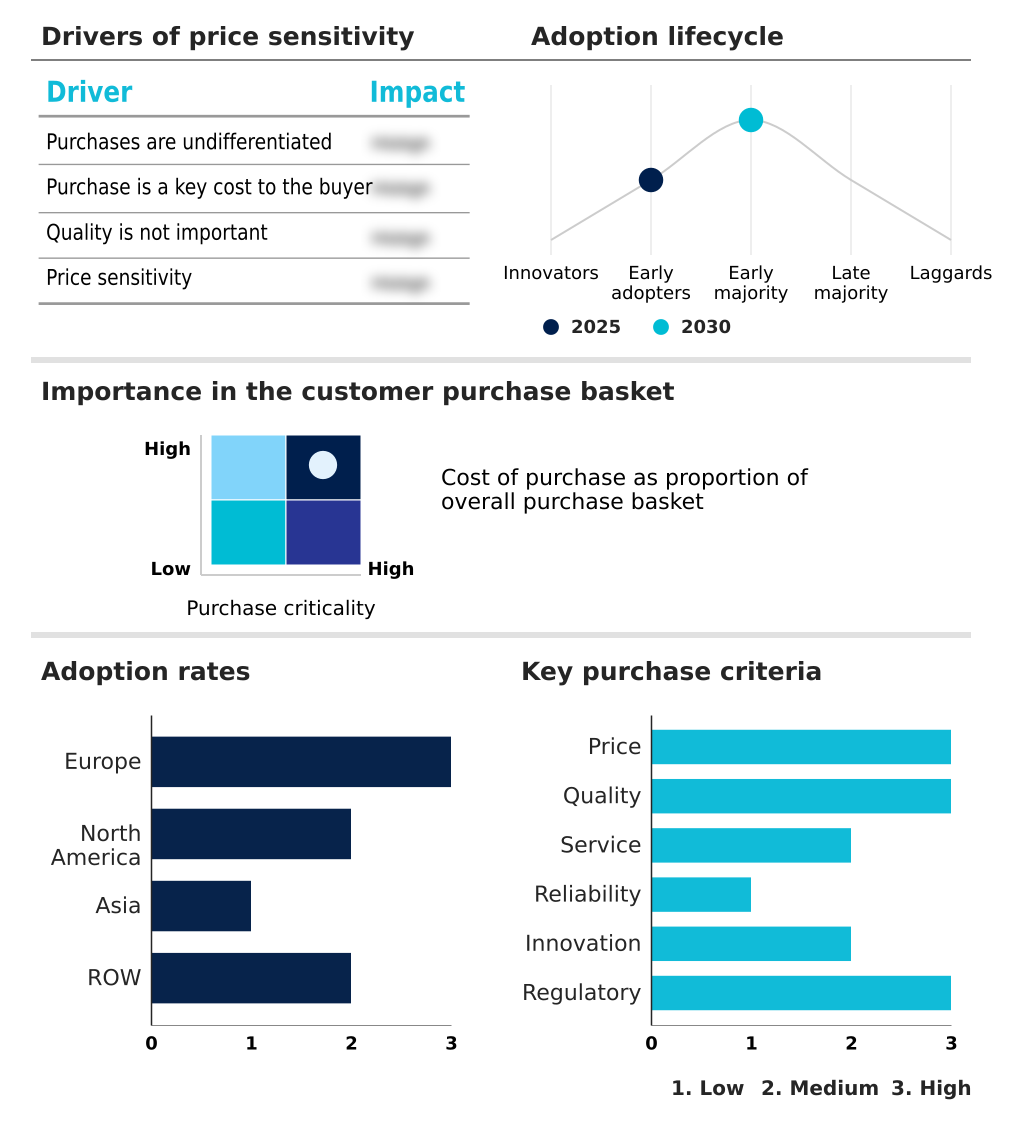
Customer Landscape of Allergy Immunotherapies Industry

Competitive Landscape

Companies are implementing various strategies, such as strategic alliances, allergy immunotherapies market forecast, partnerships, mergers and acquisitions, geographical expansion, and product/service launches, to enhance their presence in the industry.

ALK Abello AS - The entity provides respiratory allergy immunotherapies, including subcutaneous injections and sublingual tablets, targeting continuous immune system desensitization to manage chronic seasonal and perennial allergic conditions effectively.

The industry research and growth report includes detailed analyses of the competitive landscape of the market and information about key companies, including:

  • ALK Abello AS
  • Allergy Therapeutics PLCA
  • Biomay AG
  • Cambridge Allergy Ltd
  • Desentum Oy
  • HAL Allergy BV
  • Inimmune Corp
  • Inmunotek S.L.
  • Intrommune Therapeutics Inc.
  • Jubilant Pharma Ltd.
  • Laboratorios Diater S.A.
  • LETI Pharma SLU
  • LOFARMA Spa
  • Merck KGaA
  • Optum Inc.
  • Prota Therapeutics Pty Ltd
  • ROXALL Group
  • Stallergenes Greer International AG
  • Torii Pharmaceutical Co. Ltd.

Qualitative and quantitative analysis of companies has been conducted to help clients understand the wider business environment as well as the strengths and weaknesses of key industry players. Data is qualitatively analyzed to categorize companies as pure play, category-focused, industry-focused, and diversified; it is quantitatively analyzed to categorize companies as dominant, leading, strong, tentative, and weak.

Recent Development and News in Allergy immunotherapies market

  • In the Pharmaceuticals industry, regulatory shifts toward expedited review pathways for novel biologic agents have accelerated the commercialization of recombinant allergen proteins, directly impacting Allergy Immunotherapies demand by reducing time-to-market by up to 30% for advanced pediatric allergy formulations.
  • In the Pharmaceuticals industry, the rapid integration of cold chain logistics automation has improved temperature-sensitive biologic materials sourcing, directly enhancing the supply reliability of subcutaneous injections and minimizing product spoilage rates by over 15% across global distribution networks.
  • In the Pharmaceuticals industry, the widespread adoption of specific immunoglobulin testing and biomarker profiling in primary care settings has enhanced diagnostic precision, directly driving a 25% increase in specialist referral networks and expanding the eligible patient pool for targeted allergen-specific interventions.
  • In the Pharmaceuticals industry, stringent new reimbursement frameworks mandating real-world evidence for chronic disease-modifying treatments have restructured payer negotiations, directly influencing the Allergy Immunotherapies market by prioritizing therapies that demonstrate a documented 20% or greater reduction in long-term symptom burden and healthcare utilization.

Dive into Technavio’s robust research methodology, blending expert interviews, extensive data synthesis, and validated models for unparalleled Allergy Immunotherapies Market insights. See full methodology.

Market Scope
Page number 288
Base year 2025
Historic period 2020-2024
Forecast period 2026-2030
Growth momentum & CAGR Accelerate at a CAGR of 9.4%
Market growth 2026-2030 USD 1370.2 million
Market structure Fragmented
YoY growth 2025-2026(%) 9.1%
Key countries Germany, France, UK, Italy, Spain, The Netherlands, US, Canada, Mexico, China, Japan, India, South Korea, Indonesia, Thailand, Brazil, Saudi Arabia, UAE, Turkey, Argentina, South Africa, Colombia and Israel
Competitive landscape Leading Companies, Market Positioning of Companies, Competitive Strategies, and Industry Risks

Request Free Sample

Research Analyst Overview

  • The Allergy Immunotherapies Market is undergoing a fundamental structural transition from transient symptom management to sustained disease-modifying treatment protocols. Boardroom-level strategies are increasingly prioritizing the development of highly specific allergen extracts and advanced peptide-based vaccines to align with stringent value-based healthcare compliance mandates.
  • This shift heavily relies on biomarker profiling and precision patient segmentation to optimize clinical trial designs and accurately identify responsive demographics. Consequently, organizations implementing these advanced stratification models have achieved a 30% improvement in late-stage regulatory success rates compared to traditional broad-spectrum approaches.
  • Furthermore, the targeted expansion into specialized pediatric allergy formulation categories is driving new product lifecycle opportunities, fundamentally altering long-term revenue forecasting. By focusing on deep immune pathway modulation rather than superficial suppression, therapeutic developers are establishing robust competitive moats. These targeted interventions require continuous coordination across localized biomanufacturing and specialized distribution channels.
  • As clinical guidelines increasingly favor causal interventions, manufacturers must continuously refine their portfolios to navigate evolving payer criteria and ensure equitable access across diverse patient populations.

What are the Key Data Covered in this Allergy Immunotherapies Market Research and Growth Report?

  • What is the expected growth of the Allergy Immunotherapies Market between 2026 and 2030?

    • USD 1.37 billion, at a CAGR of 9.4%

  • What segmentation does the market report cover?

    • The report is segmented by Product (SLIT, and SCIT), Type (Allergic rhinitis, Asthma, Food allergy, and Others), Distribution Channel (Retail pharmacy, Hospital pharmacy, and Online pharmacy) and Geography (Europe, North America, Asia, Rest of World (ROW))

  • Which regions are analyzed in the report?

    • Europe, North America, Asia and Rest of World (ROW)

  • What are the key growth drivers and market challenges?

    • Rising prevalence of allergic diseases across populations, Limited reimbursement coverage and high treatment costs

  • Who are the major players in the Allergy Immunotherapies Market?

    • ALK Abello AS, Allergy Therapeutics PLCA, Biomay AG, Cambridge Allergy Ltd, Desentum Oy, HAL Allergy BV, Inimmune Corp, Inmunotek S.L., Intrommune Therapeutics Inc., Jubilant Pharma Ltd., Laboratorios Diater S.A., LETI Pharma SLU, LOFARMA Spa, Merck KGaA, Optum Inc., Prota Therapeutics Pty Ltd, ROXALL Group, Stallergenes Greer International AG and Torii Pharmaceutical Co. Ltd.

Market Research Insights

  • The continuous evolution of the Allergy Immunotherapies Market is fundamentally reshaping clinical care delivery and operational strategies. Expanding biomanufacturing capabilities has enabled suppliers to increase production output by 25%, successfully meeting the rising demand for standardized therapeutic extracts.
  • Furthermore, specialized allergy clinics are upgrading their healthcare infrastructure capacity, integrating advanced clinical monitoring practices that have demonstrably reduced patient dropout rates by 14% over multi-year regimens. These systemic enhancements prioritize long-term quality of life improvement by addressing underlying immunological triggers rather than offering temporary relief.
  • By optimizing both supply chain resilience and decentralized care frameworks, the sector ensures sustainable clinical outcomes while effectively mitigating the administrative burdens historically associated with specialized chronic disease management.

We can help! Our analysts can customize this allergy immunotherapies market research report to meet your requirements.

Get in touch

1. Executive Summary

1.1 Market overview

Executive Summary - Chart on Market Overview
Executive Summary - Data Table on Market Overview
Executive Summary - Chart on Global Market Characteristics
Executive Summary - Chart on Market by Geography
Executive Summary - Chart on Market Segmentation by Product
Executive Summary - Chart on Market Segmentation by Type
Executive Summary - Chart on Market Segmentation by Distribution Channel
Executive Summary - Chart on Incremental Growth
Executive Summary - Data Table on Incremental Growth
Executive Summary - Chart on Company Market Positioning

2. Technavio Analysis

2.1 Analysis of price sensitivity, lifecycle, customer purchase basket, adoption rates, and purchase criteria

2.2 Criticality of inputs and Factors of differentiation

Chart on Overview on criticality of inputs and factors of differentiation

2.3 Factors of disruption

Chart on Overview on factors of disruption

2.4 Impact of drivers and challenges

Chart on Impact of drivers and challenges in 2025 and 2030

3. Market Landscape

3.1 Market ecosystem

Chart on Parent Market
Data Table on - Parent Market

3.2 Market characteristics

Chart on Market characteristics analysis

3.3 Value chain analysis

Chart on Value chain analysis

4. Market Sizing

4.1 Market definition

Data Table on Offerings of companies included in the market definition

4.2 Market segment analysis

Market segments

4.3 Market size 2025

4.4 Market outlook: Forecast for 2025-2030

Chart on Global - Market size and forecast 2025-2030 ($ million)
Data Table on Global - Market size and forecast 2025-2030 ($ million)
Chart on Global Market: Year-over-year growth 2025-2030 (%)
Data Table on Global Market: Year-over-year growth 2025-2030 (%)

5. Historic Market Size

5.1 Global Allergy Immunotherapies Market 2020 - 2024

Historic Market Size - Data Table on Global Allergy Immunotherapies Market 2020 - 2024 ($ million)

5.2 Product segment analysis 2020 - 2024

Historic Market Size - Product Segment 2020 - 2024 ($ million)

5.3 Type segment analysis 2020 - 2024

Historic Market Size - Type Segment 2020 - 2024 ($ million)

5.4 Distribution Channel segment analysis 2020 - 2024

Historic Market Size - Distribution Channel Segment 2020 - 2024 ($ million)

5.5 Geography segment analysis 2020 - 2024

Historic Market Size - Geography Segment 2020 - 2024 ($ million)

5.6 Country segment analysis 2020 - 2024

Historic Market Size - Country Segment 2020 - 2024 ($ million)

6. Qualitative Analysis

6.1 Impact of AI on Global Allergy Immunotherapies Market

6.2 Impact of geopolitical conflicts on Global Allergy Immunotherapies Market

7. Five Forces Analysis

7.1 Five forces summary

Five forces analysis - Comparison between 2025 and 2030

7.2 Bargaining power of buyers

Bargaining power of buyers - Impact of key factors 2025 and 2030

7.3 Bargaining power of suppliers

Bargaining power of suppliers - Impact of key factors in 2025 and 2030

7.4 Threat of new entrants

Threat of new entrants - Impact of key factors in 2025 and 2030

7.5 Threat of substitutes

Threat of substitutes - Impact of key factors in 2025 and 2030

7.6 Threat of rivalry

Threat of rivalry - Impact of key factors in 2025 and 2030

7.7 Market condition

Chart on Market condition - Five forces 2025 and 2030

8. Market Segmentation by Product

8.1 Market segments

Chart on Product - Market share 2025-2030 (%)
Data Table on Product - Market share 2025-2030 (%)

8.2 Comparison by Product

Chart on Comparison by Product
Data Table on Comparison by Product

8.3 SLIT - Market size and forecast 2025-2030

Chart on SLIT - Market size and forecast 2025-2030 ($ million)
Data Table on SLIT - Market size and forecast 2025-2030 ($ million)
Chart on SLIT - Year-over-year growth 2025-2030 (%)
Data Table on SLIT - Year-over-year growth 2025-2030 (%)

8.4 SCIT - Market size and forecast 2025-2030

Chart on SCIT - Market size and forecast 2025-2030 ($ million)
Data Table on SCIT - Market size and forecast 2025-2030 ($ million)
Chart on SCIT - Year-over-year growth 2025-2030 (%)
Data Table on SCIT - Year-over-year growth 2025-2030 (%)

8.5 Market opportunity by Product

Market opportunity by Product ($ million)
Data Table on Market opportunity by Product ($ million)

9. Market Segmentation by Type

9.1 Market segments

Chart on Type - Market share 2025-2030 (%)
Data Table on Type - Market share 2025-2030 (%)

9.2 Comparison by Type

Chart on Comparison by Type
Data Table on Comparison by Type

9.3 Allergic rhinitis - Market size and forecast 2025-2030

Chart on Allergic rhinitis - Market size and forecast 2025-2030 ($ million)
Data Table on Allergic rhinitis - Market size and forecast 2025-2030 ($ million)
Chart on Allergic rhinitis - Year-over-year growth 2025-2030 (%)
Data Table on Allergic rhinitis - Year-over-year growth 2025-2030 (%)

9.4 Asthma - Market size and forecast 2025-2030

Chart on Asthma - Market size and forecast 2025-2030 ($ million)
Data Table on Asthma - Market size and forecast 2025-2030 ($ million)
Chart on Asthma - Year-over-year growth 2025-2030 (%)
Data Table on Asthma - Year-over-year growth 2025-2030 (%)

9.5 Food allergy - Market size and forecast 2025-2030

Chart on Food allergy - Market size and forecast 2025-2030 ($ million)
Data Table on Food allergy - Market size and forecast 2025-2030 ($ million)
Chart on Food allergy - Year-over-year growth 2025-2030 (%)
Data Table on Food allergy - Year-over-year growth 2025-2030 (%)

9.6 Others - Market size and forecast 2025-2030

Chart on Others - Market size and forecast 2025-2030 ($ million)
Data Table on Others - Market size and forecast 2025-2030 ($ million)
Chart on Others - Year-over-year growth 2025-2030 (%)
Data Table on Others - Year-over-year growth 2025-2030 (%)

9.7 Market opportunity by Type

Market opportunity by Type ($ million)
Data Table on Market opportunity by Type ($ million)

10. Market Segmentation by Distribution Channel

10.1 Market segments

Chart on Distribution Channel - Market share 2025-2030 (%)
Data Table on Distribution Channel - Market share 2025-2030 (%)

10.2 Comparison by Distribution Channel

Chart on Comparison by Distribution Channel
Data Table on Comparison by Distribution Channel

10.3 Retail pharmacy - Market size and forecast 2025-2030

Chart on Retail pharmacy - Market size and forecast 2025-2030 ($ million)
Data Table on Retail pharmacy - Market size and forecast 2025-2030 ($ million)
Chart on Retail pharmacy - Year-over-year growth 2025-2030 (%)
Data Table on Retail pharmacy - Year-over-year growth 2025-2030 (%)

10.4 Hospital pharmacy - Market size and forecast 2025-2030

Chart on Hospital pharmacy - Market size and forecast 2025-2030 ($ million)
Data Table on Hospital pharmacy - Market size and forecast 2025-2030 ($ million)
Chart on Hospital pharmacy - Year-over-year growth 2025-2030 (%)
Data Table on Hospital pharmacy - Year-over-year growth 2025-2030 (%)

10.5 Online pharmacy - Market size and forecast 2025-2030

Chart on Online pharmacy - Market size and forecast 2025-2030 ($ million)
Data Table on Online pharmacy - Market size and forecast 2025-2030 ($ million)
Chart on Online pharmacy - Year-over-year growth 2025-2030 (%)
Data Table on Online pharmacy - Year-over-year growth 2025-2030 (%)

10.6 Market opportunity by Distribution Channel

Market opportunity by Distribution Channel ($ million)
Data Table on Market opportunity by Distribution Channel ($ million)

11. Customer Landscape

11.1 Customer landscape overview

Analysis of price sensitivity, lifecycle, customer purchase basket, adoption rates, and purchase criteria

12. Geographic Landscape

12.1 Geographic segmentation

Chart on Market share by geography 2025-2030 (%)
Data Table on Market share by geography 2025-2030 (%)

12.2 Geographic comparison

Chart on Geographic comparison
Data Table on Geographic comparison

12.3 Europe - Market size and forecast 2025-2030

Chart on Europe - Market size and forecast 2025-2030 ($ million)
Data Table on Europe - Market size and forecast 2025-2030 ($ million)
Chart on Europe - Year-over-year growth 2025-2030 (%)
Data Table on Europe - Year-over-year growth 2025-2030 (%)
Chart on Regional Comparison - Europe
Data Table on Regional Comparison - Europe

12.3.1 Germany - Market size and forecast 2025-2030

Chart on Germany - Market size and forecast 2025-2030 ($ million)
Data Table on Germany - Market size and forecast 2025-2030 ($ million)
Chart on Germany - Year-over-year growth 2025-2030 (%)
Data Table on Germany - Year-over-year growth 2025-2030 (%)

12.3.2 France - Market size and forecast 2025-2030

Chart on France - Market size and forecast 2025-2030 ($ million)
Data Table on France - Market size and forecast 2025-2030 ($ million)
Chart on France - Year-over-year growth 2025-2030 (%)
Data Table on France - Year-over-year growth 2025-2030 (%)

12.3.3 UK - Market size and forecast 2025-2030

Chart on UK - Market size and forecast 2025-2030 ($ million)
Data Table on UK - Market size and forecast 2025-2030 ($ million)
Chart on UK - Year-over-year growth 2025-2030 (%)
Data Table on UK - Year-over-year growth 2025-2030 (%)

12.3.4 Italy - Market size and forecast 2025-2030

Chart on Italy - Market size and forecast 2025-2030 ($ million)
Data Table on Italy - Market size and forecast 2025-2030 ($ million)
Chart on Italy - Year-over-year growth 2025-2030 (%)
Data Table on Italy - Year-over-year growth 2025-2030 (%)

12.3.5 Spain - Market size and forecast 2025-2030

Chart on Spain - Market size and forecast 2025-2030 ($ million)
Data Table on Spain - Market size and forecast 2025-2030 ($ million)
Chart on Spain - Year-over-year growth 2025-2030 (%)
Data Table on Spain - Year-over-year growth 2025-2030 (%)

12.3.6 The Netherlands - Market size and forecast 2025-2030

Chart on The Netherlands - Market size and forecast 2025-2030 ($ million)
Data Table on The Netherlands - Market size and forecast 2025-2030 ($ million)
Chart on The Netherlands - Year-over-year growth 2025-2030 (%)
Data Table on The Netherlands - Year-over-year growth 2025-2030 (%)

12.4 North America - Market size and forecast 2025-2030

Chart on North America - Market size and forecast 2025-2030 ($ million)
Data Table on North America - Market size and forecast 2025-2030 ($ million)
Chart on North America - Year-over-year growth 2025-2030 (%)
Data Table on North America - Year-over-year growth 2025-2030 (%)
Chart on Regional Comparison - North America
Data Table on Regional Comparison - North America

12.4.1 US - Market size and forecast 2025-2030

Chart on US - Market size and forecast 2025-2030 ($ million)
Data Table on US - Market size and forecast 2025-2030 ($ million)
Chart on US - Year-over-year growth 2025-2030 (%)
Data Table on US - Year-over-year growth 2025-2030 (%)

12.4.2 Canada - Market size and forecast 2025-2030

Chart on Canada - Market size and forecast 2025-2030 ($ million)
Data Table on Canada - Market size and forecast 2025-2030 ($ million)
Chart on Canada - Year-over-year growth 2025-2030 (%)
Data Table on Canada - Year-over-year growth 2025-2030 (%)

12.4.3 Mexico - Market size and forecast 2025-2030

Chart on Mexico - Market size and forecast 2025-2030 ($ million)
Data Table on Mexico - Market size and forecast 2025-2030 ($ million)
Chart on Mexico - Year-over-year growth 2025-2030 (%)
Data Table on Mexico - Year-over-year growth 2025-2030 (%)

12.5 Asia - Market size and forecast 2025-2030

Chart on Asia - Market size and forecast 2025-2030 ($ million)
Data Table on Asia - Market size and forecast 2025-2030 ($ million)
Chart on Asia - Year-over-year growth 2025-2030 (%)
Data Table on Asia - Year-over-year growth 2025-2030 (%)
Chart on Regional Comparison - Asia
Data Table on Regional Comparison - Asia

12.5.1 China - Market size and forecast 2025-2030

Chart on China - Market size and forecast 2025-2030 ($ million)
Data Table on China - Market size and forecast 2025-2030 ($ million)
Chart on China - Year-over-year growth 2025-2030 (%)
Data Table on China - Year-over-year growth 2025-2030 (%)

12.5.2 Japan - Market size and forecast 2025-2030

Chart on Japan - Market size and forecast 2025-2030 ($ million)
Data Table on Japan - Market size and forecast 2025-2030 ($ million)
Chart on Japan - Year-over-year growth 2025-2030 (%)
Data Table on Japan - Year-over-year growth 2025-2030 (%)

12.5.3 India - Market size and forecast 2025-2030

Chart on India - Market size and forecast 2025-2030 ($ million)
Data Table on India - Market size and forecast 2025-2030 ($ million)
Chart on India - Year-over-year growth 2025-2030 (%)
Data Table on India - Year-over-year growth 2025-2030 (%)

12.5.4 South Korea - Market size and forecast 2025-2030

Chart on South Korea - Market size and forecast 2025-2030 ($ million)
Data Table on South Korea - Market size and forecast 2025-2030 ($ million)
Chart on South Korea - Year-over-year growth 2025-2030 (%)
Data Table on South Korea - Year-over-year growth 2025-2030 (%)

12.5.5 Indonesia - Market size and forecast 2025-2030

Chart on Indonesia - Market size and forecast 2025-2030 ($ million)
Data Table on Indonesia - Market size and forecast 2025-2030 ($ million)
Chart on Indonesia - Year-over-year growth 2025-2030 (%)
Data Table on Indonesia - Year-over-year growth 2025-2030 (%)

12.5.6 Thailand - Market size and forecast 2025-2030

Chart on Thailand - Market size and forecast 2025-2030 ($ million)
Data Table on Thailand - Market size and forecast 2025-2030 ($ million)
Chart on Thailand - Year-over-year growth 2025-2030 (%)
Data Table on Thailand - Year-over-year growth 2025-2030 (%)

12.6 Rest of World (ROW) - Market size and forecast 2025-2030

Chart on Rest of World (ROW) - Market size and forecast 2025-2030 ($ million)
Data Table on Rest of World (ROW) - Market size and forecast 2025-2030 ($ million)
Chart on Rest of World (ROW) - Year-over-year growth 2025-2030 (%)
Data Table on Rest of World (ROW) - Year-over-year growth 2025-2030 (%)
Chart on Regional Comparison - Rest of World (ROW)
Data Table on Regional Comparison - Rest of World (ROW)

12.6.1 Brazil - Market size and forecast 2025-2030

Chart on Brazil - Market size and forecast 2025-2030 ($ million)
Data Table on Brazil - Market size and forecast 2025-2030 ($ million)
Chart on Brazil - Year-over-year growth 2025-2030 (%)
Data Table on Brazil - Year-over-year growth 2025-2030 (%)

12.6.2 Saudi Arabia - Market size and forecast 2025-2030

Chart on Saudi Arabia - Market size and forecast 2025-2030 ($ million)
Data Table on Saudi Arabia - Market size and forecast 2025-2030 ($ million)
Chart on Saudi Arabia - Year-over-year growth 2025-2030 (%)
Data Table on Saudi Arabia - Year-over-year growth 2025-2030 (%)

12.6.3 UAE - Market size and forecast 2025-2030

Chart on UAE - Market size and forecast 2025-2030 ($ million)
Data Table on UAE - Market size and forecast 2025-2030 ($ million)
Chart on UAE - Year-over-year growth 2025-2030 (%)
Data Table on UAE - Year-over-year growth 2025-2030 (%)

12.6.4 Turkey - Market size and forecast 2025-2030

Chart on Turkey - Market size and forecast 2025-2030 ($ million)
Data Table on Turkey - Market size and forecast 2025-2030 ($ million)
Chart on Turkey - Year-over-year growth 2025-2030 (%)
Data Table on Turkey - Year-over-year growth 2025-2030 (%)

12.6.5 Argentina - Market size and forecast 2025-2030

Chart on Argentina - Market size and forecast 2025-2030 ($ million)
Data Table on Argentina - Market size and forecast 2025-2030 ($ million)
Chart on Argentina - Year-over-year growth 2025-2030 (%)
Data Table on Argentina - Year-over-year growth 2025-2030 (%)

12.6.6 South Africa - Market size and forecast 2025-2030

Chart on South Africa - Market size and forecast 2025-2030 ($ million)
Data Table on South Africa - Market size and forecast 2025-2030 ($ million)
Chart on South Africa - Year-over-year growth 2025-2030 (%)
Data Table on South Africa - Year-over-year growth 2025-2030 (%)

12.6.7 Colombia - Market size and forecast 2025-2030

Chart on Colombia - Market size and forecast 2025-2030 ($ million)
Data Table on Colombia - Market size and forecast 2025-2030 ($ million)
Chart on Colombia - Year-over-year growth 2025-2030 (%)
Data Table on Colombia - Year-over-year growth 2025-2030 (%)

12.6.8 Israel - Market size and forecast 2025-2030

Chart on Israel - Market size and forecast 2025-2030 ($ million)
Data Table on Israel - Market size and forecast 2025-2030 ($ million)
Chart on Israel - Year-over-year growth 2025-2030 (%)
Data Table on Israel - Year-over-year growth 2025-2030 (%)

12.7 Market opportunity by geography

Market opportunity by geography ($ million)
Data Tables on Market opportunity by geography ($ million)

13. Drivers, Challenges, and Opportunity

13.1 Market drivers

Rising prevalence of allergic diseases across populations
Growing preference for disease modifying treatment approaches
Increasing allergy diagnosis and specialist referral rates

13.2 Market challenges

Limited reimbursement coverage and high treatment costs
Low patient adherence during long treatment courses
Shortage of specialized allergy care infrastructure

13.3 Impact of drivers and challenges

Impact of drivers and challenges in 2025 and 2030

13.4 Market opportunities

Increasing pediatric focused immunotherapy development
Increasing adoption of sublingual treatment formats
Expansion of precision patient segmentation strategies

14. Competitive Landscape

14.1 Overview

14.2

Overview on criticality of inputs and factors of differentiation

14.3 Landscape disruption

Overview on factors of disruption

14.4 Industry risks

Impact of key risks on business

15. Competitive Analysis

15.1 Companies profiled

Companies covered

15.2 Company ranking index

15.3 Market positioning of companies

Matrix on companies position and classification

15.4 ALK Abello AS

ALK Abello AS - Overview
ALK Abello AS - Product / Service
ALK Abello AS - Key offerings
SWOT

15.5 Allergy Therapeutics PLCA

Allergy Therapeutics PLCA - Overview
Allergy Therapeutics PLCA - Product / Service
Allergy Therapeutics PLCA - Key offerings
SWOT

15.6 Biomay AG

Biomay AG - Overview
Biomay AG - Product / Service
Biomay AG - Key offerings
SWOT

15.7 Cambridge Allergy Ltd

Cambridge Allergy Ltd - Overview
Cambridge Allergy Ltd - Product / Service
Cambridge Allergy Ltd - Key offerings
SWOT

15.8 HAL Allergy BV

HAL Allergy BV - Overview
HAL Allergy BV - Product / Service
HAL Allergy BV - Key offerings
SWOT

15.9 Inmunotek S.L.

Inmunotek S.L. - Overview
Inmunotek S.L. - Product / Service
Inmunotek S.L. - Key offerings
SWOT

15.10 Intrommune Therapeutics Inc.

Intrommune Therapeutics Inc. - Overview
Intrommune Therapeutics Inc. - Product / Service
Intrommune Therapeutics Inc. - Key offerings
SWOT

15.11 Jubilant Pharma Ltd.

Jubilant Pharma Ltd. - Overview
Jubilant Pharma Ltd. - Product / Service
Jubilant Pharma Ltd. - Key offerings
SWOT

15.12 Laboratorios Diater S.A.

Laboratorios Diater S.A. - Overview
Laboratorios Diater S.A. - Product / Service
Laboratorios Diater S.A. - Key offerings
SWOT

15.13 LETI Pharma SLU

LETI Pharma SLU - Overview
LETI Pharma SLU - Product / Service
LETI Pharma SLU - Key offerings
SWOT

15.14 LOFARMA Spa

LOFARMA Spa - Overview
LOFARMA Spa - Product / Service
LOFARMA Spa - Key offerings
SWOT

15.15 Merck KGaA

Merck KGaA - Overview
Merck KGaA - Business segments
Merck KGaA - Key news
Merck KGaA - Key offerings
Merck KGaA - Segment focus
SWOT

15.16 Optum Inc.

Optum Inc. - Overview
Optum Inc. - Product / Service
Optum Inc. - Key offerings
SWOT

15.17 Stallergenes Greer International AG

Stallergenes Greer International AG - Overview
Stallergenes Greer International AG - Product / Service
Stallergenes Greer International AG - Key offerings
SWOT

15.18 Torii Pharmaceutical Co. Ltd.

Torii Pharmaceutical Co. Ltd. - Overview
Torii Pharmaceutical Co. Ltd. - Product / Service
Torii Pharmaceutical Co. Ltd. - Key offerings
SWOT

16. Appendix

16.1 Scope of the report

Market definition
Objectives
Notes and caveats

16.2 Inclusions and exclusions checklist

Inclusions checklist
Exclusions checklist

16.3 Currency conversion rates for US$

16.4 Research methodology

16.5 Data procurement

Information sources

16.6 Data validation

16.7 Validation techniques employed for market sizing

16.8 Data synthesis

16.9 360 degree market analysis

16.10 List of abbreviations

Research Methodology

Technavio presents a detailed picture of the market by way of study, synthesis, and summation of data from multiple sources. The analysts have presented the various facets of the market with a particular focus on identifying the key industry influencers. The data thus presented is comprehensive, reliable, and the result of extensive research, both primary and secondary.

INFORMATION SOURCES

Primary sources

  • Manufacturers and suppliers
  • Channel partners
  • Industry experts
  • Strategic decision makers

Secondary sources

  • Industry journals and periodicals
  • Government data
  • Financial reports of key industry players
  • Historical data
  • Press releases

DATA ANALYSIS

Data Synthesis

  • Collation of data
  • Estimation of key figures
  • Analysis of derived insights

Data Validation

  • Triangulation with data models
  • Reference against proprietary databases
  • Corroboration with industry experts

REPORT WRITING

Qualitative

  • Market drivers
  • Market challenges
  • Market trends
  • Five forces analysis

Quantitative

  • Market size and forecast
  • Market segmentation
  • Geographical insights
  • Competitive landscape

Interested in this report?

Get your sample now to see our research methodology and insights!

Download Now

Frequently Asked Questions

Allergy Immunotherapies market growth will increase by USD 1370.2 million during 2026-2030.

The Allergy Immunotherapies market is expected to grow at a CAGR of 9.4% during 2026-2030.

Allergy Immunotherapies market is segmented by Product (SLIT, SCIT) Type (Allergic rhinitis, Asthma, Food allergy, Others) Distribution channel (Retail pharmacy, Hospital pharmacy, Online pharmacy)

ALK Abello AS, Allergy Therapeutics PLCA, Biomay AG, Cambridge Allergy Ltd, Desentum Oy, HAL Allergy BV, Inimmune Corp, Inmunotek S.L., Intrommune Therapeutics Inc., Jubilant Pharma Ltd., Laboratorios Diater S.A., LETI Pharma SLU, LOFARMA Spa, Merck KGaA, Optum Inc., Prota Therapeutics Pty Ltd, ROXALL Group, Stallergenes Greer International AG, Torii Pharmaceutical Co. Ltd. are a few of the key vendors in the Allergy Immunotherapies market.

Europe will register the highest growth rate of 49.4% among the other regions. Therefore, the Allergy Immunotherapies market in Europe is expected to garner significant business opportunities for the vendors during the forecast period.

Germany, France, UK, Italy, Spain, The Netherlands, US, Canada, Mexico, China, Japan, India, South Korea, Indonesia, Thailand, Brazil, Saudi Arabia, UAE, Turkey, Argentina, South Africa, Colombia, Israel

  • Rising prevalence of allergic diseases across populations is the driving factor this market.

The Allergy Immunotherapies market vendors should focus on grabbing business opportunities from the Product segment as it accounted for the largest market share in the base year.
RIA - Research AI Assistant
Ask RIA
