
Alternative Finance Market Analysis, Size, and Forecast 2026-2030: North America (US, Canada, and Mexico), APAC (China, Japan, and India), Europe (Germany, UK, and France), South America (Brazil, Argentina, and Chile), Middle East and Africa (Saudi Arabia, UAE, and South Africa), and Rest of World (ROW)

Alternative Finance Market Analysis, Size, and Forecast 2026-2030:
North America (US, Canada, and Mexico), APAC (China, Japan, and India), Europe (Germany, UK, and France), South America (Brazil, Argentina, and Chile), Middle East and Africa (Saudi Arabia, UAE, and South Africa), and Rest of World (ROW)

Published: Oct 2026 290 Pages SKU: IRTNTR44221

Market Overview at a Glance

$70.97 B
Market Opportunity
7.3%
CAGR 2025 - 2030
67.7%
North America Growth
$129.68 B
P2P lending segment 2024

Alternative Finance Market Size 2026-2030

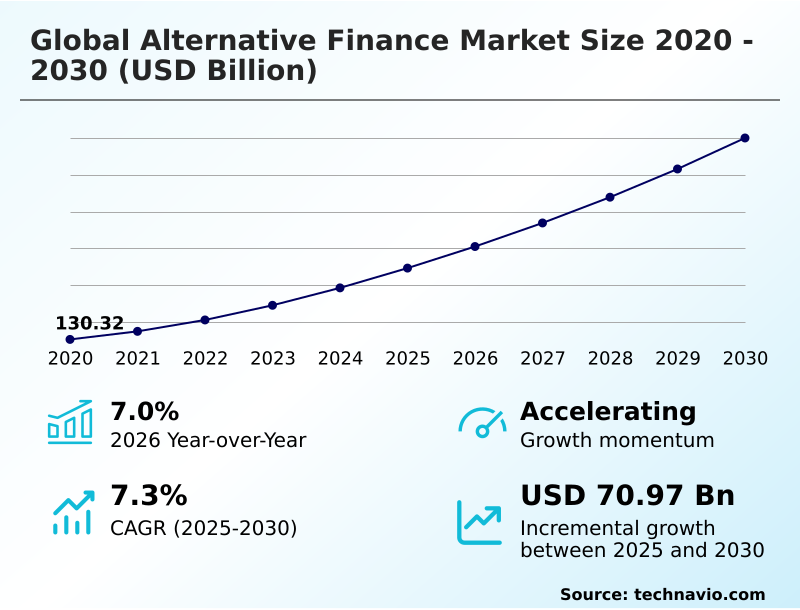
The alternative finance market size is valued to increase by USD 70.97 billion, at a CAGR of 7.3% from 2025 to 2030. Widening SMEs credit gap and traditional banking restrictions will drive the alternative finance market.

Major Market Trends & Insights

  • North America dominated the market and accounted for a 67.7% growth during the forecast period.
  • By Type - P2P lending segment was valued at USD 129.68 billion in 2024
  • By End-user - Individual segment accounted for the largest market revenue share in 2024

Market Size & Forecast

  • Market Opportunities: USD 109.87 billion
  • Market Future Opportunities: USD 70.97 billion
  • CAGR from 2025 to 2030 : 7.3%

Market Summary

  • The Alternative Finance Market exhibits accelerated structural expansion as decentralized digital platforms systematically capture corporate lending volumes traditionally dominated by legacy commercial banks. By embedding credit lines directly into enterprise supply chain networks, non-bank platforms optimize working capital distribution for manufacturers.
  • For instance, integrating automated underwriting reduces invoice processing delays by 35% compared to conventional manual bank audits, delivering immediate cash flow to suppliers. The widening global credit gap for small and medium enterprises acts as a primary driver, as strict commercial banking regulations force agile businesses to seek accessible digital liquidity.
  • However, severe regulatory fragmentation presents a persistent challenge, forcing platforms to deploy vast capital into localized compliance infrastructure. This decentralized architecture ultimately reshapes corporate capital acquisition, establishing resilient credit pathways that operate independently of macroeconomic banking constraints.

What will be the Size of the Alternative Finance Market during the forecast period?
Get Key Insights on Market Forecast (PDF) Get Free Sample

How is the Alternative Finance Market Segmented?

The alternative finance industry research report provides comprehensive data (region-wise segment analysis), with forecasts and estimates in "USD million" for the period 2026-2030, as well as historical data from 2020-2024 for the following segments.

  • Type
    • P2P lending
    • Crowdfunding
    • Invoice trading
  • End-user
    • Individual
    • Organization
  • Platform
    • Balance sheet lenders
    • P2P portals
    • Blockchain and AI driven platforms
  • Geography
    • North America
      • US
      • Canada
      • Mexico
    • APAC
      • China
      • Japan
      • India
      • South Korea
      • Australia
      • Indonesia
    • Europe
      • Germany
      • UK
      • France
      • Italy
      • Spain
      • The Netherlands
    • South America
      • Brazil
      • Argentina
      • Chile
    • Middle East and Africa
      • Saudi Arabia
      • UAE
      • South Africa
      • Israel
      • Turkey

By Type Insights

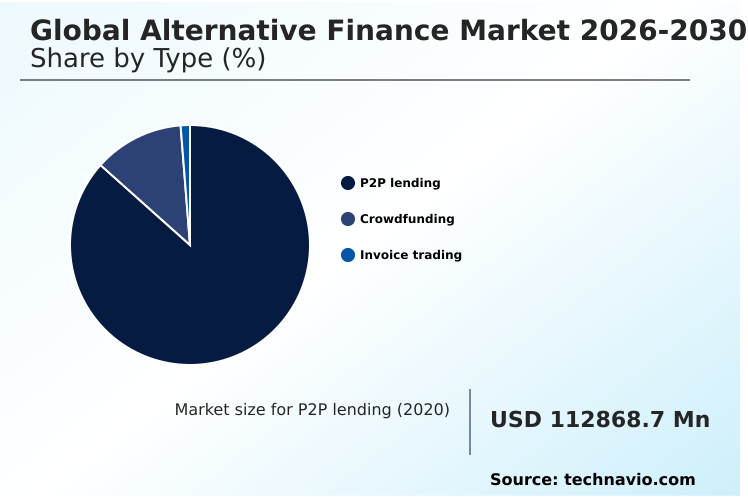
The p2p lending segment is estimated to witness significant growth during the forecast period.

The invoice trading and lending segment functions as a digital intermediary matching lenders with credit-seeking enterprises. Utilizing decentralized ledger architectures, this segment executes rapid debt origination, heavily outpacing traditional banking constraints.

Platforms analyze digital-first originations to compute dynamic risk measures, reducing administrative bottlenecks. By integrating advanced algorithmic loan pricing and automated escrow management, lenders achieve a 25% reduction in underwriting times.

As platforms expand, they offer fractionalized risk tranches that increase overall portfolio stability. This modernization ensures that credit assessment automation delivers precise capital deployment, driving operational superiority across the alternative finance space.
Get Free Sample

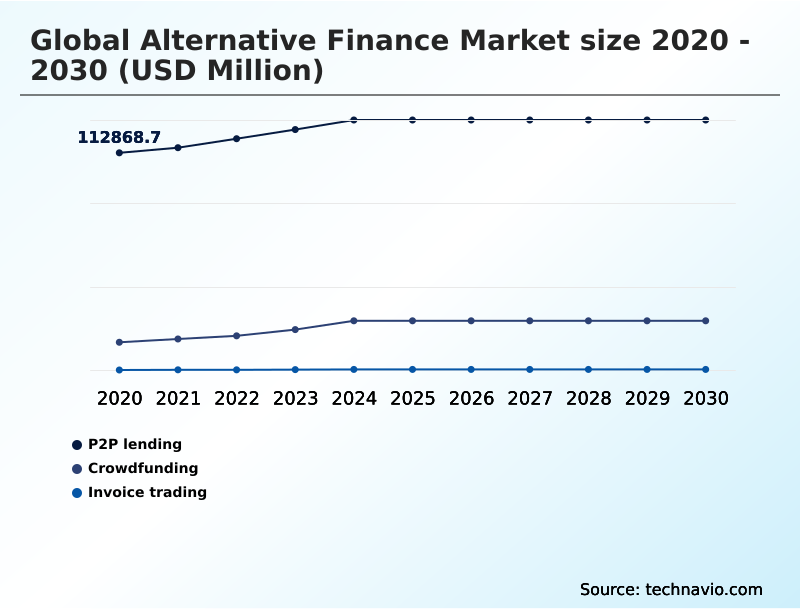
The P2P lending segment was valued at USD 129.68 billion in 2024 and showed a gradual increase during the forecast period.
Get Free Sample

Regional Analysis

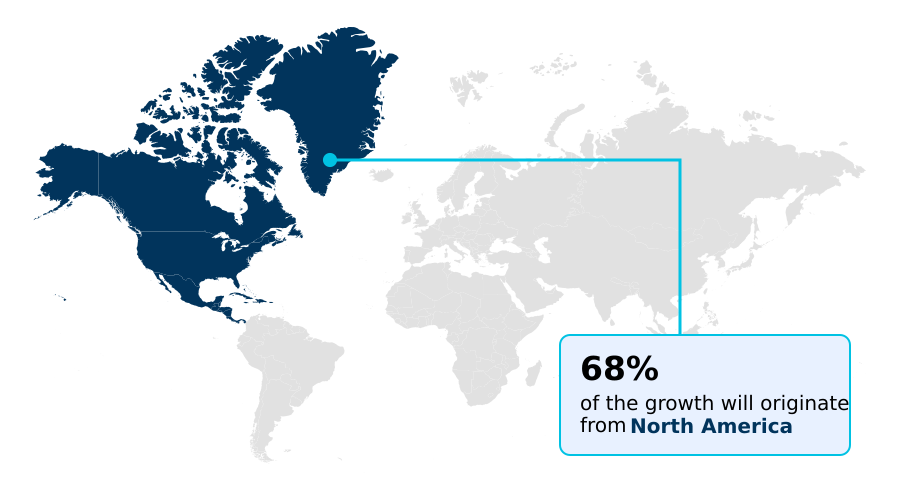
North America is estimated to contribute 67.7% to the growth of the global market during the forecast period.Technavio’s analysts have elaborately explained the regional trends and drivers that shape the market during the forecast period.
See How Alternative Finance Market Demand is Rising in North America Get Free Sample

The Alternative Finance architecture demonstrates distinct evolutionary patterns across diverse regional landscapes.

North America maintains structural dominance, where deep institutional liquidity and advanced application programming interfaces enable asset managers to achieve a 20% higher secondary market liquidity rate than European counterparts.

Meanwhile, APAC experiences accelerated adoption of enterprise resource planning integration, allowing regional platforms to underwrite commercial loans rapidly using non-traditional data sets.

In Europe, standardized cryptographic transparency protocols and open banking frameworks have improved cross-border transfer protocols, reducing compliance auditing costs by 15%.

This divergence highlights how varying levels of fractional ownership tokenization dictate the speed at which alternative platforms deliver capital across global business sectors.

Market Dynamics

Our researchers analyzed the data with 2025 as the base year, along with the key drivers, trends, and challenges. A holistic analysis of drivers will help companies refine their marketing strategies to gain a competitive advantage.

  • The continuous evolution of the Alternative Finance ecosystem is fundamentally altering how enterprises manage working capital and execute strategic capital formation. As traditional banking institutions retreat from mid-market lending due to restrictive macroprudential guidelines, businesses increasingly adopt automated credit decisioning workflows to secure immediate liquidity.
  • This structural pivot allows supply chain managers to bypass weeks of manual auditing, achieving a nearly 40% improvement in capital deployment efficiency compared to legacy commercial loan applications. Simultaneously, the maturation of decentralized finance asset tokenization introduces unprecedented flexibility for institutional investors, enabling the frictionless exchange of historically illiquid commercial debt.
  • By integrating machine learning alternative credit scoring, lending networks can accurately underwrite thin-file corporate applicants using non-traditional metrics such as daily payment volumes and logistics data. Furthermore, the deployment of open banking integration protocols grants platforms direct, secure access to corporate financial histories, significantly mitigating synthetic fraud and lowering default risks.
  • As these decentralized systems scale, peer-to-peer loan origination platforms offer a highly competitive structural alternative to standard bank overdrafts. This digitalization of risk assessment ensures agile organizations sustain robust operational continuity and navigate economic volatility without relying on conventional financial intermediaries.
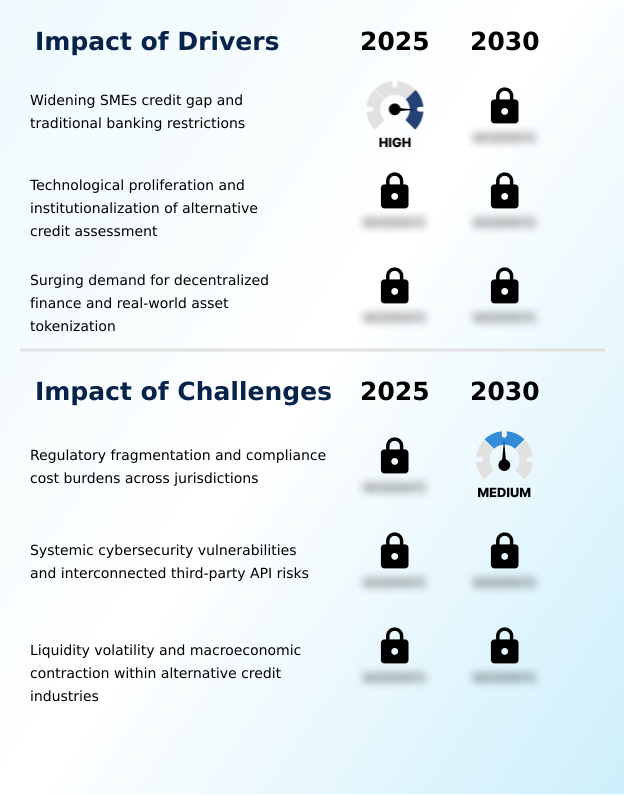
What are the key market drivers leading to the rise in the adoption of Alternative Finance Industry?

  • The widening credit gap for small and medium enterprises, exacerbated by stringent traditional banking restrictions, serves as the primary driver propelling expansion.

  • The persistent global credit gap for mid-market enterprises acts as a catalyst driving the expansion of Alternative Finance architectures. Agile platforms utilize machine learning credit scoring and unstructured alternative data to identify viable borrowers excluded by traditional banks.
  • By evaluating logistics workflows and electronic commerce cash flows, invoice factoring systems decrease false-positive loan rejections by 22% compared to static bureau metrics. This precision drastically lowers default rates, attracting asset managers to private credit.
  • Consequently, organizations achieve a 30% improvement in working capital acquisition speed. Utilizing automated covenant validation and predictive risk intelligence allows balance sheet lending platforms to scale operations rapidly, granting investors secure liquidity pool exposure without relying on legacy channels.

What are the market trends shaping the Alternative Finance Industry?

  • The accelerated penetration of embeddable financial infrastructures within non-financial platforms constitutes a significant upcoming trend. This structural integration allows digital ecosystems to offer seamless credit origination at the point of transaction.

  • The Alternative Finance sector is experiencing a structural shift through the accelerated integration of real-world asset tokenization and embedded financial infrastructures. As platforms embed credit solutions into operational software, businesses secure capital at the exact point of consumption. This integration of automated smart contracts reduces transaction processing latency by 45%, providing instantaneous liquidity.
  • The widespread adoption of digital supply chain metrics and point-of-sale transaction histories allows platforms to accurately model risk, improving overall forecast reliability by 18%. This trend empowers organizations to optimize micro-loan distribution efficiently. By leveraging decentralized finance applications, entities systematically lower borrowing costs. Furthermore, adopting net asset value financing ensures optimal resource allocation for institutional lenders.

What challenges does the Alternative Finance Industry face during its growth?

  • Regulatory fragmentation and escalating compliance cost burdens across multiple jurisdictions represent critical challenges impeding seamless industry expansion.

  • Severe regulatory fragmentation and escalating cybersecurity vulnerabilities represent critical structural limitations restraining the Alternative Finance landscape. Operating across diverse jurisdictions requires massive capital allocation toward localized compliance, which diminishes overall platform profitability by nearly 15%. The reliance on algorithmic underwriting models exposes networks to sophisticated hacking threats and synthetic identity fraud prevention failures.
  • A breach in digital wallet interfaces can compromise millions of accounts, causing severe reputational damage to equity crowdfunding portals. Furthermore, executing robust smart contract execution across immutable blockchain ledgers increases operational overhead by 20%.
  • To mitigate risk, platforms struggle to evaluate real-time electronic inventory, forcing them to adopt complex hybrid subscription lines and evergreen fund architectures to sustain baseline institutional security requirements in a volatile digital economy.

Exclusive Technavio Analysis on Customer Landscape

The alternative finance market forecasting report includes the adoption lifecycle of the market, covering from the innovator’s stage to the laggard’s stage. It focuses on adoption rates in different regions based on penetration. Furthermore, the alternative finance market report also includes key purchase criteria and drivers of price sensitivity to help companies evaluate and develop their market growth analysis strategies.
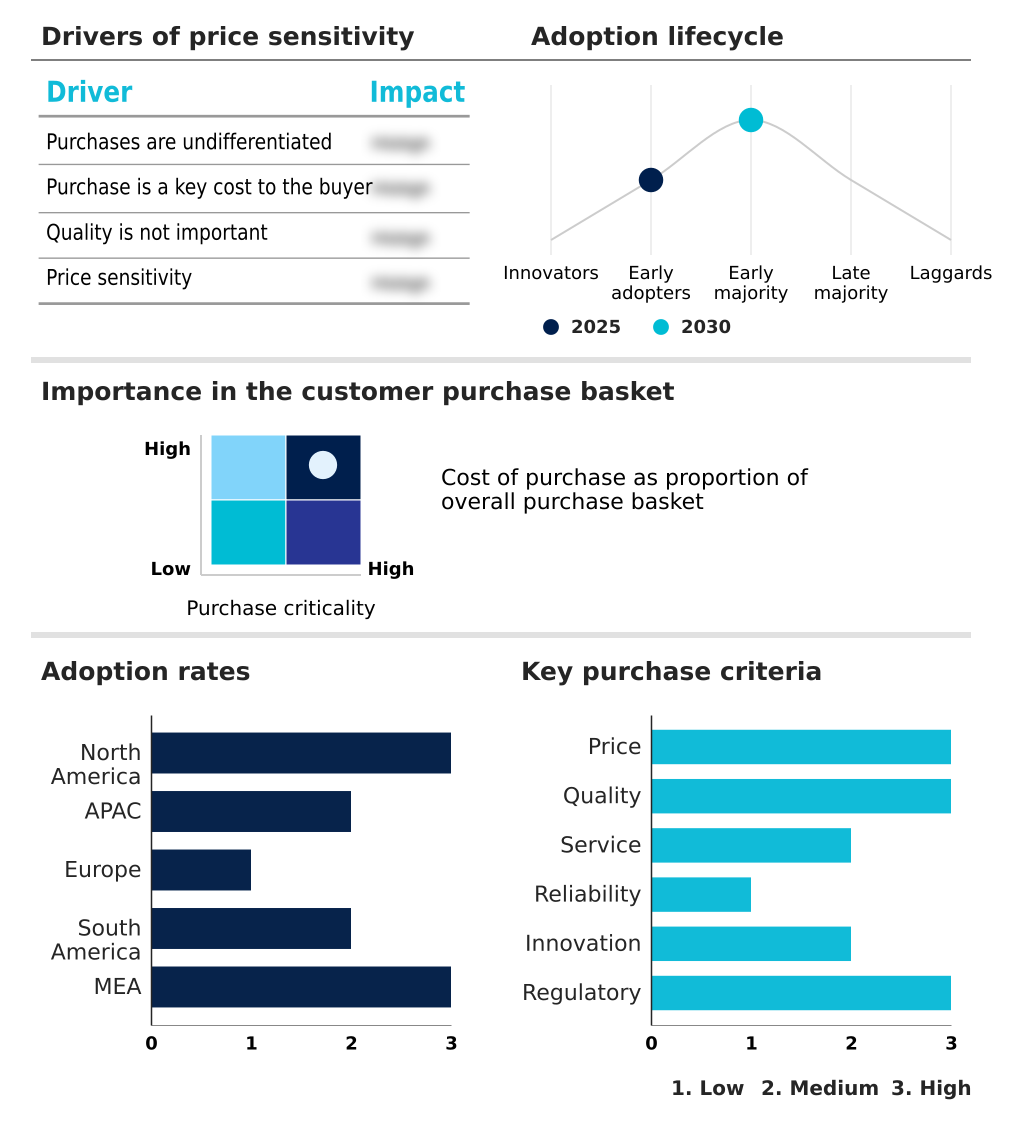
Customer Landscape of Alternative Finance Industry

Competitive Landscape

Companies are implementing various strategies, such as strategic alliances, alternative finance market forecast, partnerships, mergers and acquisitions, geographical expansion, and product/service launches, to enhance their presence in the industry.

AngelList Holdings LLC - The platform provides decentralized syndicated investment structures, rolling funds, and venture financing solutions, enabling startups to secure early-stage capital while democratizing investor access to high-growth private equity assets.

The industry research and growth report includes detailed analyses of the competitive landscape of the market and information about key companies, including:

  • AngelList Holdings LLC
  • Apollo Asset Management Inc.
  • Ares Management LLC
  • Avant LLC
  • BlackRock Inc.
  • Capify
  • Clear Finance Technology Corp
  • Credibly
  • Crowdcube Ltd.
  • Funding Circle Holdings Plc
  • Fundrise LLC
  • KKR and Co. Inc.
  • LendingClub Corp.
  • On Deck Capital Inc.
  • Prosper Marketplace Inc.
  • Republic
  • Seedrs Ltd.
  • SoFi Technologies Inc.
  • The Carlyle Group Inc.
  • Upstart Network Inc.
  • Wayflyer Ltd.

Qualitative and quantitative analysis of companies has been conducted to help clients understand the wider business environment as well as the strengths and weaknesses of key industry players. Data is qualitatively analyzed to categorize companies as pure play, category-focused, industry-focused, and diversified; it is quantitatively analyzed to categorize companies as dominant, leading, strong, tentative, and weak.

Recent Development and News in Alternative finance market

  • In the Diversified Financial Services industry, the transition toward open API standards has mandated data sharing, directly impacting Alternative Finance demand by enabling peer-to-peer lending networks to utilize behavioral data trails for enhanced automated underwriting, resulting in a 40% reduction in origination friction.
  • The rapid institutionalization of structured credit products has shifted large-scale capital allocation strategies, driving asset managers to seek yield-bearing asset classes outside public equities, which accelerates the expansion of digital lending platforms and provides critical liquidity for non-traditional debt portfolios.
  • The deployment of advanced anti-money laundering controls across global clearinghouses has increased compliance costs for traditional banks by over 30%, pushing underbanked corporate clients toward modern digital applications and revenue-based financing models for seamless capital distribution.
  • The systemic shift toward multi-chain financial ecosystems has optimized digital transactions, directly facilitating asset-backed lending efficiency by offering global retail investors frictionless exposure without traditional intermediary delays.

Dive into Technavio’s robust research methodology, blending expert interviews, extensive data synthesis, and validated models for unparalleled Alternative Finance Market insights. See full methodology.

Market Scope
Page number 290
Base year 2025
Historic period 2020-2024
Forecast period 2026-2030
Growth momentum & CAGR Accelerate at a CAGR of 7.3%
Market growth 2026-2030 USD 70971.1 million
Market structure Fragmented
YoY growth 2025-2026(%) 7.0%
Key countries US, Canada, Mexico, China, Japan, India, South Korea, Australia, Indonesia, Germany, UK, France, Italy, Spain, The Netherlands, Brazil, Argentina, Chile, Saudi Arabia, UAE, South Africa, Israel and Turkey
Competitive landscape Leading Companies, Market Positioning of Companies, Competitive Strategies, and Industry Risks

Request Free Sample

Research Analyst Overview

  • The Alternative Finance ecosystem is undergoing a profound institutionalization, transitioning from fragmented retail networks into sophisticated, algorithmic credit engines. This structural maturation is driven by the rapid adoption of decentralized digital ledgers, which systematically eliminate middle-tier origination friction. By utilizing advanced asset value financing models, corporate treasurers optimize debt profiles and bypass traditional banking bottlenecks.
  • Platforms deploying continuous funding architectures now offer unprecedented capital flexibility, allowing asset managers to secure predictable yields amidst macroeconomic volatility. Furthermore, the strategic integration of predictive risk systems allows lending institutions to continuously ingest unstructured data, identifying distress signals 30% faster than legacy credit bureau evaluations.
  • This shift toward autonomous compliance and real-time commerce data fundamentally redefines strategic product pricing and risk distribution. As institutional liquidity deepens, the reliance on automated underwriting ensures that the decentralized credit landscape remains highly resilient, permanently altering the competitive dynamics of global corporate capital allocation.

What are the Key Data Covered in this Alternative Finance Market Research and Growth Report?

  • What is the expected growth of the Alternative Finance Market between 2026 and 2030?

    • USD 70.97 billion, at a CAGR of 7.3%

  • What segmentation does the market report cover?

    • The report is segmented by Type (P2P lending, Crowdfunding, and Invoice trading), End-user (Individual, and Organization), Platform (Balance sheet lenders, P2P portals, and Blockchain and AI driven platforms) and Geography (North America, APAC, Europe, South America, Middle East and Africa)

  • Which regions are analyzed in the report?

    • North America, APAC, Europe, South America and Middle East and Africa

  • What are the key growth drivers and market challenges?

    • Widening SMEs credit gap and traditional banking restrictions, Regulatory fragmentation and compliance cost burdens across jurisdictions

  • Who are the major players in the Alternative Finance Market?

    • AngelList Holdings LLC, Apollo Asset Management Inc., Ares Management LLC, Avant LLC, BlackRock Inc., Capify, Clear Finance Technology Corp, Credibly, Crowdcube Ltd., Funding Circle Holdings Plc, Fundrise LLC, KKR and Co. Inc., LendingClub Corp., On Deck Capital Inc., Prosper Marketplace Inc., Republic, Seedrs Ltd., SoFi Technologies Inc., The Carlyle Group Inc., Upstart Network Inc. and Wayflyer Ltd.

Market Research Insights

  • The Alternative Finance sector is rapidly transforming corporate capital distribution through sophisticated digital architectures. By leveraging robust lending networks, small enterprises bypass traditional banking friction to secure vital working capital. Incorporating digital invoice factoring directly into commercial workflows has accelerated cash conversion cycles by 28% for global supply chains.
  • Additionally, the strategic deployment of equity crowdfunding portals enables early-stage companies to lower capital acquisition costs by up to 22% compared to standard venture capital solicitation. Utilizing comprehensive digital histories allows these platforms to accurately assess risk, granting underserved demographics unprecedented access to flexible, high-yield liquidity solutions.

We can help! Our analysts can customize this alternative finance market research report to meet your requirements.

Get in touch

1. Executive Summary

1.1 Market overview

Executive Summary - Chart on Market Overview
Executive Summary - Data Table on Market Overview
Executive Summary - Chart on Global Market Characteristics
Executive Summary - Chart on Market by Geography
Executive Summary - Chart on Market Segmentation by Type
Executive Summary - Chart on Market Segmentation by End-user
Executive Summary - Chart on Market Segmentation by Platform
Executive Summary - Chart on Incremental Growth
Executive Summary - Data Table on Incremental Growth
Executive Summary - Chart on Company Market Positioning

2. Technavio Analysis

2.1 Analysis of price sensitivity, lifecycle, customer purchase basket, adoption rates, and purchase criteria

2.2 Criticality of inputs and Factors of differentiation

Chart on Overview on criticality of inputs and factors of differentiation

2.3 Factors of disruption

Chart on Overview on factors of disruption

2.4 Impact of drivers and challenges

Chart on Impact of drivers and challenges in 2025 and 2030

3. Market Landscape

3.1 Market ecosystem

Chart on Parent Market
Data Table on - Parent Market

3.2 Market characteristics

Chart on Market characteristics analysis

3.3 Value chain analysis

Chart on Value chain analysis

4. Market Sizing

4.1 Market definition

Data Table on Offerings of companies included in the market definition

4.2 Market segment analysis

Market segments

4.3 Market size 2025

4.4 Market outlook: Forecast for 2025-2030

Chart on Global - Market size and forecast 2025-2030 ($ million)
Data Table on Global - Market size and forecast 2025-2030 ($ million)
Chart on Global Market: Year-over-year growth 2025-2030 (%)
Data Table on Global Market: Year-over-year growth 2025-2030 (%)

5. Historic Market Size

5.1 Global Alternative Finance Market 2020 - 2024

Historic Market Size - Data Table on Global Alternative Finance Market 2020 - 2024 ($ million)

5.2 Type segment analysis 2020 - 2024

Historic Market Size - Type Segment 2020 - 2024 ($ million)

5.3 End-user segment analysis 2020 - 2024

Historic Market Size - End-user Segment 2020 - 2024 ($ million)

5.4 Platform segment analysis 2020 - 2024

Historic Market Size - Platform Segment 2020 - 2024 ($ million)

5.5 Geography segment analysis 2020 - 2024

Historic Market Size - Geography Segment 2020 - 2024 ($ million)

5.6 Country segment analysis 2020 - 2024

Historic Market Size - Country Segment 2020 - 2024 ($ million)

6. Qualitative Analysis

6.1 Impact of AI on global alternative finance market

6.2 Impact of geopolitical conflicts on global alternative finance market

7. Five Forces Analysis

7.1 Five forces summary

Five forces analysis - Comparison between 2025 and 2030

7.2 Bargaining power of buyers

Bargaining power of buyers - Impact of key factors 2025 and 2030

7.3 Bargaining power of suppliers

Bargaining power of suppliers - Impact of key factors in 2025 and 2030

7.4 Threat of new entrants

Threat of new entrants - Impact of key factors in 2025 and 2030

7.5 Threat of substitutes

Threat of substitutes - Impact of key factors in 2025 and 2030

7.6 Threat of rivalry

Threat of rivalry - Impact of key factors in 2025 and 2030

7.7 Market condition

Chart on Market condition - Five forces 2025 and 2030

8. Market Segmentation by Type

8.1 Market segments

Chart on Type - Market share 2025-2030 (%)
Data Table on Type - Market share 2025-2030 (%)

8.2 Comparison by Type

Chart on Comparison by Type
Data Table on Comparison by Type

8.3 P2P lending - Market size and forecast 2025-2030

Chart on P2P lending - Market size and forecast 2025-2030 ($ million)
Data Table on P2P lending - Market size and forecast 2025-2030 ($ million)
Chart on P2P lending - Year-over-year growth 2025-2030 (%)
Data Table on P2P lending - Year-over-year growth 2025-2030 (%)

8.4 Crowdfunding - Market size and forecast 2025-2030

Chart on Crowdfunding - Market size and forecast 2025-2030 ($ million)
Data Table on Crowdfunding - Market size and forecast 2025-2030 ($ million)
Chart on Crowdfunding - Year-over-year growth 2025-2030 (%)
Data Table on Crowdfunding - Year-over-year growth 2025-2030 (%)

8.5 Invoice trading - Market size and forecast 2025-2030

Chart on Invoice trading - Market size and forecast 2025-2030 ($ million)
Data Table on Invoice trading - Market size and forecast 2025-2030 ($ million)
Chart on Invoice trading - Year-over-year growth 2025-2030 (%)
Data Table on Invoice trading - Year-over-year growth 2025-2030 (%)

8.6 Market opportunity by Type

Market opportunity by Type ($ million)
Data Table on Market opportunity by Type ($ million)

9. Market Segmentation by End-user

9.1 Market segments

Chart on End-user - Market share 2025-2030 (%)
Data Table on End-user - Market share 2025-2030 (%)

9.2 Comparison by End-user

Chart on Comparison by End-user
Data Table on Comparison by End-user

9.3 Individual - Market size and forecast 2025-2030

Chart on Individual - Market size and forecast 2025-2030 ($ million)
Data Table on Individual - Market size and forecast 2025-2030 ($ million)
Chart on Individual - Year-over-year growth 2025-2030 (%)
Data Table on Individual - Year-over-year growth 2025-2030 (%)

9.4 Organization - Market size and forecast 2025-2030

Chart on Organization - Market size and forecast 2025-2030 ($ million)
Data Table on Organization - Market size and forecast 2025-2030 ($ million)
Chart on Organization - Year-over-year growth 2025-2030 (%)
Data Table on Organization - Year-over-year growth 2025-2030 (%)

9.5 Market opportunity by End-user

Market opportunity by End-user ($ million)
Data Table on Market opportunity by End-user ($ million)

10. Market Segmentation by Platform

10.1 Market segments

Chart on Platform - Market share 2025-2030 (%)
Data Table on Platform - Market share 2025-2030 (%)

10.2 Comparison by Platform

Chart on Comparison by Platform
Data Table on Comparison by Platform

10.3 Balance sheet lenders - Market size and forecast 2025-2030

Chart on Balance sheet lenders - Market size and forecast 2025-2030 ($ million)
Data Table on Balance sheet lenders - Market size and forecast 2025-2030 ($ million)
Chart on Balance sheet lenders - Year-over-year growth 2025-2030 (%)
Data Table on Balance sheet lenders - Year-over-year growth 2025-2030 (%)

10.4 P2P portals - Market size and forecast 2025-2030

Chart on P2P portals - Market size and forecast 2025-2030 ($ million)
Data Table on P2P portals - Market size and forecast 2025-2030 ($ million)
Chart on P2P portals - Year-over-year growth 2025-2030 (%)
Data Table on P2P portals - Year-over-year growth 2025-2030 (%)

10.5 Blockchain and AI driven platforms - Market size and forecast 2025-2030

Chart on Blockchain and AI driven platforms - Market size and forecast 2025-2030 ($ million)
Data Table on Blockchain and AI driven platforms - Market size and forecast 2025-2030 ($ million)
Chart on Blockchain and AI driven platforms - Year-over-year growth 2025-2030 (%)
Data Table on Blockchain and AI driven platforms - Year-over-year growth 2025-2030 (%)

10.6 Market opportunity by Platform

Market opportunity by Platform ($ million)
Data Table on Market opportunity by Platform ($ million)

11. Customer Landscape

11.1 Customer landscape overview

Analysis of price sensitivity, lifecycle, customer purchase basket, adoption rates, and purchase criteria

12. Geographic Landscape

12.1 Geographic segmentation

Chart on Market share by geography 2025-2030 (%)
Data Table on Market share by geography 2025-2030 (%)

12.2 Geographic comparison

Chart on Geographic comparison
Data Table on Geographic comparison

12.3 North America - Market size and forecast 2025-2030

Chart on North America - Market size and forecast 2025-2030 ($ million)
Data Table on North America - Market size and forecast 2025-2030 ($ million)
Chart on North America - Year-over-year growth 2025-2030 (%)
Data Table on North America - Year-over-year growth 2025-2030 (%)
Chart on Regional Comparison - North America
Data Table on Regional Comparison - North America

12.3.1 US - Market size and forecast 2025-2030

Chart on US - Market size and forecast 2025-2030 ($ million)
Data Table on US - Market size and forecast 2025-2030 ($ million)
Chart on US - Year-over-year growth 2025-2030 (%)
Data Table on US - Year-over-year growth 2025-2030 (%)

12.3.2 Canada - Market size and forecast 2025-2030

Chart on Canada - Market size and forecast 2025-2030 ($ million)
Data Table on Canada - Market size and forecast 2025-2030 ($ million)
Chart on Canada - Year-over-year growth 2025-2030 (%)
Data Table on Canada - Year-over-year growth 2025-2030 (%)

12.3.3 Mexico - Market size and forecast 2025-2030

Chart on Mexico - Market size and forecast 2025-2030 ($ million)
Data Table on Mexico - Market size and forecast 2025-2030 ($ million)
Chart on Mexico - Year-over-year growth 2025-2030 (%)
Data Table on Mexico - Year-over-year growth 2025-2030 (%)

12.4 APAC - Market size and forecast 2025-2030

Chart on APAC - Market size and forecast 2025-2030 ($ million)
Data Table on APAC - Market size and forecast 2025-2030 ($ million)
Chart on APAC - Year-over-year growth 2025-2030 (%)
Data Table on APAC - Year-over-year growth 2025-2030 (%)
Chart on Regional Comparison - APAC
Data Table on Regional Comparison - APAC

12.4.1 China - Market size and forecast 2025-2030

Chart on China - Market size and forecast 2025-2030 ($ million)
Data Table on China - Market size and forecast 2025-2030 ($ million)
Chart on China - Year-over-year growth 2025-2030 (%)
Data Table on China - Year-over-year growth 2025-2030 (%)

12.4.2 Japan - Market size and forecast 2025-2030

Chart on Japan - Market size and forecast 2025-2030 ($ million)
Data Table on Japan - Market size and forecast 2025-2030 ($ million)
Chart on Japan - Year-over-year growth 2025-2030 (%)
Data Table on Japan - Year-over-year growth 2025-2030 (%)

12.4.3 India - Market size and forecast 2025-2030

Chart on India - Market size and forecast 2025-2030 ($ million)
Data Table on India - Market size and forecast 2025-2030 ($ million)
Chart on India - Year-over-year growth 2025-2030 (%)
Data Table on India - Year-over-year growth 2025-2030 (%)

12.4.4 South Korea - Market size and forecast 2025-2030

Chart on South Korea - Market size and forecast 2025-2030 ($ million)
Data Table on South Korea - Market size and forecast 2025-2030 ($ million)
Chart on South Korea - Year-over-year growth 2025-2030 (%)
Data Table on South Korea - Year-over-year growth 2025-2030 (%)

12.4.5 Australia - Market size and forecast 2025-2030

Chart on Australia - Market size and forecast 2025-2030 ($ million)
Data Table on Australia - Market size and forecast 2025-2030 ($ million)
Chart on Australia - Year-over-year growth 2025-2030 (%)
Data Table on Australia - Year-over-year growth 2025-2030 (%)

12.4.6 Indonesia - Market size and forecast 2025-2030

Chart on Indonesia - Market size and forecast 2025-2030 ($ million)
Data Table on Indonesia - Market size and forecast 2025-2030 ($ million)
Chart on Indonesia - Year-over-year growth 2025-2030 (%)
Data Table on Indonesia - Year-over-year growth 2025-2030 (%)

12.5 Europe - Market size and forecast 2025-2030

Chart on Europe - Market size and forecast 2025-2030 ($ million)
Data Table on Europe - Market size and forecast 2025-2030 ($ million)
Chart on Europe - Year-over-year growth 2025-2030 (%)
Data Table on Europe - Year-over-year growth 2025-2030 (%)
Chart on Regional Comparison - Europe
Data Table on Regional Comparison - Europe

12.5.1 Germany - Market size and forecast 2025-2030

Chart on Germany - Market size and forecast 2025-2030 ($ million)
Data Table on Germany - Market size and forecast 2025-2030 ($ million)
Chart on Germany - Year-over-year growth 2025-2030 (%)
Data Table on Germany - Year-over-year growth 2025-2030 (%)

12.5.2 UK - Market size and forecast 2025-2030

Chart on UK - Market size and forecast 2025-2030 ($ million)
Data Table on UK - Market size and forecast 2025-2030 ($ million)
Chart on UK - Year-over-year growth 2025-2030 (%)
Data Table on UK - Year-over-year growth 2025-2030 (%)

12.5.3 France - Market size and forecast 2025-2030

Chart on France - Market size and forecast 2025-2030 ($ million)
Data Table on France - Market size and forecast 2025-2030 ($ million)
Chart on France - Year-over-year growth 2025-2030 (%)
Data Table on France - Year-over-year growth 2025-2030 (%)

12.5.4 Italy - Market size and forecast 2025-2030

Chart on Italy - Market size and forecast 2025-2030 ($ million)
Data Table on Italy - Market size and forecast 2025-2030 ($ million)
Chart on Italy - Year-over-year growth 2025-2030 (%)
Data Table on Italy - Year-over-year growth 2025-2030 (%)

12.5.5 Spain - Market size and forecast 2025-2030

Chart on Spain - Market size and forecast 2025-2030 ($ million)
Data Table on Spain - Market size and forecast 2025-2030 ($ million)
Chart on Spain - Year-over-year growth 2025-2030 (%)
Data Table on Spain - Year-over-year growth 2025-2030 (%)

12.5.6 The Netherlands - Market size and forecast 2025-2030

Chart on The Netherlands - Market size and forecast 2025-2030 ($ million)
Data Table on The Netherlands - Market size and forecast 2025-2030 ($ million)
Chart on The Netherlands - Year-over-year growth 2025-2030 (%)
Data Table on The Netherlands - Year-over-year growth 2025-2030 (%)

12.6 South America - Market size and forecast 2025-2030

Chart on South America - Market size and forecast 2025-2030 ($ million)
Data Table on South America - Market size and forecast 2025-2030 ($ million)
Chart on South America - Year-over-year growth 2025-2030 (%)
Data Table on South America - Year-over-year growth 2025-2030 (%)
Chart on Regional Comparison - South America
Data Table on Regional Comparison - South America

12.6.1 Brazil - Market size and forecast 2025-2030

Chart on Brazil - Market size and forecast 2025-2030 ($ million)
Data Table on Brazil - Market size and forecast 2025-2030 ($ million)
Chart on Brazil - Year-over-year growth 2025-2030 (%)
Data Table on Brazil - Year-over-year growth 2025-2030 (%)

12.6.2 Argentina - Market size and forecast 2025-2030

Chart on Argentina - Market size and forecast 2025-2030 ($ million)
Data Table on Argentina - Market size and forecast 2025-2030 ($ million)
Chart on Argentina - Year-over-year growth 2025-2030 (%)
Data Table on Argentina - Year-over-year growth 2025-2030 (%)

12.6.3 Chile - Market size and forecast 2025-2030

Chart on Chile - Market size and forecast 2025-2030 ($ million)
Data Table on Chile - Market size and forecast 2025-2030 ($ million)
Chart on Chile - Year-over-year growth 2025-2030 (%)
Data Table on Chile - Year-over-year growth 2025-2030 (%)

12.7 Middle East and Africa - Market size and forecast 2025-2030

Chart on Middle East and Africa - Market size and forecast 2025-2030 ($ million)
Data Table on Middle East and Africa - Market size and forecast 2025-2030 ($ million)
Chart on Middle East and Africa - Year-over-year growth 2025-2030 (%)
Data Table on Middle East and Africa - Year-over-year growth 2025-2030 (%)
Chart on Regional Comparison - Middle East and Africa
Data Table on Regional Comparison - Middle East and Africa

12.7.1 Saudi Arabia - Market size and forecast 2025-2030

Chart on Saudi Arabia - Market size and forecast 2025-2030 ($ million)
Data Table on Saudi Arabia - Market size and forecast 2025-2030 ($ million)
Chart on Saudi Arabia - Year-over-year growth 2025-2030 (%)
Data Table on Saudi Arabia - Year-over-year growth 2025-2030 (%)

12.7.2 UAE - Market size and forecast 2025-2030

Chart on UAE - Market size and forecast 2025-2030 ($ million)
Data Table on UAE - Market size and forecast 2025-2030 ($ million)
Chart on UAE - Year-over-year growth 2025-2030 (%)
Data Table on UAE - Year-over-year growth 2025-2030 (%)

12.7.3 South Africa - Market size and forecast 2025-2030

Chart on South Africa - Market size and forecast 2025-2030 ($ million)
Data Table on South Africa - Market size and forecast 2025-2030 ($ million)
Chart on South Africa - Year-over-year growth 2025-2030 (%)
Data Table on South Africa - Year-over-year growth 2025-2030 (%)

12.7.4 Israel - Market size and forecast 2025-2030

Chart on Israel - Market size and forecast 2025-2030 ($ million)
Data Table on Israel - Market size and forecast 2025-2030 ($ million)
Chart on Israel - Year-over-year growth 2025-2030 (%)
Data Table on Israel - Year-over-year growth 2025-2030 (%)

12.7.5 Turkey - Market size and forecast 2025-2030

Chart on Turkey - Market size and forecast 2025-2030 ($ million)
Data Table on Turkey - Market size and forecast 2025-2030 ($ million)
Chart on Turkey - Year-over-year growth 2025-2030 (%)
Data Table on Turkey - Year-over-year growth 2025-2030 (%)

12.8 Market opportunity by geography

Market opportunity by geography ($ million)
Data Tables on Market opportunity by geography ($ million)

13. Drivers, Challenges, and Opportunity

13.1 Market drivers

Widening SMEs credit gap and traditional banking restrictions
Technological proliferation and institutionalization of alternative credit assessment
Surging demand for decentralized finance and real-world asset tokenization

13.2 Market challenges

Regulatory fragmentation and compliance cost burdens across jurisdictions
Systemic cybersecurity vulnerabilities and interconnected third-party API risks
Liquidity volatility and macroeconomic contraction within alternative credit industries

13.3 Impact of drivers and challenges

Impact of drivers and challenges in 2025 and 2030

13.4 Market opportunities

Accelerated penetration of embeddable financial infrastructures and non-financial platforms
Emergence of intelligent risk engines and automated compliance frameworks
Institutionalization and proliferation of private credit and hybrid structural vehicles

14. Competitive Landscape

14.1 Overview

14.2

Overview on criticality of inputs and factors of differentiation

14.3 Landscape disruption

Overview on factors of disruption

14.4 Industry risks

Impact of key risks on business

15. Competitive Analysis

15.1 Companies profiled

Companies covered

15.2 Company ranking index

15.3 Market positioning of companies

Matrix on companies position and classification

15.4 AngelList Holdings LLC

AngelList Holdings LLC - Overview
AngelList Holdings LLC - Product / Service
AngelList Holdings LLC - Key offerings
SWOT

15.5 Apollo Asset Management Inc.

Apollo Asset Management Inc. - Overview
Apollo Asset Management Inc. - Business segments
Apollo Asset Management Inc. - Key offerings
Apollo Asset Management Inc. - Segment focus
SWOT

15.6 Ares Management LLC

Ares Management LLC - Overview
Ares Management LLC - Business segments
Ares Management LLC - Key offerings
Ares Management LLC - Segment focus
SWOT

15.7 BlackRock Inc.

BlackRock Inc. - Overview
BlackRock Inc. - Product / Service
BlackRock Inc. - Key offerings
SWOT

15.8 Clear Finance Technology Corp

Clear Finance Technology Corp - Overview
Clear Finance Technology Corp - Product / Service
Clear Finance Technology Corp - Key offerings
SWOT

15.9 Funding Circle Holdings Plc

Funding Circle Holdings Plc - Overview
Funding Circle Holdings Plc - Product / Service
Funding Circle Holdings Plc - Key offerings
SWOT

15.10 Fundrise LLC

Fundrise LLC - Overview
Fundrise LLC - Product / Service
Fundrise LLC - Key offerings
SWOT

15.11 KKR and Co. Inc.

KKR and Co. Inc. - Overview
KKR and Co. Inc. - Business segments
KKR and Co. Inc. - Key offerings
KKR and Co. Inc. - Segment focus
SWOT

15.12 LendingClub Corp.

LendingClub Corp. - Overview
LendingClub Corp. - Product / Service
LendingClub Corp. - Key offerings
SWOT

15.13 On Deck Capital Inc.

On Deck Capital Inc. - Overview
On Deck Capital Inc. - Product / Service
On Deck Capital Inc. - Key offerings
SWOT

15.14 Prosper Marketplace Inc.

Prosper Marketplace Inc. - Overview
Prosper Marketplace Inc. - Product / Service
Prosper Marketplace Inc. - Key offerings
SWOT

15.15 Seedrs Ltd.

Seedrs Ltd. - Overview
Seedrs Ltd. - Product / Service
Seedrs Ltd. - Key offerings
SWOT

15.16 SoFi Technologies Inc.

SoFi Technologies Inc. - Overview
SoFi Technologies Inc. - Business segments
SoFi Technologies Inc. - Key offerings
SoFi Technologies Inc. - Segment focus
SWOT

15.17 The Carlyle Group Inc.

The Carlyle Group Inc. - Overview
The Carlyle Group Inc. - Business segments
The Carlyle Group Inc. - Key offerings
The Carlyle Group Inc. - Segment focus
SWOT

15.18 Upstart Network Inc.

Upstart Network Inc. - Overview
Upstart Network Inc. - Product / Service
Upstart Network Inc. - Key offerings
SWOT

16. Appendix

16.1 Scope of the report

Market definition
Objectives
Notes and caveats

16.2 Inclusions and exclusions checklist

Inclusions checklist
Exclusions checklist

16.3 Currency conversion rates for US$

16.4 Research methodology

16.5 Data procurement

Information sources

16.6 Data validation

16.7 Validation techniques employed for market sizing

16.8 Data synthesis

16.9 360 degree market analysis

16.10 List of abbreviations

Research Methodology

Technavio presents a detailed picture of the market by way of study, synthesis, and summation of data from multiple sources. The analysts have presented the various facets of the market with a particular focus on identifying the key industry influencers. The data thus presented is comprehensive, reliable, and the result of extensive research, both primary and secondary.

INFORMATION SOURCES

Primary sources

  • Manufacturers and suppliers
  • Channel partners
  • Industry experts
  • Strategic decision makers

Secondary sources

  • Industry journals and periodicals
  • Government data
  • Financial reports of key industry players
  • Historical data
  • Press releases

DATA ANALYSIS

Data Synthesis

  • Collation of data
  • Estimation of key figures
  • Analysis of derived insights

Data Validation

  • Triangulation with data models
  • Reference against proprietary databases
  • Corroboration with industry experts

REPORT WRITING

Qualitative

  • Market drivers
  • Market challenges
  • Market trends
  • Five forces analysis

Quantitative

  • Market size and forecast
  • Market segmentation
  • Geographical insights
  • Competitive landscape

Interested in this report?

Get your sample now to see our research methodology and insights!

Download Now

Frequently Asked Questions

Alternative Finance market growth will increase by USD 70971.1 million during 2026-2030.

The Alternative Finance market is expected to grow at a CAGR of 7.3% during 2026-2030.

Alternative Finance market is segmented by Type (P2P lending, Crowdfunding, Invoice trading) End-user (Individual, Organization) Platform (Balance sheet lenders, P2P portals, Blockchain and AI driven platforms)

AngelList Holdings LLC, Apollo Asset Management Inc., Ares Management LLC, Avant LLC, BlackRock Inc., Capify, Clear Finance Technology Corp, Credibly, Crowdcube Ltd., Funding Circle Holdings Plc, Fundrise LLC, KKR and Co. Inc., LendingClub Corp., On Deck Capital Inc., Prosper Marketplace Inc., Republic, Seedrs Ltd., SoFi Technologies Inc., The Carlyle Group Inc., Upstart Network Inc., Wayflyer Ltd. are a few of the key vendors in the Alternative Finance market.

North America will register the highest growth rate of 67.7% among the other regions. Therefore, the Alternative Finance market in North America is expected to garner significant business opportunities for the vendors during the forecast period.

US, Canada, Mexico, China, Japan, India, South Korea, Australia, Indonesia, Germany, UK, France, Italy, Spain, The Netherlands, Brazil, Argentina, Chile, Saudi Arabia, UAE, South Africa, Israel, Turkey

  • Widening SMEs credit gap and traditional banking restrictions is the driving factor this market.

The Alternative Finance market vendors should focus on grabbing business opportunities from the Type segment as it accounted for the largest market share in the base year.
RIA - Research AI Assistant
Ask RIA
