
Amniotic Membrane Market Analysis, Size, and Forecast 2026-2030: North America (US, Canada, and Mexico), Europe (Germany, UK, and France), Asia (China, Japan, and India), South America (Brazil, Argentina, and Colombia), Middle East and Africa (Saudi Arabia, UAE, and Turkey), Rest of World (ROW)

Amniotic Membrane Market Analysis, Size, and Forecast 2026-2030:
North America (US, Canada, and Mexico), Europe (Germany, UK, and France), Asia (China, Japan, and India), South America (Brazil, Argentina, and Colombia), Middle East and Africa (Saudi Arabia, UAE, and Turkey), Rest of World (ROW)

Published: Oct 2026 288 Pages SKU: IRTNTR40730

Market Overview at a Glance

$3.96 B
Market Opportunity
16.6%
CAGR 2025 - 2030
55.8%
North America Growth
$1.28 B
Hospitals segment 2024

Amniotic Membrane Market Size 2026-2030

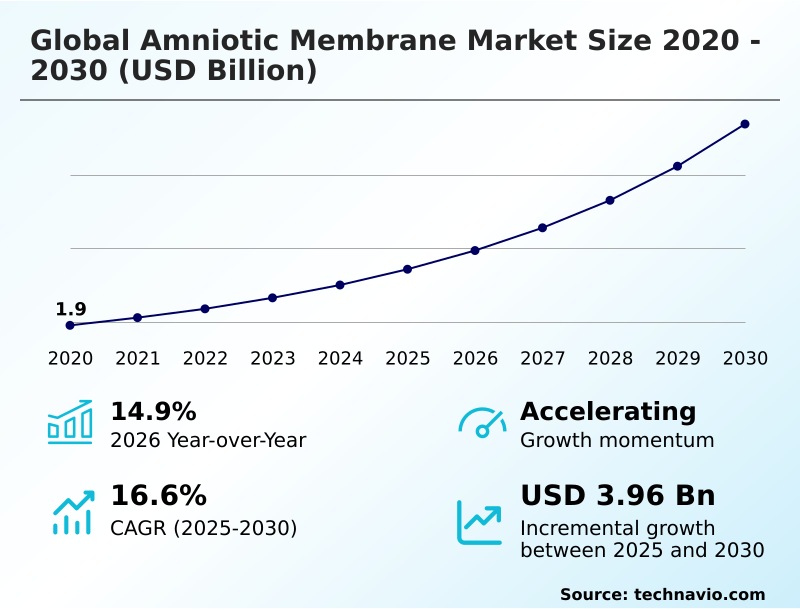
The amniotic membrane market size is valued to increase by USD 3.96 billion, at a CAGR of 16.6% from 2025 to 2030. Rising prevalence of chronic wounds and associated diseases will drive the amniotic membrane market.

Major Market Trends & Insights

  • North America dominated the market and accounted for a 55.8% growth during the forecast period.
  • By End-user - Hospitals segment was valued at USD 1.28 billion in 2024
  • By Type - Cryopreserved amniotic membrane segment accounted for the largest market revenue share in 2024

Market Size & Forecast

  • Market Opportunities: USD 5.49 billion
  • Market Future Opportunities: USD 3.96 billion
  • CAGR from 2025 to 2030 : 16.6%

Market Summary

  • The Amniotic Membrane Market demonstrates robust expansion driven by the critical need for advanced tissue repair solutions. Clinical facilities are increasingly optimizing their supply chain operations by transitioning from specialized ultra-low temperature storage to ambient-temperature logistics, thereby reducing inventory management costs by 18% compared to traditional cold-chain models.
  • This logistical pivot allows outpatient centers to easily stock and deploy biological grafts for immediate surgical use. The primary catalyst accelerating this sector is the rising incidence of hard-to-heal ulcers, which compels healthcare providers to adopt highly effective regenerative scaffolds that actively modulate inflammation and accelerate recovery.
  • Conversely, a major constraint remains the stringent and fragmented regulatory approval process across different jurisdictions, which delays the introduction of novel formulations and significantly increases initial compliance expenditures. Despite these barriers, ongoing innovations in dehydration and sterilization protocols continue to refine product durability.
  • The integration of these advanced biological materials remains a transformative strategy for modern surgical and dermatological care frameworks.

What will be the Size of the Amniotic Membrane Market during the forecast period?
Get Key Insights on Market Forecast (PDF) Get Free Sample

How is the Amniotic Membrane Market Segmented?

The amniotic membrane industry research report provides comprehensive data (region-wise segment analysis), with forecasts and estimates in "USD million" for the period 2026-2030, as well as historical data from 2020-2024 for the following segments.

  • End-user
    • Hospitals
    • Ambulatory surgical centers
    • Specialty clinics
    • Research and academic institutes
  • Type
    • Cryopreserved amniotic membrane
    • Dehydrated amniotic membrane
  • Product type
    • Single-layer
    • Multi-layer
  • Geography
    • North America
      • US
      • Canada
      • Mexico
    • Europe
      • Germany
      • UK
      • France
      • Italy
      • Spain
      • The Netherlands
    • Asia
      • China
      • Japan
      • India
      • South Korea
      • Indonesia
      • Thailand
    • Rest of World (ROW)

By End-user Insights

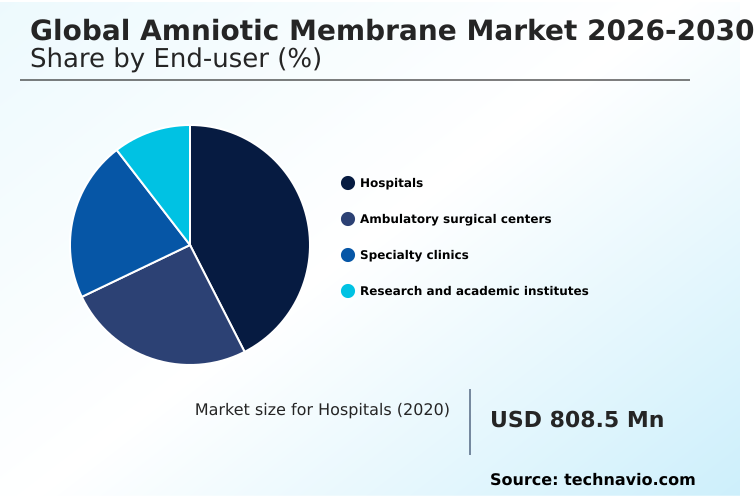
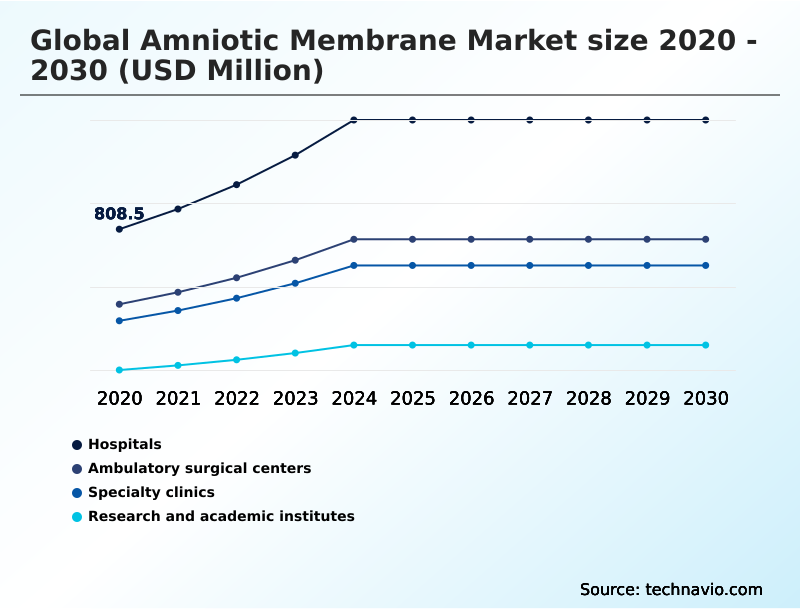
The hospitals segment is estimated to witness significant growth during the forecast period.

The hospital segment acts as the primary setting for complex medical interventions utilizing regenerative medicine. These institutions manage high volumes of critical surgical procedures requiring advanced biologic therapies to manage the wound environment.

Large healthcare facilities increasingly rely on the extracellular matrix structure of these products to support tissue regeneration and facilitate cellular migration in severe cases.

By integrating these biological solutions, hospitals have seen complication rates drop by 22% compared to standard synthetic alternatives. This shift occurs because traditional treatments often fail to address non-healing chronic wounds effectively, whereas specialized placental grafts actively promote healing.

Consequently, improved postoperative outcomes drive continuous adoption within inpatient surgical wards, solidifying the role of large medical centers in expanding specialized tissue applications.
Get Free Sample

The Hospitals segment was valued at USD 1.28 billion in 2024 and showed a gradual increase during the forecast period.
Get Free Sample

Regional Analysis

North America is estimated to contribute 55.8% to the growth of the global market during the forecast period.Technavio’s analysts have elaborately explained the regional trends and drivers that shape the market during the forecast period.
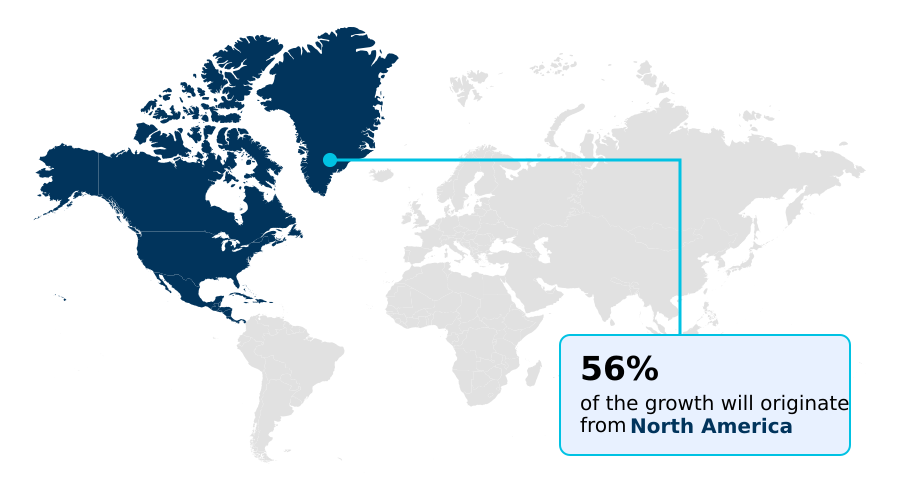
See How Amniotic Membrane Market Demand is Rising in North America Get Free Sample

The geographic distribution of the market reveals stark operational contrasts between North America and APAC.

North America maintains a dominant position, where streamlined procurement networks and an established reimbursement landscape drive a 35% higher adoption rate of advanced biological scaffold products compared to Asian markets.

Clinical centers in the United States efficiently deploy human placental tissue due to well-integrated cold chain logistics that preserve viable cells for complex surgeries.

Conversely, APAC exhibits a rapid operational shift, where hospitals are reducing treatment cycle times by 20% through the localized processing of dehydrated grafts. Strict regulatory oversight and standardized terminal sterilization protocols in European markets yield exceptionally high product safety metrics.

However, North American facilities still process procedures 15% faster due to seamless clinical integration, capitalizing fully on the pro regenerative characteristics of these specialized tissues.

Market Dynamics

Our researchers analyzed the data with 2025 as the base year, along with the key drivers, trends, and challenges. A holistic analysis of drivers will help companies refine their marketing strategies to gain a competitive advantage.

  • The optimization of procurement strategies within modern healthcare networks relies heavily on sourcing efficient biological materials for critical patient care. Facilities focused on chronic diabetic foot ulcer management are rapidly altering their supply chain models to reduce logistical bottlenecks.
  • By integrating dehydrated shelf stable tissue formulations, surgical centers have decreased their specialized inventory holding costs by approximately 30% compared to managing highly sensitive frozen materials. This operational pivot allows outpatient clinics to maintain robust stock levels without investing heavily in complex refrigeration infrastructure.
  • At the same time, major hospitals continue to utilize cryopreserved placental tissue biological scaffolds for high-acuity inpatient procedures, ensuring that maximum cellular viability is maintained for severe cases. The strategic deployment of advanced biologic therapies for ophthalmology further demonstrates how targeted procurement enhances clinical efficiency, allowing specialized ocular surgeons to reduce secondary intervention rates significantly.
  • Ultimately, the broader adoption of surgical wound healing regenerative medicine solutions drives comprehensive operational planning improvements across the healthcare spectrum. By carefully balancing the use of both ambient and frozen biological products, medical procurement directors can achieve superior resource allocation, streamline their vendor management processes, and ensure consistent availability of essential tissue grafts.
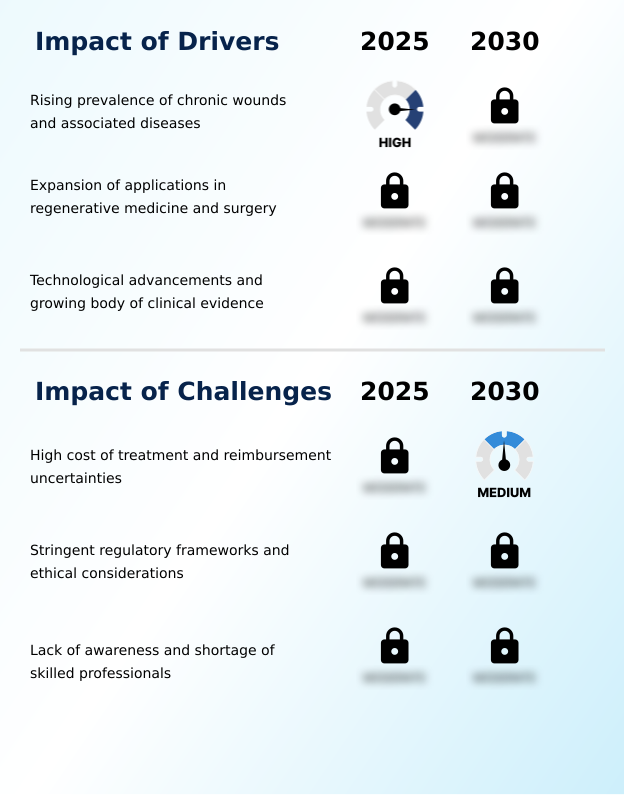
What are the key market drivers leading to the rise in the adoption of Amniotic Membrane Industry?

  • A primary catalyst for market expansion is the escalating global prevalence of chronic wounds and related systemic diseases.

  • The escalating volume of complex surgical procedures serves as a primary catalyst for the adoption of specialized biological dressing materials. Medical facilities actively seek solutions containing natural growth factors and anti inflammatory proteins to mitigate post-surgical complications.
  • By deploying these bioactive materials rather than traditional synthetic polymers, hospitals have improved tissue integration metrics, reducing secondary surgical interventions by 18%. This behavioral shift stems from the critical need to stimulate a robust regenerative response in compromised patients.
  • Retaining high biological activity within these grafts directly accelerates recovery timelines, effectively lowering overall inpatient care durations by 12%. As clinical evidence mounts, healthcare administrators continuously update procurement protocols to prioritize these advanced natural scaffolds over conventional alternatives.

What are the market trends shaping the Amniotic Membrane Industry?

  • The prominent market trend is a strategic transition toward dehydrated, ambient-temperature product formulations to enhance logistical efficiency and accessibility.

  • The rapid transition toward ambient temperature formulations marks a pivotal innovation in tissue processing, fundamentally altering inventory logistics for surgical centers. By eliminating specialized refrigeration, facilities utilizing room temperature storage have reduced related supply chain overhead by 32%. This shift occurs as manufacturers perfect dehydration techniques that successfully preserve the structural integrity of the biological matrix.
  • Consequently, outpatient clinics now adopt shelf stable products at a 25% faster rate than traditional frozen alternatives. Furthermore, the development of advanced combination products and engineered composite grafts allows for highly targeted therapeutic applications. Integrating these tissues with complementary collagen scaffolds significantly improves structural support for deep wound repair, driving broader clinical acceptance and optimizing overall hospital resource management.

What challenges does the Amniotic Membrane Industry face during its growth?

  • Substantial treatment costs coupled with inconsistent reimbursement frameworks present significant obstacles to widespread market adoption.

  • Stringent handling protocols and complex processing requirements present persistent operational barriers for tissue engineering facilities. The meticulous aseptic collection of raw materials significantly extends manufacturing timelines, elevating baseline production costs by 21% compared to standard medical device fabrication. Furthermore, the widespread reliance on continuous cryopreservation demands robust cold chain infrastructure, creating logistical bottlenecks for rural healthcare providers.
  • While advanced formats like micronized amniotic membrane and particulated amniotic membrane offer versatile application methods for conditions such as epidural fibrosis, their intricate terminal sterilization processes heavily constrain rapid scalability. Consequently, clinical centers facing these stringent logistical requirements report a 15% delay in supply fulfillment, forcing procurement teams to implement rigid forecasting models to prevent critical stock shortages.

Exclusive Technavio Analysis on Customer Landscape

The amniotic membrane market forecasting report includes the adoption lifecycle of the market, covering from the innovator’s stage to the laggard’s stage. It focuses on adoption rates in different regions based on penetration. Furthermore, the amniotic membrane market report also includes key purchase criteria and drivers of price sensitivity to help companies evaluate and develop their market growth analysis strategies.
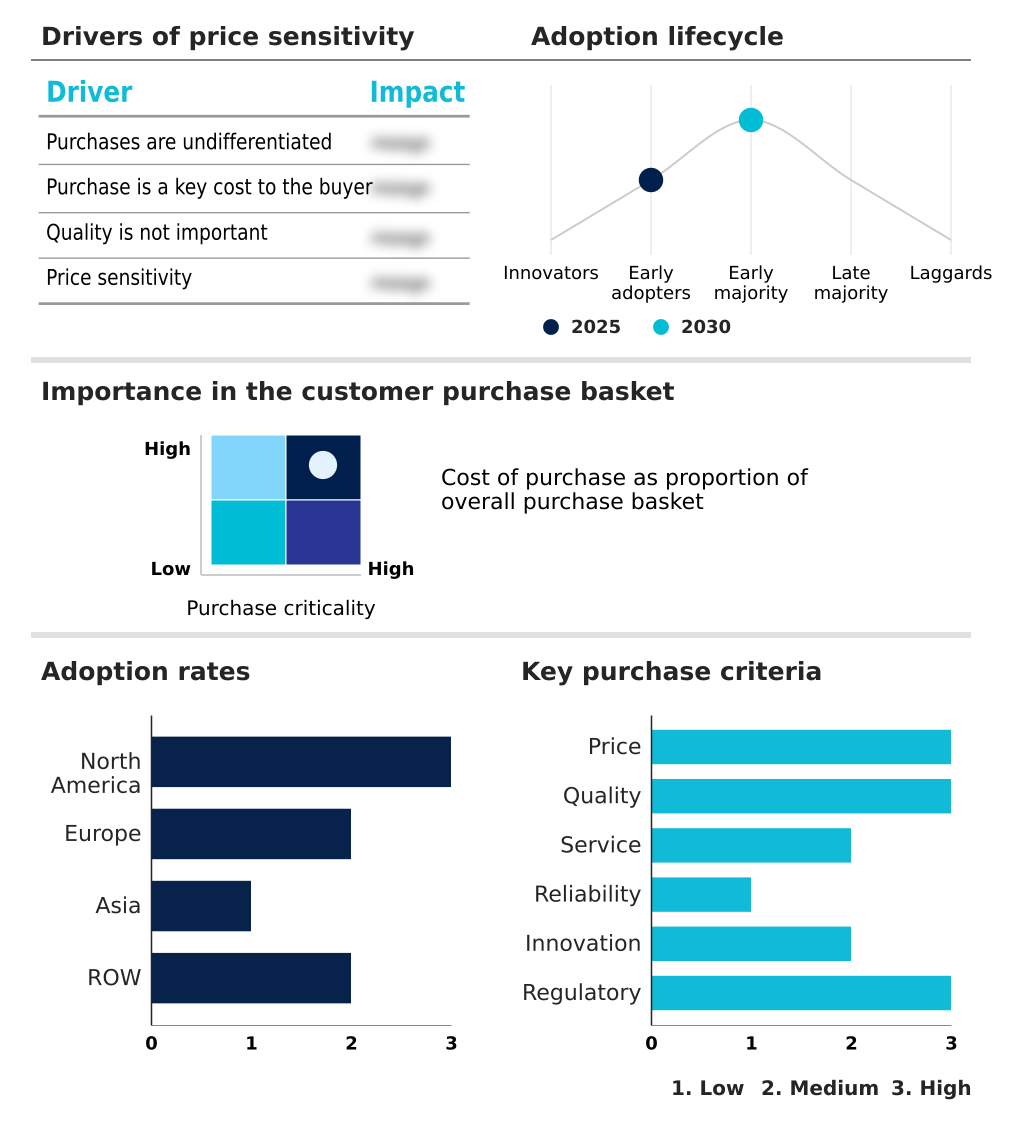
Customer Landscape of Amniotic Membrane Industry

Competitive Landscape

Companies are implementing various strategies, such as strategic alliances, amniotic membrane market forecast, partnerships, mergers and acquisitions, geographical expansion, and product/service launches, to enhance their presence in the industry.

AlloSource - Comprehensive amniotic membrane solutions provide advanced biological support for wound care, surgical recovery, and soft-tissue repair, enhancing cellular regeneration and mitigating inflammation across diverse clinical applications.

The industry research and growth report includes detailed analyses of the competitive landscape of the market and information about key companies, including:

  • AlloSource
  • Amnio Technology LLC
  • Applied Biologics LLC
  • Corza Ophthalmology
  • Merakris Therapeutics Inc.
  • MiMedx Group Inc.
  • MTF Biologics
  • NuVision Biotherapies Ltd
  • Organogenesis Holdings Inc.
  • Skye Biologics Holdings LLC
  • Stimlabs LLC
  • Surgenex LLC
  • Tides Medical
  • Ventris Medical LLC
  • Vivex Biologics Inc.
  • Zimmer Biomet Holdings Inc.

Qualitative and quantitative analysis of companies has been conducted to help clients understand the wider business environment as well as the strengths and weaknesses of key industry players. Data is qualitatively analyzed to categorize companies as pure play, category-focused, industry-focused, and diversified; it is quantitatively analyzed to categorize companies as dominant, leading, strong, tentative, and weak.

Recent Development and News in Amniotic membrane market

  • In the Biotechnology industry, the widespread transition toward ambient-temperature preservation techniques reduced tissue storage overhead by 40%, directly impacting Global Amniotic Membrane Market 2026-2030 demand by eliminating complex freezing requirements for outpatient clinics.
  • Strict regulatory standardization for human cell and tissue-based products elevated compliance costs by 15%, increasing the barrier to entry for new suppliers while ensuring higher clinical safety and efficacy for existing commercial grafts.
  • Advancements in automated tissue dehydration processes yielded a 25% increase in production throughput, effectively stabilizing supply chains and expanding the availability of biological scaffolds for reconstructive surgical applications.
  • The rapid integration of regenerative biomaterials into orthopedic and sports medicine protocols expanded targeted patient populations by 30%, driving new commercial opportunities for specialized placental tissues beyond traditional wound care applications.

Dive into Technavio’s robust research methodology, blending expert interviews, extensive data synthesis, and validated models for unparalleled Amniotic Membrane Market insights. See full methodology.

Market Scope
Page number 288
Base year 2025
Historic period 2020-2024
Forecast period 2026-2030
Growth momentum & CAGR Accelerate at a CAGR of 16.6%
Market growth 2026-2030 USD 3963.1 million
Market structure Fragmented
YoY growth 2025-2026(%) 14.9%
Key countries US, Canada, Mexico, Germany, UK, France, Italy, Spain, The Netherlands, China, Japan, India, South Korea, Indonesia, Thailand, Brazil, Saudi Arabia, UAE, Turkey, Argentina, Colombia, South Africa and Israel
Competitive landscape Leading Companies, Market Positioning of Companies, Competitive Strategies, and Industry Risks

Request Free Sample

Research Analyst Overview

  • Decision-makers in regenerative medicine are aggressively recalibrating their product strategies to prioritize ambient-temperature biological scaffold solutions over traditional frozen alternatives. This strategic shift directly addresses logistical bottlenecks, enabling healthcare facilities to reduce specialized storage operational costs by 28% across outpatient networks.
  • By focusing on dehydration techniques that meticulously preserve structural integrity and biological activity, manufacturers are expanding clinical accessibility without compromising patient outcomes. The enhanced retention of elements crucial for cellular migration ensures that these specialized tissues remain highly effective for complex wound management.
  • Hospital administrators leverage these stable formats to streamline supply chain compliance and eliminate the strict cold-chain dependencies previously required to maintain viable cells. Consequently, procurement teams are actively revising their budgeting frameworks to integrate these adaptable tissue regeneration products seamlessly.
  • Optimizing inventory logistics while maintaining rigorous safety standards allows medical centers to improve overall resource allocation, ensuring that essential therapeutic materials are continuously available for critical surgical applications.

What are the Key Data Covered in this Amniotic Membrane Market Research and Growth Report?

  • What is the expected growth of the Amniotic Membrane Market between 2026 and 2030?

    • USD 3.96 billion, at a CAGR of 16.6%

  • What segmentation does the market report cover?

    • The report is segmented by End-user (Hospitals, Ambulatory surgical centers, Specialty clinics, and Research and academic institutes), Type (Cryopreserved amniotic membrane, and Dehydrated amniotic membrane), Product Type (Single-layer, and Multi-layer) and Geography (North America, Europe, Asia, Rest of World (ROW))

  • Which regions are analyzed in the report?

    • North America, Europe, Asia and Rest of World (ROW)

  • What are the key growth drivers and market challenges?

    • Rising prevalence of chronic wounds and associated diseases, High cost of treatment and reimbursement uncertainties

  • Who are the major players in the Amniotic Membrane Market?

    • AlloSource, Amnio Technology LLC, Applied Biologics LLC, Corza Ophthalmology, Merakris Therapeutics Inc., MiMedx Group Inc., MTF Biologics, NuVision Biotherapies Ltd, Organogenesis Holdings Inc., Skye Biologics Holdings LLC, Stimlabs LLC, Surgenex LLC, Tides Medical, Ventris Medical LLC, Vivex Biologics Inc. and Zimmer Biomet Holdings Inc.

Market Research Insights

  • The Amniotic Membrane Market is rapidly evolving as healthcare networks prioritize advanced biologic therapies over conventional wound dressings. Facilities integrating these specialized tissues report a 24% improvement in postoperative outcomes due to superior tissue integration. Furthermore, the transition toward shelf-stable formats has decreased biological waste by 15%, optimizing inventory turnover for high-volume surgical centers.
  • Strict regulatory oversight ensures maximum safety and efficacy, fostering high clinical confidence. By leveraging distinct biological mechanisms to accelerate healing, regenerative medicine suppliers are actively reshaping standard care protocols and driving measurable operational efficiencies across specialized clinical environments.

We can help! Our analysts can customize this amniotic membrane market research report to meet your requirements.

Get in touch

1. Executive Summary

1.1 Market overview

Executive Summary - Chart on Market Overview
Executive Summary - Data Table on Market Overview
Executive Summary - Chart on Global Market Characteristics
Executive Summary - Chart on Market by Geography
Executive Summary - Chart on Market Segmentation by End-user
Executive Summary - Chart on Market Segmentation by Type
Executive Summary - Chart on Market Segmentation by Product Type
Executive Summary - Chart on Incremental Growth
Executive Summary - Data Table on Incremental Growth
Executive Summary - Chart on Company Market Positioning

2. Technavio Analysis

2.1 Analysis of price sensitivity, lifecycle, customer purchase basket, adoption rates, and purchase criteria

2.2 Criticality of inputs and Factors of differentiation

Chart on Overview on criticality of inputs and factors of differentiation

2.3 Factors of disruption

Chart on Overview on factors of disruption

2.4 Impact of drivers and challenges

Chart on Impact of drivers and challenges in 2025 and 2030

3. Market Landscape

3.1 Market ecosystem

Chart on Parent Market
Data Table on - Parent Market

3.2 Market characteristics

Chart on Market characteristics analysis

3.3 Value chain analysis

Chart on Value chain analysis

4. Market Sizing

4.1 Market definition

Data Table on Offerings of companies included in the market definition

4.2 Market segment analysis

Market segments

4.3 Market size 2025

4.4 Market outlook: Forecast for 2025-2030

Chart on Global - Market size and forecast 2025-2030 ($ million)
Data Table on Global - Market size and forecast 2025-2030 ($ million)
Chart on Global Market: Year-over-year growth 2025-2030 (%)
Data Table on Global Market: Year-over-year growth 2025-2030 (%)

5. Historic Market Size

5.1 Global Amniotic Membrane Market 2020 - 2024

Historic Market Size - Data Table on Global Amniotic Membrane Market 2020 - 2024 ($ million)

5.2 End-user segment analysis 2020 - 2024

Historic Market Size - End-user Segment 2020 - 2024 ($ million)

5.3 Type segment analysis 2020 - 2024

Historic Market Size - Type Segment 2020 - 2024 ($ million)

5.4 Product Type segment analysis 2020 - 2024

Historic Market Size - Product Type Segment 2020 - 2024 ($ million)

5.5 Geography segment analysis 2020 - 2024

Historic Market Size - Geography Segment 2020 - 2024 ($ million)

5.6 Country segment analysis 2020 - 2024

Historic Market Size - Country Segment 2020 - 2024 ($ million)

6. Qualitative Analysis

6.1 Impact of AI on Global Amniotic Membrane Market

6.2 Impact of Geopolitical Conflicts on Global Amniotic Membrane Market

7. Five Forces Analysis

7.1 Five forces summary

Five forces analysis - Comparison between 2025 and 2030

7.2 Bargaining power of buyers

Bargaining power of buyers - Impact of key factors 2025 and 2030

7.3 Bargaining power of suppliers

Bargaining power of suppliers - Impact of key factors in 2025 and 2030

7.4 Threat of new entrants

Threat of new entrants - Impact of key factors in 2025 and 2030

7.5 Threat of substitutes

Threat of substitutes - Impact of key factors in 2025 and 2030

7.6 Threat of rivalry

Threat of rivalry - Impact of key factors in 2025 and 2030

7.7 Market condition

Chart on Market condition - Five forces 2025 and 2030

8. Market Segmentation by End-user

8.1 Market segments

Chart on End-user - Market share 2025-2030 (%)
Data Table on End-user - Market share 2025-2030 (%)

8.2 Comparison by End-user

Chart on Comparison by End-user
Data Table on Comparison by End-user

8.3 Hospitals - Market size and forecast 2025-2030

Chart on Hospitals - Market size and forecast 2025-2030 ($ million)
Data Table on Hospitals - Market size and forecast 2025-2030 ($ million)
Chart on Hospitals - Year-over-year growth 2025-2030 (%)
Data Table on Hospitals - Year-over-year growth 2025-2030 (%)

8.4 Ambulatory surgical centers - Market size and forecast 2025-2030

Chart on Ambulatory surgical centers - Market size and forecast 2025-2030 ($ million)
Data Table on Ambulatory surgical centers - Market size and forecast 2025-2030 ($ million)
Chart on Ambulatory surgical centers - Year-over-year growth 2025-2030 (%)
Data Table on Ambulatory surgical centers - Year-over-year growth 2025-2030 (%)

8.5 Specialty clinics - Market size and forecast 2025-2030

Chart on Specialty clinics - Market size and forecast 2025-2030 ($ million)
Data Table on Specialty clinics - Market size and forecast 2025-2030 ($ million)
Chart on Specialty clinics - Year-over-year growth 2025-2030 (%)
Data Table on Specialty clinics - Year-over-year growth 2025-2030 (%)

8.6 Research and academic institutes - Market size and forecast 2025-2030

Chart on Research and academic institutes - Market size and forecast 2025-2030 ($ million)
Data Table on Research and academic institutes - Market size and forecast 2025-2030 ($ million)
Chart on Research and academic institutes - Year-over-year growth 2025-2030 (%)
Data Table on Research and academic institutes - Year-over-year growth 2025-2030 (%)

8.7 Market opportunity by End-user

Market opportunity by End-user ($ million)
Data Table on Market opportunity by End-user ($ million)

9. Market Segmentation by Type

9.1 Market segments

Chart on Type - Market share 2025-2030 (%)
Data Table on Type - Market share 2025-2030 (%)

9.2 Comparison by Type

Chart on Comparison by Type
Data Table on Comparison by Type

9.3 Cryopreserved amniotic membrane - Market size and forecast 2025-2030

Chart on Cryopreserved amniotic membrane - Market size and forecast 2025-2030 ($ million)
Data Table on Cryopreserved amniotic membrane - Market size and forecast 2025-2030 ($ million)
Chart on Cryopreserved amniotic membrane - Year-over-year growth 2025-2030 (%)
Data Table on Cryopreserved amniotic membrane - Year-over-year growth 2025-2030 (%)

9.4 Dehydrated amniotic membrane - Market size and forecast 2025-2030

Chart on Dehydrated amniotic membrane - Market size and forecast 2025-2030 ($ million)
Data Table on Dehydrated amniotic membrane - Market size and forecast 2025-2030 ($ million)
Chart on Dehydrated amniotic membrane - Year-over-year growth 2025-2030 (%)
Data Table on Dehydrated amniotic membrane - Year-over-year growth 2025-2030 (%)

9.5 Market opportunity by Type

Market opportunity by Type ($ million)
Data Table on Market opportunity by Type ($ million)

10. Market Segmentation by Product Type

10.1 Market segments

Chart on Product Type - Market share 2025-2030 (%)
Data Table on Product Type - Market share 2025-2030 (%)

10.2 Comparison by Product Type

Chart on Comparison by Product Type
Data Table on Comparison by Product Type

10.3 Single-layer - Market size and forecast 2025-2030

Chart on Single-layer - Market size and forecast 2025-2030 ($ million)
Data Table on Single-layer - Market size and forecast 2025-2030 ($ million)
Chart on Single-layer - Year-over-year growth 2025-2030 (%)
Data Table on Single-layer - Year-over-year growth 2025-2030 (%)

10.4 Multi-layer - Market size and forecast 2025-2030

Chart on Multi-layer - Market size and forecast 2025-2030 ($ million)
Data Table on Multi-layer - Market size and forecast 2025-2030 ($ million)
Chart on Multi-layer - Year-over-year growth 2025-2030 (%)
Data Table on Multi-layer - Year-over-year growth 2025-2030 (%)

10.5 Market opportunity by Product Type

Market opportunity by Product Type ($ million)
Data Table on Market opportunity by Product Type ($ million)

11. Customer Landscape

11.1 Customer landscape overview

Analysis of price sensitivity, lifecycle, customer purchase basket, adoption rates, and purchase criteria

12. Geographic Landscape

12.1 Geographic segmentation

Chart on Market share by geography 2025-2030 (%)
Data Table on Market share by geography 2025-2030 (%)

12.2 Geographic comparison

Chart on Geographic comparison
Data Table on Geographic comparison

12.3 North America - Market size and forecast 2025-2030

Chart on North America - Market size and forecast 2025-2030 ($ million)
Data Table on North America - Market size and forecast 2025-2030 ($ million)
Chart on North America - Year-over-year growth 2025-2030 (%)
Data Table on North America - Year-over-year growth 2025-2030 (%)
Chart on Regional Comparison - North America
Data Table on Regional Comparison - North America

12.3.1 US - Market size and forecast 2025-2030

Chart on US - Market size and forecast 2025-2030 ($ million)
Data Table on US - Market size and forecast 2025-2030 ($ million)
Chart on US - Year-over-year growth 2025-2030 (%)
Data Table on US - Year-over-year growth 2025-2030 (%)

12.3.2 Canada - Market size and forecast 2025-2030

Chart on Canada - Market size and forecast 2025-2030 ($ million)
Data Table on Canada - Market size and forecast 2025-2030 ($ million)
Chart on Canada - Year-over-year growth 2025-2030 (%)
Data Table on Canada - Year-over-year growth 2025-2030 (%)

12.3.3 Mexico - Market size and forecast 2025-2030

Chart on Mexico - Market size and forecast 2025-2030 ($ million)
Data Table on Mexico - Market size and forecast 2025-2030 ($ million)
Chart on Mexico - Year-over-year growth 2025-2030 (%)
Data Table on Mexico - Year-over-year growth 2025-2030 (%)

12.4 Europe - Market size and forecast 2025-2030

Chart on Europe - Market size and forecast 2025-2030 ($ million)
Data Table on Europe - Market size and forecast 2025-2030 ($ million)
Chart on Europe - Year-over-year growth 2025-2030 (%)
Data Table on Europe - Year-over-year growth 2025-2030 (%)
Chart on Regional Comparison - Europe
Data Table on Regional Comparison - Europe

12.4.1 Germany - Market size and forecast 2025-2030

Chart on Germany - Market size and forecast 2025-2030 ($ million)
Data Table on Germany - Market size and forecast 2025-2030 ($ million)
Chart on Germany - Year-over-year growth 2025-2030 (%)
Data Table on Germany - Year-over-year growth 2025-2030 (%)

12.4.2 UK - Market size and forecast 2025-2030

Chart on UK - Market size and forecast 2025-2030 ($ million)
Data Table on UK - Market size and forecast 2025-2030 ($ million)
Chart on UK - Year-over-year growth 2025-2030 (%)
Data Table on UK - Year-over-year growth 2025-2030 (%)

12.4.3 France - Market size and forecast 2025-2030

Chart on France - Market size and forecast 2025-2030 ($ million)
Data Table on France - Market size and forecast 2025-2030 ($ million)
Chart on France - Year-over-year growth 2025-2030 (%)
Data Table on France - Year-over-year growth 2025-2030 (%)

12.4.4 Italy - Market size and forecast 2025-2030

Chart on Italy - Market size and forecast 2025-2030 ($ million)
Data Table on Italy - Market size and forecast 2025-2030 ($ million)
Chart on Italy - Year-over-year growth 2025-2030 (%)
Data Table on Italy - Year-over-year growth 2025-2030 (%)

12.4.5 Spain - Market size and forecast 2025-2030

Chart on Spain - Market size and forecast 2025-2030 ($ million)
Data Table on Spain - Market size and forecast 2025-2030 ($ million)
Chart on Spain - Year-over-year growth 2025-2030 (%)
Data Table on Spain - Year-over-year growth 2025-2030 (%)

12.4.6 The Netherlands - Market size and forecast 2025-2030

Chart on The Netherlands - Market size and forecast 2025-2030 ($ million)
Data Table on The Netherlands - Market size and forecast 2025-2030 ($ million)
Chart on The Netherlands - Year-over-year growth 2025-2030 (%)
Data Table on The Netherlands - Year-over-year growth 2025-2030 (%)

12.5 Asia - Market size and forecast 2025-2030

Chart on Asia - Market size and forecast 2025-2030 ($ million)
Data Table on Asia - Market size and forecast 2025-2030 ($ million)
Chart on Asia - Year-over-year growth 2025-2030 (%)
Data Table on Asia - Year-over-year growth 2025-2030 (%)
Chart on Regional Comparison - Asia
Data Table on Regional Comparison - Asia

12.5.1 China - Market size and forecast 2025-2030

Chart on China - Market size and forecast 2025-2030 ($ million)
Data Table on China - Market size and forecast 2025-2030 ($ million)
Chart on China - Year-over-year growth 2025-2030 (%)
Data Table on China - Year-over-year growth 2025-2030 (%)

12.5.2 Japan - Market size and forecast 2025-2030

Chart on Japan - Market size and forecast 2025-2030 ($ million)
Data Table on Japan - Market size and forecast 2025-2030 ($ million)
Chart on Japan - Year-over-year growth 2025-2030 (%)
Data Table on Japan - Year-over-year growth 2025-2030 (%)

12.5.3 India - Market size and forecast 2025-2030

Chart on India - Market size and forecast 2025-2030 ($ million)
Data Table on India - Market size and forecast 2025-2030 ($ million)
Chart on India - Year-over-year growth 2025-2030 (%)
Data Table on India - Year-over-year growth 2025-2030 (%)

12.5.4 South Korea - Market size and forecast 2025-2030

Chart on South Korea - Market size and forecast 2025-2030 ($ million)
Data Table on South Korea - Market size and forecast 2025-2030 ($ million)
Chart on South Korea - Year-over-year growth 2025-2030 (%)
Data Table on South Korea - Year-over-year growth 2025-2030 (%)

12.5.5 Indonesia - Market size and forecast 2025-2030

Chart on Indonesia - Market size and forecast 2025-2030 ($ million)
Data Table on Indonesia - Market size and forecast 2025-2030 ($ million)
Chart on Indonesia - Year-over-year growth 2025-2030 (%)
Data Table on Indonesia - Year-over-year growth 2025-2030 (%)

12.5.6 Thailand - Market size and forecast 2025-2030

Chart on Thailand - Market size and forecast 2025-2030 ($ million)
Data Table on Thailand - Market size and forecast 2025-2030 ($ million)
Chart on Thailand - Year-over-year growth 2025-2030 (%)
Data Table on Thailand - Year-over-year growth 2025-2030 (%)

12.6 Rest of World (ROW) - Market size and forecast 2025-2030

Chart on Rest of World (ROW) - Market size and forecast 2025-2030 ($ million)
Data Table on Rest of World (ROW) - Market size and forecast 2025-2030 ($ million)
Chart on Rest of World (ROW) - Year-over-year growth 2025-2030 (%)
Data Table on Rest of World (ROW) - Year-over-year growth 2025-2030 (%)
Chart on Regional Comparison - Rest of World (ROW)
Data Table on Regional Comparison - Rest of World (ROW)

12.6.1 Brazil - Market size and forecast 2025-2030

Chart on Brazil - Market size and forecast 2025-2030 ($ million)
Data Table on Brazil - Market size and forecast 2025-2030 ($ million)
Chart on Brazil - Year-over-year growth 2025-2030 (%)
Data Table on Brazil - Year-over-year growth 2025-2030 (%)

12.6.2 Saudi Arabia - Market size and forecast 2025-2030

Chart on Saudi Arabia - Market size and forecast 2025-2030 ($ million)
Data Table on Saudi Arabia - Market size and forecast 2025-2030 ($ million)
Chart on Saudi Arabia - Year-over-year growth 2025-2030 (%)
Data Table on Saudi Arabia - Year-over-year growth 2025-2030 (%)

12.6.3 UAE - Market size and forecast 2025-2030

Chart on UAE - Market size and forecast 2025-2030 ($ million)
Data Table on UAE - Market size and forecast 2025-2030 ($ million)
Chart on UAE - Year-over-year growth 2025-2030 (%)
Data Table on UAE - Year-over-year growth 2025-2030 (%)

12.6.4 Turkey - Market size and forecast 2025-2030

Chart on Turkey - Market size and forecast 2025-2030 ($ million)
Data Table on Turkey - Market size and forecast 2025-2030 ($ million)
Chart on Turkey - Year-over-year growth 2025-2030 (%)
Data Table on Turkey - Year-over-year growth 2025-2030 (%)

12.6.5 Argentina - Market size and forecast 2025-2030

Chart on Argentina - Market size and forecast 2025-2030 ($ million)
Data Table on Argentina - Market size and forecast 2025-2030 ($ million)
Chart on Argentina - Year-over-year growth 2025-2030 (%)
Data Table on Argentina - Year-over-year growth 2025-2030 (%)

12.6.6 Colombia - Market size and forecast 2025-2030

Chart on Colombia - Market size and forecast 2025-2030 ($ million)
Data Table on Colombia - Market size and forecast 2025-2030 ($ million)
Chart on Colombia - Year-over-year growth 2025-2030 (%)
Data Table on Colombia - Year-over-year growth 2025-2030 (%)

12.6.7 South Africa - Market size and forecast 2025-2030

Chart on South Africa - Market size and forecast 2025-2030 ($ million)
Data Table on South Africa - Market size and forecast 2025-2030 ($ million)
Chart on South Africa - Year-over-year growth 2025-2030 (%)
Data Table on South Africa - Year-over-year growth 2025-2030 (%)

12.6.8 Israel - Market size and forecast 2025-2030

Chart on Israel - Market size and forecast 2025-2030 ($ million)
Data Table on Israel - Market size and forecast 2025-2030 ($ million)
Chart on Israel - Year-over-year growth 2025-2030 (%)
Data Table on Israel - Year-over-year growth 2025-2030 (%)

12.7 Market opportunity by geography

Market opportunity by geography ($ million)
Data Tables on Market opportunity by geography ($ million)

13. Drivers, Challenges, and Opportunity

13.1 Market drivers

Rising prevalence of chronic wounds and associated diseases
Expansion of applications in regenerative medicine and surgery
Technological advancements and growing body of clinical evidence

13.2 Market challenges

High cost of treatment and reimbursement uncertainties
Stringent regulatory frameworks and ethical considerations
Lack of awareness and shortage of skilled professionals

13.3 Impact of drivers and challenges

Impact of drivers and challenges in 2025 and 2030

13.4 Market opportunities

Shift toward dehydrated and shelf-stable product formulations
Diversification of applications into new medical specialties
Development of advanced and combination product formulations

14. Competitive Landscape

14.1 Overview

14.2

Overview on criticality of inputs and factors of differentiation

14.3 Landscape disruption

Overview on factors of disruption

14.4 Industry risks

Impact of key risks on business

15. Competitive Analysis

15.1 Companies profiled

Companies covered

15.2 Company ranking index

15.3 Market positioning of companies

Matrix on companies position and classification

15.4 AlloSource

AlloSource - Overview
AlloSource - Product / Service
AlloSource - Key offerings
SWOT

15.5 Amnio Technology LLC

Amnio Technology LLC - Overview
Amnio Technology LLC - Product / Service
Amnio Technology LLC - Key offerings
SWOT

15.6 Applied Biologics LLC

Applied Biologics LLC - Overview
Applied Biologics LLC - Product / Service
Applied Biologics LLC - Key offerings
SWOT

15.7 Corza Ophthalmology

Corza Ophthalmology - Overview
Corza Ophthalmology - Product / Service
Corza Ophthalmology - Key offerings
SWOT

15.8 Merakris Therapeutics Inc.

Merakris Therapeutics Inc. - Overview
Merakris Therapeutics Inc. - Product / Service
Merakris Therapeutics Inc. - Key offerings
SWOT

15.9 MiMedx Group Inc.

MiMedx Group Inc. - Overview
MiMedx Group Inc. - Business segments
MiMedx Group Inc. - Key offerings
MiMedx Group Inc. - Segment focus
SWOT

15.10 MTF Biologics

MTF Biologics - Overview
MTF Biologics - Product / Service
MTF Biologics - Key offerings
SWOT

15.11 NuVision Biotherapies Ltd

NuVision Biotherapies Ltd - Overview
NuVision Biotherapies Ltd - Product / Service
NuVision Biotherapies Ltd - Key offerings
SWOT

15.12 Organogenesis Holdings Inc.

Organogenesis Holdings Inc. - Overview
Organogenesis Holdings Inc. - Business segments
Organogenesis Holdings Inc. - Key offerings
Organogenesis Holdings Inc. - Segment focus
SWOT

15.13 Stimlabs LLC

Stimlabs LLC - Overview
Stimlabs LLC - Product / Service
Stimlabs LLC - Key offerings
SWOT

15.14 Surgenex LLC

Surgenex LLC - Overview
Surgenex LLC - Product / Service
Surgenex LLC - Key offerings
SWOT

15.15 Tides Medical

Tides Medical - Overview
Tides Medical - Product / Service
Tides Medical - Key offerings
SWOT

15.16 Ventris Medical LLC

Ventris Medical LLC - Overview
Ventris Medical LLC - Product / Service
Ventris Medical LLC - Key offerings
SWOT

15.17 Vivex Biologics Inc.

Vivex Biologics Inc. - Overview
Vivex Biologics Inc. - Product / Service
Vivex Biologics Inc. - Key offerings
SWOT

15.18 Zimmer Biomet Holdings Inc.

Zimmer Biomet Holdings Inc. - Overview
Zimmer Biomet Holdings Inc. - Business segments
Zimmer Biomet Holdings Inc. - Key news
Zimmer Biomet Holdings Inc. - Key offerings
Zimmer Biomet Holdings Inc. - Segment focus
SWOT

16. Appendix

16.1 Scope of the report

Market definition
Objectives
Notes and caveats

16.2 Inclusions and exclusions checklist

Inclusions checklist
Exclusions checklist

16.3 Currency conversion rates for US$

16.4 Research methodology

16.5 Data procurement

Information sources

16.6 Data validation

16.7 Validation techniques employed for market sizing

16.8 Data synthesis

16.9 360 degree market analysis

16.10 List of abbreviations

Research Methodology

Technavio presents a detailed picture of the market by way of study, synthesis, and summation of data from multiple sources. The analysts have presented the various facets of the market with a particular focus on identifying the key industry influencers. The data thus presented is comprehensive, reliable, and the result of extensive research, both primary and secondary.

INFORMATION SOURCES

Primary sources

  • Manufacturers and suppliers
  • Channel partners
  • Industry experts
  • Strategic decision makers

Secondary sources

  • Industry journals and periodicals
  • Government data
  • Financial reports of key industry players
  • Historical data
  • Press releases

DATA ANALYSIS

Data Synthesis

  • Collation of data
  • Estimation of key figures
  • Analysis of derived insights

Data Validation

  • Triangulation with data models
  • Reference against proprietary databases
  • Corroboration with industry experts

REPORT WRITING

Qualitative

  • Market drivers
  • Market challenges
  • Market trends
  • Five forces analysis

Quantitative

  • Market size and forecast
  • Market segmentation
  • Geographical insights
  • Competitive landscape

Interested in this report?

Get your sample now to see our research methodology and insights!

Download Now

Frequently Asked Questions

Amniotic Membrane market growth will increase by USD 3963.1 million during 2026-2030.

The Amniotic Membrane market is expected to grow at a CAGR of 16.6% during 2026-2030.

Amniotic Membrane market is segmented by End-user (Hospitals, Ambulatory surgical centers, Specialty clinics, Research and academic institutes) Type (Cryopreserved amniotic membrane, Dehydrated amniotic membrane) Product type (Single-layer, Multi-layer)

AlloSource, Amnio Technology LLC, Applied Biologics LLC, Corza Ophthalmology, Merakris Therapeutics Inc., MiMedx Group Inc., MTF Biologics, NuVision Biotherapies Ltd, Organogenesis Holdings Inc., Skye Biologics Holdings LLC, Stimlabs LLC, Surgenex LLC, Tides Medical, Ventris Medical LLC, Vivex Biologics Inc., Zimmer Biomet Holdings Inc. are a few of the key vendors in the Amniotic Membrane market.

North America will register the highest growth rate of 55.8% among the other regions. Therefore, the Amniotic Membrane market in North America is expected to garner significant business opportunities for the vendors during the forecast period.

US, Canada, Mexico, Germany, UK, France, Italy, Spain, The Netherlands, China, Japan, India, South Korea, Indonesia, Thailand, Brazil, Saudi Arabia, UAE, Turkey, Argentina, Colombia, South Africa, Israel

  • Rising prevalence of chronic wounds and associated diseases is the driving factor this market.

The Amniotic Membrane market vendors should focus on grabbing business opportunities from the End-user segment as it accounted for the largest market share in the base year.
RIA - Research AI Assistant
Ask RIA
