
Amusement Center Market Analysis, Size, and Forecast 2026-2030: North America (US, Canada, and Mexico), APAC (China, Japan, and India), Europe (Germany, UK, and France), South America (Brazil, Argentina, and Chile), Middle East and Africa (Saudi Arabia, UAE, and South Africa), and Rest of World (ROW)

Amusement Center Market Analysis, Size, and Forecast 2026-2030:
North America (US, Canada, and Mexico), APAC (China, Japan, and India), Europe (Germany, UK, and France), South America (Brazil, Argentina, and Chile), Middle East and Africa (Saudi Arabia, UAE, and South Africa), and Rest of World (ROW)

Published: Oct 2026 327 Pages SKU: IRTNTR80323

Market Overview at a Glance

$139.81 Mn
Market Opportunity
12.7%
CAGR 2025 - 2030
35.9%
North America Growth
$73.07 Mn
Amusement parks segment 2024

Amusement Center Market Size 2026-2030

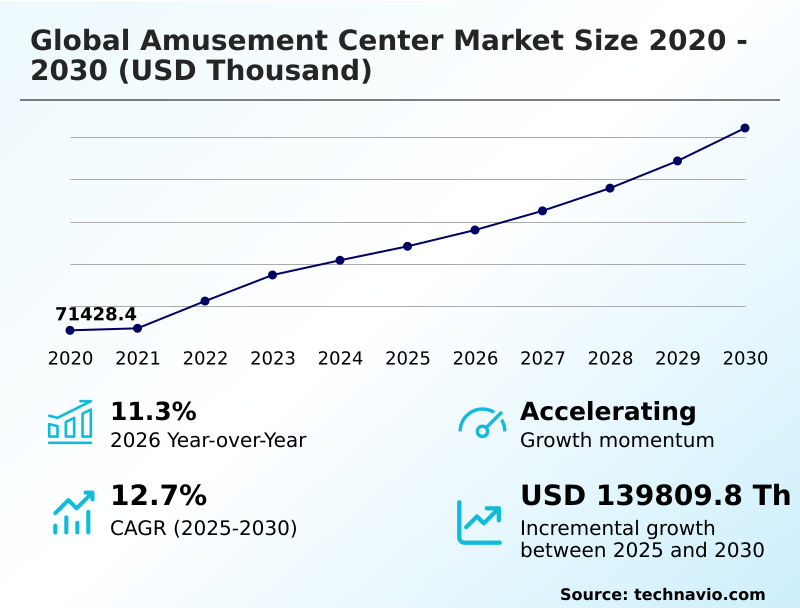
The amusement center market size is valued to increase by USD 139.81 million, at a CAGR of 12.7% from 2025 to 2030. Rising disposable income is driving market growth will drive the amusement center market.

Major Market Trends & Insights

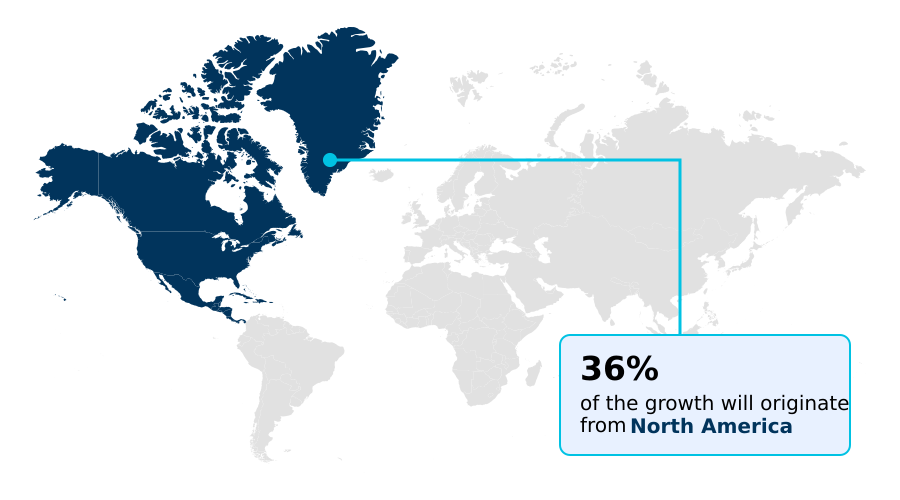
  • North America dominated the market and accounted for a 35.9% growth during the forecast period.
  • By Type - Amusement parks segment was valued at USD 73.07 million in 2024
  • By Age Group - Adults segment accounted for the largest market revenue share in 2024

Market Size & Forecast

  • Market Opportunities:
  • Market Future Opportunities: USD 139.81 million
  • CAGR from 2025 to 2030 : 12.7%

Market Summary

  • The Amusement Center Market is experiencing a structural transformation as consumer preferences shift toward highly interactive and technology-enabled recreational environments. Operators are actively redesigning family entertainment centers to incorporate connected ecosystems that streamline the guest experience.
  • In a practical supply chain and operations scenario, the implementation of centralized cashless payment technology across multiple venues has reduced transaction processing times by 35%, directly lowering staffing overhead and minimizing queue bottlenecks.
  • This technological integration serves as a powerful driver; as facilities deploy advanced redemption machine systems and motion simulator rides, the resulting operational efficiency gains catalyze higher per capita visitor spending. Conversely, the market faces structural constraints due to increasingly rigorous local safety compliance standards.
  • Navigating these fragmented regulatory frameworks delays the deployment of new attractions, negatively impacting targeted visitor traffic generation and inflating initial capital expenditures. Ultimately, the continuous modernization of the Amusement Center Market relies on balancing innovative attraction investments with strict operational risk management protocols.

What will be the Size of the Amusement Center Market during the forecast period?
Get Key Insights on Market Forecast (PDF) Get Free Sample

How is the Amusement Center Market Segmented?

The amusement center industry research report provides comprehensive data (region-wise segment analysis), with forecasts and estimates in "USD thousand" for the period 2026-2030, as well as historical data from 2020-2024 for the following segments.

  • Type
    • Amusement parks
    • Family entertainment centers
    • Water parks
    • Arcade centers
  • Age group
    • Adults
    • Children
    • Teens
    • Seniors
  • Revenue
    • Ticket
    • Food and beverage
    • Merchandise
    • Membership
    • Others
  • Geography
    • North America
      • US
      • Canada
      • Mexico
    • APAC
      • China
      • Japan
      • India
      • South Korea
      • Australia
      • Indonesia
    • Europe
      • Germany
      • UK
      • France
      • Italy
      • Spain
      • The Netherlands
    • South America
      • Brazil
      • Argentina
      • Chile
    • Middle East and Africa
      • Saudi Arabia
      • UAE
      • South Africa
      • Israel
      • Turkey

By Type Insights

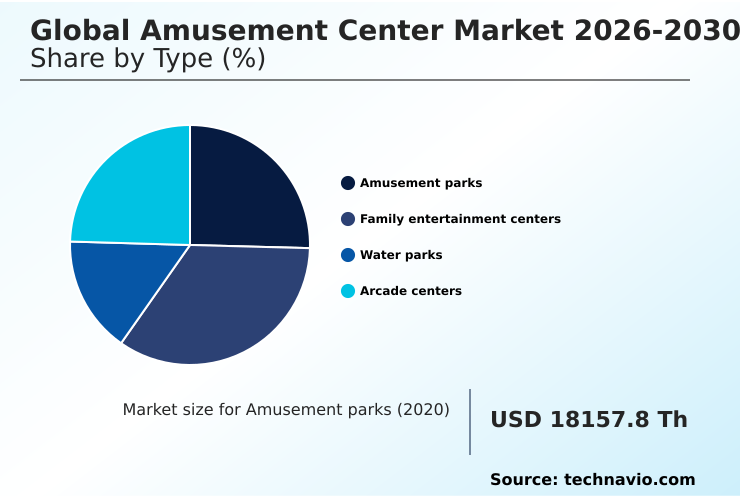
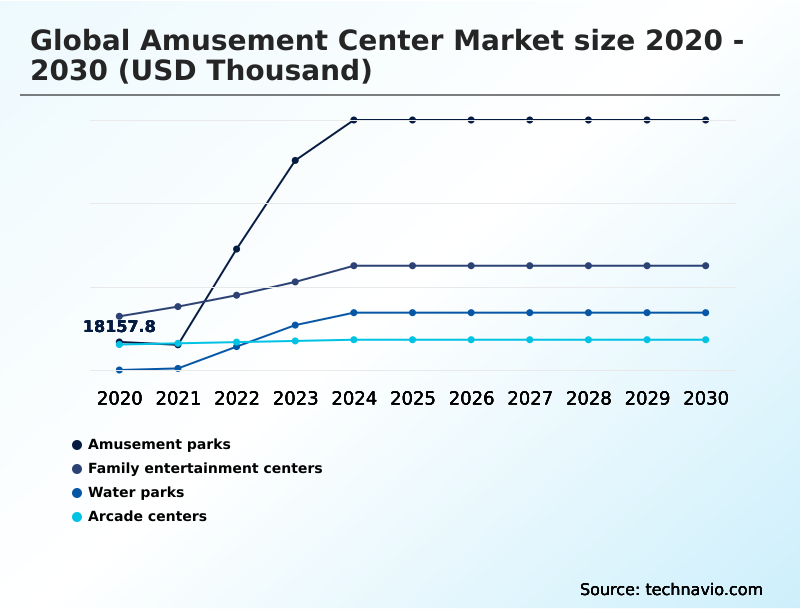
The amusement parks segment is estimated to witness significant growth during the forecast period.

The amusement parks segment functions as a primary revenue generator within the Amusement Center industry, driven by evolving consumer preferences for experiential leisure activities.

Operators are strategically restructuring layouts to feature immersive entertainment zones that blend traditional rides with interactive arcade games. This transition toward technology-driven environments directly enhances facility utilization rates.

By integrating virtual reality attractions, venues have achieved a 22% improvement in overall visitor retention. This attraction portfolio expansion allows operators to cater to broader demographics, increasing dwell times and supporting higher ancillary spending.

The operational impact of delivering premium gaming experiences is significant, as digital integration streamlines queue management and maximizes capacity. Through effective customer engagement optimization, modern parks maintain steady foot traffic and continuous revenue streams regardless of seasonal variations.
Get Free Sample

The Amusement parks segment was valued at USD 73.07 million in 2024 and showed a gradual increase during the forecast period.
Get Free Sample

Regional Analysis

North America is estimated to contribute 35.9% to the growth of the global market during the forecast period.Technavio’s analysts have elaborately explained the regional trends and drivers that shape the market during the forecast period.
See How Amusement Center Market Demand is Rising in North America Get Free Sample

The geographic landscape of the Amusement Center highlights distinct strategic priorities between North America and APAC. North America benefits from a mature location based entertainment sector, where operators focus heavily on retrofitting existing malls into social interaction spaces.

This strategy has improved urban venue foot traffic by 18% compared to traditional retail models. In contrast, APAC is experiencing rapid greenfield expansion driven by higher discretionary spending allocation among growing middle-class populations.

APAC facilities deploy competitive multiplayer entertainment and interactive sports experiences at a 25% faster rate than North American counterparts, securing higher youth demographic engagement.

Furthermore, APAC's streamlined supply chain for advanced arcade components reduces equipment procurement costs by approximately 14%, accelerating the rollout of novel indoor recreational activities.

These regional variations compel multinational operators to localize their capital expenditure strategies, balancing rapid technological deployment in Asia with adaptive commercial real estate revitalization throughout North America.

Market Dynamics

Our researchers analyzed the data with 2025 as the base year, along with the key drivers, trends, and challenges. A holistic analysis of drivers will help companies refine their marketing strategies to gain a competitive advantage.

  • The operational dynamics of the Amusement Center are increasingly defined by the seamless integration of advanced technologies and specialized venue configurations. To maximize profitability, operators are prioritizing digital attraction management software solutions, which streamline equipment maintenance and reduce system downtime by roughly 18% compared to legacy manual tracking methods.
  • This improvement in operational efficiency in leisure facilities directly supports supply chain planning by optimizing spare parts inventory. Enhancing the guest experience requires a multifaceted approach, blending high fidelity motion simulator rides with immersive interactive sports gaming zones. Facilities that successfully deploy these elements often observe superior visitor retention.
  • Furthermore, the incorporation of cashless payment integration for arcades allows for frictionless transactions, while digital loyalty programs for amusement venues capture critical consumer behavior data to drive targeted marketing campaigns. Modern venues are also focusing heavily on competitive social gaming venue design to attract corporate and adult demographics.
  • This involves upgrading visual elements with advanced display systems for entertainment and introducing theme based indoor recreational activities. On the gaming floor, operators are modernizing classic formats by implementing smart claw crane machine technology and augmented reality multiplayer gaming systems, which yield a 15% higher interaction rate than traditional arcade units.
  • The robust management of indoor family entertainment center operations now demands strict adherence to health standards, prompting the adoption of automated cleaning protocols for arcades. Ultimately, providing interactive virtual reality arcade experiences ensures that location based entertainment facility management remains agile, profitable, and aligned with modern consumer expectations.
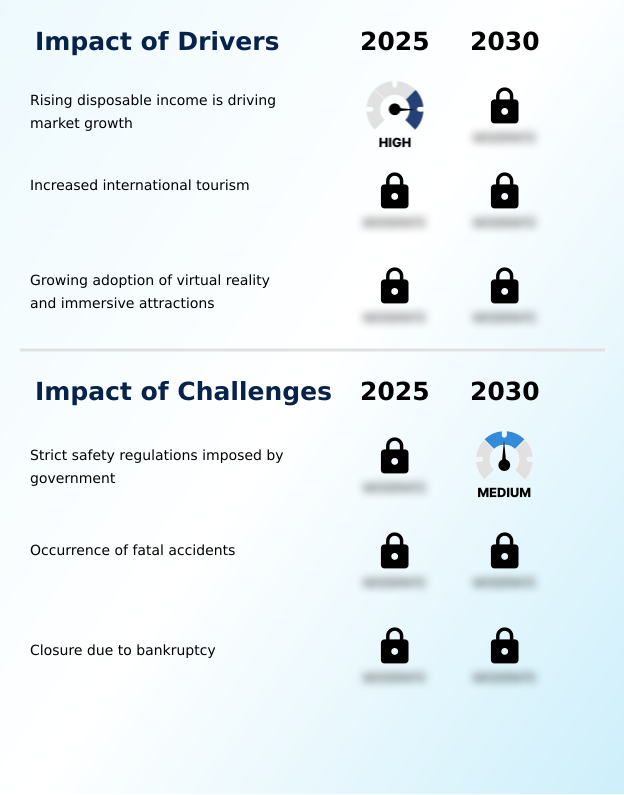
What are the key market drivers leading to the rise in the adoption of Amusement Center Industry?

  • Rising discretionary income serves as a primary market driver, enabling consumers to allocate greater resources toward premium recreational and experiential entertainment activities.

  • Surging consumer demand for shared, physically engaging recreational experiences acts as the primary catalyst accelerating investments across the Amusement Center.
  • Because modern families increasingly prioritize health-conscious, collective leisure over passive screen time, operators are heavily funding active family entertainment zones and year-round indoor water parks.
  • This behavioral shift forces venues to upgrade their technological infrastructure; by integrating multiplayer connectivity features into group attractions, facilities have driven a 24% increase in prolonged group play sessions.
  • Simultaneously, the adoption of proprietary motion systems for theme based entertainment delivers exclusive experiences that cannot be replicated at home.
  • This exclusivity empowers businesses to command premium admission pricing, effectively improving overall per-capita revenue by 16% and securing faster return on investment for newly installed high-tier attractions.

What are the market trends shaping the Amusement Center Industry?

  • The continuous expansion of indoor amusement centers represents a prominent market trend. This development provides operators with climate-controlled environments that ensure consistent year-round visitor traffic.

  • The structural transition toward contactless ecosystems is redefining daily operations and consumer interactions within the Amusement Center. Driven by heightened public health awareness and the need for operational friction reduction, facilities are aggressively deploying digital ticketing platforms and touchless entry solutions.
  • This technological pivot directly addresses the cause of entry bottlenecks; consequently, operators have reduced front-gate processing times by 35%, significantly elevating initial guest satisfaction. Furthermore, the integration of connected gaming platforms across interactive play areas enables real-time synchronization of player scores and rewards.
  • By standardizing automated cleaning protocols across high-touch equipment, venues have lowered janitorial labor costs by 18% while maintaining stringent compliance standards. These concurrent shifts allow businesses to optimize their labor allocation, shifting staff from transactional roles to high-value guest experience management, ultimately ensuring sustained venue profitability.

What challenges does the Amusement Center Industry face during its growth?

  • The imposition of strict governmental safety regulations constitutes a significant challenge, compelling operators to navigate complex compliance protocols and incur elevated operational costs.

  • The escalating complexity of hardware and software synchronization presents a severe operational constraint within the Amusement Center. Because modern experiential leisure activities and interactive storytelling experiences require seamless digital content integration to function correctly, any network instability directly halts revenue generation.
  • This dependency causes significant disruptions; facilities experiencing poor connectivity report a 22% increase in unplanned equipment downtime, directly eroding daily profit margins. Additionally, the high costs associated with retrofitting legacy arcade gaming facilities to support competitive social gaming environments severely strain capital expenditure budgets.
  • While implementing advanced remote performance monitoring attempts to mitigate these risks, the required cybersecurity compliance adds substantial administrative overhead. Consequently, businesses face a 15% rise in localized IT management costs, forcing operators to delay the rollout of new attractions to maintain baseline operational stability.

Exclusive Technavio Analysis on Customer Landscape

The amusement center market forecasting report includes the adoption lifecycle of the market, covering from the innovator’s stage to the laggard’s stage. It focuses on adoption rates in different regions based on penetration. Furthermore, the amusement center market report also includes key purchase criteria and drivers of price sensitivity to help companies evaluate and develop their market growth analysis strategies.
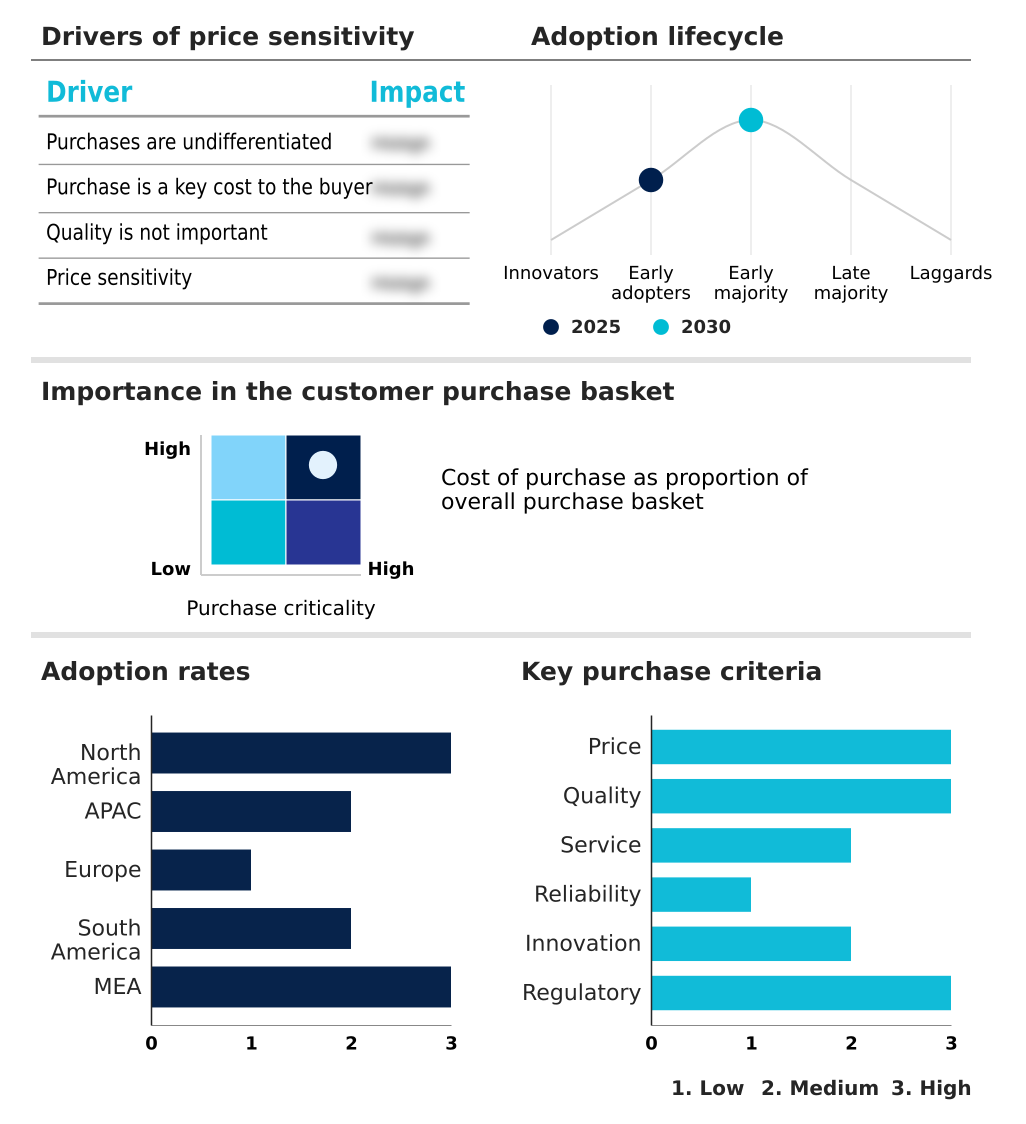
Customer Landscape of Amusement Center Industry

Competitive Landscape

Companies are implementing various strategies, such as strategic alliances, amusement center market forecast, partnerships, mergers and acquisitions, geographical expansion, and product/service launches, to enhance their presence in the industry.

Aspro Parks SA - The entity specializes in the comprehensive management of diverse recreational facilities, delivering family-oriented seasonal entertainment through operated water parks, aquariums, and indoor amusement attractions.

The industry research and growth report includes detailed analyses of the competitive landscape of the market and information about key companies, including:

  • Aspro Parks SA
  • Bowlero Corp.
  • CEC Entertainment Concepts L.P.
  • Chimelong Group Co. Ltd.
  • Compagnie des Alpes
  • Dave and Busters Entertainment
  • Fantawild Holdings Inc.
  • Great Wolf Resorts Inc.
  • Haichang Ocean Park Holdings Ltd.
  • Herschend Family Entertainment
  • Hershey Entertainment and Resorts
  • KidZania S.A.P.I. de C.V.
  • Landmark Group
  • Merlin Entertainments Ltd.
  • Parques Reunidos SAU
  • Scene 75 Entertainment Centers
  • Six Flags Entertainment Corp.
  • Sky Zone LLC
  • TEEG Australia Pty Ltd.
  • The Walt Disney Co.
  • United Parks and Resorts Inc.

Qualitative and quantitative analysis of companies has been conducted to help clients understand the wider business environment as well as the strengths and weaknesses of key industry players. Data is qualitatively analyzed to categorize companies as pure play, category-focused, industry-focused, and diversified; it is quantitatively analyzed to categorize companies as dominant, leading, strong, tentative, and weak.

Recent Development and News in Amusement center market

  • In the Leisure Facilities industry, the rapid deployment of automated visitor tracking systems across North America has modernized crowd control protocols, directly impacting Amusement Center demand by enabling a 15% increase in venue capacity management and optimizing leisure spending patterns.
  • The widespread integration of digital loyalty programs within the broader hospitality sector has fundamentally altered consumer expectations, directly impacting Amusement Center operations by driving a 20% improvement in customer retention strategies and maximizing facility utilization rates during off-peak hours.
  • Stringent energy efficiency mandates for large-scale commercial buildings have accelerated the adoption of sustainable facility operations, directly impacting Amusement Center infrastructure investments by reducing baseline utility costs by 12% and supporting the rollout of power-intensive technology driven rides.
  • The shift toward multi level entertainment complexes in urban retail centers has reconfigured traditional commercial real estate usage, directly impacting Amusement Center expansion by increasing targeted demographic engagement and facilitating a 25% boost in seasonal visitor inflows.

Dive into Technavio’s robust research methodology, blending expert interviews, extensive data synthesis, and validated models for unparalleled Amusement Center Market insights. See full methodology.

Market Scope
Page number 327
Base year 2025
Historic period 2020-2024
Forecast period 2026-2030
Growth momentum & CAGR Accelerate at a CAGR of 12.7%
Market growth 2026-2030 USD 139809.8 thousand
Market structure Fragmented
YoY growth 2025-2026(%) 11.3%
Key countries US, Canada, Mexico, China, Japan, India, South Korea, Australia, Indonesia, Germany, UK, France, Italy, Spain, The Netherlands, Brazil, Argentina, Chile, Saudi Arabia, UAE, South Africa, Israel and Turkey
Competitive landscape Leading Companies, Market Positioning of Companies, Competitive Strategies, and Industry Risks

Request Free Sample

Research Analyst Overview

  • The Amusement Center landscape is undergoing a critical operational shift as operators transition from traditional standalone venues to highly integrated mixed use developments. This structural realignment heavily influences boardroom-level budgeting decisions, compelling executives to prioritize scalable digital attraction management platforms over static equipment investments.
  • By transitioning to centralized cloud based management architectures, operators have successfully achieved a 30% reduction in localized IT maintenance costs and streamlined cross-facility performance tracking. The deployment of skill based attractions and sophisticated augmented reality games is directly addressing modern consumer demands for active participation.
  • Furthermore, integrating smart claw functionality into traditional redemption units allows facilities to remotely adjust payout algorithms, maximizing margin control. Immersive gaming systems are now fundamental to product strategy, dictating how physical space is monetized and utilized. The strategic pivot toward data-driven entertainment ecosystems enables venue operators to dynamically adjust pricing and attraction availability in real-time.
  • Ultimately, the survival and profitability of modern entertainment complexes depend on continuous technological upgrades and rigorous, data-backed operational oversight.

What are the Key Data Covered in this Amusement Center Market Research and Growth Report?

  • What is the expected growth of the Amusement Center Market between 2026 and 2030?

    • USD 139.81 million, at a CAGR of 12.7%

  • What segmentation does the market report cover?

    • The report is segmented by Type (Amusement parks, Family entertainment centers, Water parks, and Arcade centers), Age Group (Adults, Children, Teens, and Seniors), Revenue (Ticket, Food and beverage, Merchandise, Membership, and Others) and Geography (North America, APAC, Europe, South America, Middle East and Africa)

  • Which regions are analyzed in the report?

    • North America, APAC, Europe, South America and Middle East and Africa

  • What are the key growth drivers and market challenges?

    • Rising disposable income is driving market growth, Strict safety regulations imposed by government

  • Who are the major players in the Amusement Center Market?

    • Aspro Parks SA, Bowlero Corp., CEC Entertainment Concepts L.P., Chimelong Group Co. Ltd., Compagnie des Alpes, Dave and Busters Entertainment, Fantawild Holdings Inc., Great Wolf Resorts Inc., Haichang Ocean Park Holdings Ltd., Herschend Family Entertainment, Hershey Entertainment and Resorts, KidZania S.A.P.I. de C.V., Landmark Group, Merlin Entertainments Ltd., Parques Reunidos SAU, Scene 75 Entertainment Centers, Six Flags Entertainment Corp., Sky Zone LLC, TEEG Australia Pty Ltd., The Walt Disney Co. and United Parks and Resorts Inc.

Market Research Insights

  • The Amusement Center Market is undergoing rapid modernization driven by robust entertainment infrastructure development and shifting consumer behavior. Venues transitioning from traditional arcades to immersive thematic environments have recorded a 28% improvement in repeat visitation rates, reflecting strong alignment with modern experiential spending trends.
  • Furthermore, the strategic deployment of integrated food and beverage services alongside interactive attractions has yielded a 15% increase in secondary per-capita spending. By leveraging data analytics to refine game mixes and optimize floor layouts, operators have achieved a 22% reduction in equipment downtime.
  • These targeted operational enhancements ensure that facilities remain competitive, maximizing overall profitability while continuously adapting to the evolving demands of the active leisure and recreation demographic.

We can help! Our analysts can customize this amusement center market research report to meet your requirements.

Get in touch

1. Executive Summary

1.1 Market overview

Executive Summary - Chart on Market Overview
Executive Summary - Data Table on Market Overview
Executive Summary - Chart on Global Market Characteristics
Executive Summary - Chart on Market by Geography
Executive Summary - Chart on Market Segmentation by Type
Executive Summary - Chart on Market Segmentation by Age Group
Executive Summary - Chart on Market Segmentation by Revenue
Executive Summary - Chart on Incremental Growth
Executive Summary - Data Table on Incremental Growth
Executive Summary - Chart on Company Market Positioning

2. Technavio Analysis

2.1 Analysis of price sensitivity, lifecycle, customer purchase basket, adoption rates, and purchase criteria

2.2 Criticality of inputs and Factors of differentiation

Chart on Overview on criticality of inputs and factors of differentiation

2.3 Factors of disruption

Chart on Overview on factors of disruption

2.4 Impact of drivers and challenges

Chart on Impact of drivers and challenges in 2025 and 2030

3. Market Landscape

3.1 Market ecosystem

Chart on Parent Market
Data Table on - Parent Market

3.2 Market characteristics

Chart on Market characteristics analysis

3.3 Value chain analysis

Chart on Value chain analysis

4. Market Sizing

4.1 Market definition

Data Table on Offerings of companies included in the market definition

4.2 Market segment analysis

Market segments

4.3 Market size 2025

4.4 Market outlook: Forecast for 2025-2030

Chart on Global - Market size and forecast 2025-2030 ($ thousand)
Data Table on Global - Market size and forecast 2025-2030 ($ thousand)
Chart on Global Market: Year-over-year growth 2025-2030 (%)
Data Table on Global Market: Year-over-year growth 2025-2030 (%)

5. Historic Market Size

5.1 Global Amusement Center Market 2020 - 2024

Historic Market Size - Data Table on Global Amusement Center Market 2020 - 2024 ($ thousand)

5.2 Type segment analysis 2020 - 2024

Historic Market Size - Type Segment 2020 - 2024 ($ thousand)

5.3 Age Group segment analysis 2020 - 2024

Historic Market Size - Age Group Segment 2020 - 2024 ($ thousand)

5.4 Revenue segment analysis 2020 - 2024

Historic Market Size - Revenue Segment 2020 - 2024 ($ thousand)

5.5 Geography segment analysis 2020 - 2024

Historic Market Size - Geography Segment 2020 - 2024 ($ thousand)

5.6 Country segment analysis 2020 - 2024

Historic Market Size - Country Segment 2020 - 2024 ($ thousand)

6. Qualitative Analysis

6.1 Impact of AI on Global Amusement Center Market

6.2 Impact of Geopolitical Conflicts on Global Amusement Center Market

7. Five Forces Analysis

7.1 Five forces summary

Five forces analysis - Comparison between 2025 and 2030

7.2 Bargaining power of buyers

Bargaining power of buyers - Impact of key factors 2025 and 2030

7.3 Bargaining power of suppliers

Bargaining power of suppliers - Impact of key factors in 2025 and 2030

7.4 Threat of new entrants

Threat of new entrants - Impact of key factors in 2025 and 2030

7.5 Threat of substitutes

Threat of substitutes - Impact of key factors in 2025 and 2030

7.6 Threat of rivalry

Threat of rivalry - Impact of key factors in 2025 and 2030

7.7 Market condition

Chart on Market condition - Five forces 2025 and 2030

8. Market Segmentation by Type

8.1 Market segments

Chart on Type - Market share 2025-2030 (%)
Data Table on Type - Market share 2025-2030 (%)

8.2 Comparison by Type

Chart on Comparison by Type
Data Table on Comparison by Type

8.3 Amusement parks - Market size and forecast 2025-2030

Chart on Amusement parks - Market size and forecast 2025-2030 ($ thousand)
Data Table on Amusement parks - Market size and forecast 2025-2030 ($ thousand)
Chart on Amusement parks - Year-over-year growth 2025-2030 (%)
Data Table on Amusement parks - Year-over-year growth 2025-2030 (%)

8.4 Family entertainment centers - Market size and forecast 2025-2030

Chart on Family entertainment centers - Market size and forecast 2025-2030 ($ thousand)
Data Table on Family entertainment centers - Market size and forecast 2025-2030 ($ thousand)
Chart on Family entertainment centers - Year-over-year growth 2025-2030 (%)
Data Table on Family entertainment centers - Year-over-year growth 2025-2030 (%)

8.5 Water parks - Market size and forecast 2025-2030

Chart on Water parks - Market size and forecast 2025-2030 ($ thousand)
Data Table on Water parks - Market size and forecast 2025-2030 ($ thousand)
Chart on Water parks - Year-over-year growth 2025-2030 (%)
Data Table on Water parks - Year-over-year growth 2025-2030 (%)

8.6 Arcade centers - Market size and forecast 2025-2030

Chart on Arcade centers - Market size and forecast 2025-2030 ($ thousand)
Data Table on Arcade centers - Market size and forecast 2025-2030 ($ thousand)
Chart on Arcade centers - Year-over-year growth 2025-2030 (%)
Data Table on Arcade centers - Year-over-year growth 2025-2030 (%)

8.7 Market opportunity by Type

Market opportunity by Type ($ thousand)
Data Table on Market opportunity by Type ($ thousand)

9. Market Segmentation by Age Group

9.1 Market segments

Chart on Age Group - Market share 2025-2030 (%)
Data Table on Age Group - Market share 2025-2030 (%)

9.2 Comparison by Age Group

Chart on Comparison by Age Group
Data Table on Comparison by Age Group

9.3 Adults - Market size and forecast 2025-2030

Chart on Adults - Market size and forecast 2025-2030 ($ thousand)
Data Table on Adults - Market size and forecast 2025-2030 ($ thousand)
Chart on Adults - Year-over-year growth 2025-2030 (%)
Data Table on Adults - Year-over-year growth 2025-2030 (%)

9.4 Children - Market size and forecast 2025-2030

Chart on Children - Market size and forecast 2025-2030 ($ thousand)
Data Table on Children - Market size and forecast 2025-2030 ($ thousand)
Chart on Children - Year-over-year growth 2025-2030 (%)
Data Table on Children - Year-over-year growth 2025-2030 (%)

9.5 Teens - Market size and forecast 2025-2030

Chart on Teens - Market size and forecast 2025-2030 ($ thousand)
Data Table on Teens - Market size and forecast 2025-2030 ($ thousand)
Chart on Teens - Year-over-year growth 2025-2030 (%)
Data Table on Teens - Year-over-year growth 2025-2030 (%)

9.6 Seniors - Market size and forecast 2025-2030

Chart on Seniors - Market size and forecast 2025-2030 ($ thousand)
Data Table on Seniors - Market size and forecast 2025-2030 ($ thousand)
Chart on Seniors - Year-over-year growth 2025-2030 (%)
Data Table on Seniors - Year-over-year growth 2025-2030 (%)

9.7 Market opportunity by Age Group

Market opportunity by Age Group ($ thousand)
Data Table on Market opportunity by Age Group ($ thousand)

10. Market Segmentation by Revenue

10.1 Market segments

Chart on Revenue - Market share 2025-2030 (%)
Data Table on Revenue - Market share 2025-2030 (%)

10.2 Comparison by Revenue

Chart on Comparison by Revenue
Data Table on Comparison by Revenue

10.3 Ticket - Market size and forecast 2025-2030

Chart on Ticket - Market size and forecast 2025-2030 ($ thousand)
Data Table on Ticket - Market size and forecast 2025-2030 ($ thousand)
Chart on Ticket - Year-over-year growth 2025-2030 (%)
Data Table on Ticket - Year-over-year growth 2025-2030 (%)

10.4 Food and beverage - Market size and forecast 2025-2030

Chart on Food and beverage - Market size and forecast 2025-2030 ($ thousand)
Data Table on Food and beverage - Market size and forecast 2025-2030 ($ thousand)
Chart on Food and beverage - Year-over-year growth 2025-2030 (%)
Data Table on Food and beverage - Year-over-year growth 2025-2030 (%)

10.5 Merchandise - Market size and forecast 2025-2030

Chart on Merchandise - Market size and forecast 2025-2030 ($ thousand)
Data Table on Merchandise - Market size and forecast 2025-2030 ($ thousand)
Chart on Merchandise - Year-over-year growth 2025-2030 (%)
Data Table on Merchandise - Year-over-year growth 2025-2030 (%)

10.6 Membership - Market size and forecast 2025-2030

Chart on Membership - Market size and forecast 2025-2030 ($ thousand)
Data Table on Membership - Market size and forecast 2025-2030 ($ thousand)
Chart on Membership - Year-over-year growth 2025-2030 (%)
Data Table on Membership - Year-over-year growth 2025-2030 (%)

10.7 Others - Market size and forecast 2025-2030

Chart on Others - Market size and forecast 2025-2030 ($ thousand)
Data Table on Others - Market size and forecast 2025-2030 ($ thousand)
Chart on Others - Year-over-year growth 2025-2030 (%)
Data Table on Others - Year-over-year growth 2025-2030 (%)

10.8 Market opportunity by Revenue

Market opportunity by Revenue ($ thousand)
Data Table on Market opportunity by Revenue ($ thousand)

11. Customer Landscape

11.1 Customer landscape overview

Analysis of price sensitivity, lifecycle, customer purchase basket, adoption rates, and purchase criteria

12. Geographic Landscape

12.1 Geographic segmentation

Chart on Market share by geography 2025-2030 (%)
Data Table on Market share by geography 2025-2030 (%)

12.2 Geographic comparison

Chart on Geographic comparison
Data Table on Geographic comparison

12.3 North America - Market size and forecast 2025-2030

Chart on North America - Market size and forecast 2025-2030 ($ thousand)
Data Table on North America - Market size and forecast 2025-2030 ($ thousand)
Chart on North America - Year-over-year growth 2025-2030 (%)
Data Table on North America - Year-over-year growth 2025-2030 (%)
Chart on Regional Comparison - North America
Data Table on Regional Comparison - North America

12.3.1 US - Market size and forecast 2025-2030

Chart on US - Market size and forecast 2025-2030 ($ thousand)
Data Table on US - Market size and forecast 2025-2030 ($ thousand)
Chart on US - Year-over-year growth 2025-2030 (%)
Data Table on US - Year-over-year growth 2025-2030 (%)

12.3.2 Canada - Market size and forecast 2025-2030

Chart on Canada - Market size and forecast 2025-2030 ($ thousand)
Data Table on Canada - Market size and forecast 2025-2030 ($ thousand)
Chart on Canada - Year-over-year growth 2025-2030 (%)
Data Table on Canada - Year-over-year growth 2025-2030 (%)

12.3.3 Mexico - Market size and forecast 2025-2030

Chart on Mexico - Market size and forecast 2025-2030 ($ thousand)
Data Table on Mexico - Market size and forecast 2025-2030 ($ thousand)
Chart on Mexico - Year-over-year growth 2025-2030 (%)
Data Table on Mexico - Year-over-year growth 2025-2030 (%)

12.4 APAC - Market size and forecast 2025-2030

Chart on APAC - Market size and forecast 2025-2030 ($ thousand)
Data Table on APAC - Market size and forecast 2025-2030 ($ thousand)
Chart on APAC - Year-over-year growth 2025-2030 (%)
Data Table on APAC - Year-over-year growth 2025-2030 (%)
Chart on Regional Comparison - APAC
Data Table on Regional Comparison - APAC

12.4.1 China - Market size and forecast 2025-2030

Chart on China - Market size and forecast 2025-2030 ($ thousand)
Data Table on China - Market size and forecast 2025-2030 ($ thousand)
Chart on China - Year-over-year growth 2025-2030 (%)
Data Table on China - Year-over-year growth 2025-2030 (%)

12.4.2 Japan - Market size and forecast 2025-2030

Chart on Japan - Market size and forecast 2025-2030 ($ thousand)
Data Table on Japan - Market size and forecast 2025-2030 ($ thousand)
Chart on Japan - Year-over-year growth 2025-2030 (%)
Data Table on Japan - Year-over-year growth 2025-2030 (%)

12.4.3 India - Market size and forecast 2025-2030

Chart on India - Market size and forecast 2025-2030 ($ thousand)
Data Table on India - Market size and forecast 2025-2030 ($ thousand)
Chart on India - Year-over-year growth 2025-2030 (%)
Data Table on India - Year-over-year growth 2025-2030 (%)

12.4.4 South Korea - Market size and forecast 2025-2030

Chart on South Korea - Market size and forecast 2025-2030 ($ thousand)
Data Table on South Korea - Market size and forecast 2025-2030 ($ thousand)
Chart on South Korea - Year-over-year growth 2025-2030 (%)
Data Table on South Korea - Year-over-year growth 2025-2030 (%)

12.4.5 Australia - Market size and forecast 2025-2030

Chart on Australia - Market size and forecast 2025-2030 ($ thousand)
Data Table on Australia - Market size and forecast 2025-2030 ($ thousand)
Chart on Australia - Year-over-year growth 2025-2030 (%)
Data Table on Australia - Year-over-year growth 2025-2030 (%)

12.4.6 Indonesia - Market size and forecast 2025-2030

Chart on Indonesia - Market size and forecast 2025-2030 ($ thousand)
Data Table on Indonesia - Market size and forecast 2025-2030 ($ thousand)
Chart on Indonesia - Year-over-year growth 2025-2030 (%)
Data Table on Indonesia - Year-over-year growth 2025-2030 (%)

12.5 Europe - Market size and forecast 2025-2030

Chart on Europe - Market size and forecast 2025-2030 ($ thousand)
Data Table on Europe - Market size and forecast 2025-2030 ($ thousand)
Chart on Europe - Year-over-year growth 2025-2030 (%)
Data Table on Europe - Year-over-year growth 2025-2030 (%)
Chart on Regional Comparison - Europe
Data Table on Regional Comparison - Europe

12.5.1 Germany - Market size and forecast 2025-2030

Chart on Germany - Market size and forecast 2025-2030 ($ thousand)
Data Table on Germany - Market size and forecast 2025-2030 ($ thousand)
Chart on Germany - Year-over-year growth 2025-2030 (%)
Data Table on Germany - Year-over-year growth 2025-2030 (%)

12.5.2 UK - Market size and forecast 2025-2030

Chart on UK - Market size and forecast 2025-2030 ($ thousand)
Data Table on UK - Market size and forecast 2025-2030 ($ thousand)
Chart on UK - Year-over-year growth 2025-2030 (%)
Data Table on UK - Year-over-year growth 2025-2030 (%)

12.5.3 France - Market size and forecast 2025-2030

Chart on France - Market size and forecast 2025-2030 ($ thousand)
Data Table on France - Market size and forecast 2025-2030 ($ thousand)
Chart on France - Year-over-year growth 2025-2030 (%)
Data Table on France - Year-over-year growth 2025-2030 (%)

12.5.4 Italy - Market size and forecast 2025-2030

Chart on Italy - Market size and forecast 2025-2030 ($ thousand)
Data Table on Italy - Market size and forecast 2025-2030 ($ thousand)
Chart on Italy - Year-over-year growth 2025-2030 (%)
Data Table on Italy - Year-over-year growth 2025-2030 (%)

12.5.5 Spain - Market size and forecast 2025-2030

Chart on Spain - Market size and forecast 2025-2030 ($ thousand)
Data Table on Spain - Market size and forecast 2025-2030 ($ thousand)
Chart on Spain - Year-over-year growth 2025-2030 (%)
Data Table on Spain - Year-over-year growth 2025-2030 (%)

12.5.6 The Netherlands - Market size and forecast 2025-2030

Chart on The Netherlands - Market size and forecast 2025-2030 ($ thousand)
Data Table on The Netherlands - Market size and forecast 2025-2030 ($ thousand)
Chart on The Netherlands - Year-over-year growth 2025-2030 (%)
Data Table on The Netherlands - Year-over-year growth 2025-2030 (%)

12.6 South America - Market size and forecast 2025-2030

Chart on South America - Market size and forecast 2025-2030 ($ thousand)
Data Table on South America - Market size and forecast 2025-2030 ($ thousand)
Chart on South America - Year-over-year growth 2025-2030 (%)
Data Table on South America - Year-over-year growth 2025-2030 (%)
Chart on Regional Comparison - South America
Data Table on Regional Comparison - South America

12.6.1 Brazil - Market size and forecast 2025-2030

Chart on Brazil - Market size and forecast 2025-2030 ($ thousand)
Data Table on Brazil - Market size and forecast 2025-2030 ($ thousand)
Chart on Brazil - Year-over-year growth 2025-2030 (%)
Data Table on Brazil - Year-over-year growth 2025-2030 (%)

12.6.2 Argentina - Market size and forecast 2025-2030

Chart on Argentina - Market size and forecast 2025-2030 ($ thousand)
Data Table on Argentina - Market size and forecast 2025-2030 ($ thousand)
Chart on Argentina - Year-over-year growth 2025-2030 (%)
Data Table on Argentina - Year-over-year growth 2025-2030 (%)

12.6.3 Chile - Market size and forecast 2025-2030

Chart on Chile - Market size and forecast 2025-2030 ($ thousand)
Data Table on Chile - Market size and forecast 2025-2030 ($ thousand)
Chart on Chile - Year-over-year growth 2025-2030 (%)
Data Table on Chile - Year-over-year growth 2025-2030 (%)

12.7 Middle East and Africa - Market size and forecast 2025-2030

Chart on Middle East and Africa - Market size and forecast 2025-2030 ($ thousand)
Data Table on Middle East and Africa - Market size and forecast 2025-2030 ($ thousand)
Chart on Middle East and Africa - Year-over-year growth 2025-2030 (%)
Data Table on Middle East and Africa - Year-over-year growth 2025-2030 (%)
Chart on Regional Comparison - Middle East and Africa
Data Table on Regional Comparison - Middle East and Africa

12.7.1 Saudi Arabia - Market size and forecast 2025-2030

Chart on Saudi Arabia - Market size and forecast 2025-2030 ($ thousand)
Data Table on Saudi Arabia - Market size and forecast 2025-2030 ($ thousand)
Chart on Saudi Arabia - Year-over-year growth 2025-2030 (%)
Data Table on Saudi Arabia - Year-over-year growth 2025-2030 (%)

12.7.2 UAE - Market size and forecast 2025-2030

Chart on UAE - Market size and forecast 2025-2030 ($ thousand)
Data Table on UAE - Market size and forecast 2025-2030 ($ thousand)
Chart on UAE - Year-over-year growth 2025-2030 (%)
Data Table on UAE - Year-over-year growth 2025-2030 (%)

12.7.3 South Africa - Market size and forecast 2025-2030

Chart on South Africa - Market size and forecast 2025-2030 ($ thousand)
Data Table on South Africa - Market size and forecast 2025-2030 ($ thousand)
Chart on South Africa - Year-over-year growth 2025-2030 (%)
Data Table on South Africa - Year-over-year growth 2025-2030 (%)

12.7.4 Israel - Market size and forecast 2025-2030

Chart on Israel - Market size and forecast 2025-2030 ($ thousand)
Data Table on Israel - Market size and forecast 2025-2030 ($ thousand)
Chart on Israel - Year-over-year growth 2025-2030 (%)
Data Table on Israel - Year-over-year growth 2025-2030 (%)

12.7.5 Turkey - Market size and forecast 2025-2030

Chart on Turkey - Market size and forecast 2025-2030 ($ thousand)
Data Table on Turkey - Market size and forecast 2025-2030 ($ thousand)
Chart on Turkey - Year-over-year growth 2025-2030 (%)
Data Table on Turkey - Year-over-year growth 2025-2030 (%)

12.8 Market opportunity by geography

Market opportunity by geography ($ thousand)
Data Tables on Market opportunity by geography ($ thousand)

13. Drivers, Challenges, and Opportunity

13.1 Market drivers

Rising disposable income is driving market growth
Increased international tourism
Growing adoption of virtual reality and immersive attractions

13.2 Market challenges

Strict safety regulations imposed by government
Occurrence of fatal accidents
Closure due to bankruptcy

13.3 Impact of drivers and challenges

Impact of drivers and challenges in 2025 and 2030

13.4 Market opportunities

Expansion of indoor amusement centers
Product innovations are expediting market growth
Strategic partnerships are accelerating market prosperity

14. Competitive Landscape

14.1 Overview

14.2

Overview on criticality of inputs and factors of differentiation

14.3 Landscape disruption

Overview on factors of disruption

14.4 Industry risks

Impact of key risks on business

15. Competitive Analysis

15.1 Companies profiled

Companies covered

15.2 Company ranking index

15.3 Market positioning of companies

Matrix on companies position and classification

15.4 Aspro Parks SA

Aspro Parks SA - Overview
Aspro Parks SA - Product / Service
Aspro Parks SA - Key offerings
SWOT

15.5 Bowlero Corp.

Bowlero Corp. - Overview
Bowlero Corp. - Product / Service
Bowlero Corp. - Key offerings
SWOT

15.6 CEC Entertainment Concepts L.P.

CEC Entertainment Concepts L.P. - Overview
CEC Entertainment Concepts L.P. - Product / Service
CEC Entertainment Concepts L.P. - Key offerings
SWOT

15.7 Chimelong Group Co. Ltd.

Chimelong Group Co. Ltd. - Overview
Chimelong Group Co. Ltd. - Product / Service
Chimelong Group Co. Ltd. - Key offerings
SWOT

15.8 Compagnie des Alpes

Compagnie des Alpes - Overview
Compagnie des Alpes - Business segments
Compagnie des Alpes - Key offerings
Compagnie des Alpes - Segment focus
SWOT

15.9 Dave and Busters Entertainment

Dave and Busters Entertainment - Overview
Dave and Busters Entertainment - Product / Service
Dave and Busters Entertainment - Key offerings
SWOT

15.10 Fantawild Holdings Inc.

Fantawild Holdings Inc. - Overview
Fantawild Holdings Inc. - Product / Service
Fantawild Holdings Inc. - Key offerings
SWOT

15.11 Great Wolf Resorts Inc.

Great Wolf Resorts Inc. - Overview
Great Wolf Resorts Inc. - Product / Service
Great Wolf Resorts Inc. - Key offerings
SWOT

15.12 Haichang Ocean Park Holdings Ltd.

Haichang Ocean Park Holdings Ltd. - Overview
Haichang Ocean Park Holdings Ltd. - Business segments
Haichang Ocean Park Holdings Ltd. - Key offerings
Haichang Ocean Park Holdings Ltd. - Segment focus
SWOT

15.13 Herschend Family Entertainment

Herschend Family Entertainment - Overview
Herschend Family Entertainment - Product / Service
Herschend Family Entertainment - Key offerings
SWOT

15.14 Hershey Entertainment and Resorts

Hershey Entertainment and Resorts - Overview
Hershey Entertainment and Resorts - Product / Service
Hershey Entertainment and Resorts - Key offerings
SWOT

15.15 Parques Reunidos SAU

Parques Reunidos SAU - Overview
Parques Reunidos SAU - Product / Service
Parques Reunidos SAU - Key offerings
SWOT

15.16 Six Flags Entertainment Corp.

Six Flags Entertainment Corp. - Overview
Six Flags Entertainment Corp. - Product / Service
Six Flags Entertainment Corp. - Key offerings
SWOT

15.17 The Walt Disney Co.

The Walt Disney Co. - Overview
The Walt Disney Co. - Business segments
The Walt Disney Co. - Key offerings
The Walt Disney Co. - Segment focus
SWOT

15.18 United Parks and Resorts Inc.

United Parks and Resorts Inc. - Overview
United Parks and Resorts Inc. - Product / Service
United Parks and Resorts Inc. - Key offerings
SWOT

16. Appendix

16.1 Scope of the report

Market definition
Objectives
Notes and caveats

16.2 Inclusions and exclusions checklist

Inclusions checklist
Exclusions checklist

16.3 Currency conversion rates for US$

16.4 Research methodology

16.5 Data procurement

Information sources

16.6 Data validation

16.7 Validation techniques employed for market sizing

16.8 Data synthesis

16.9 360 degree market analysis

16.10 List of abbreviations

Research Methodology

Technavio presents a detailed picture of the market by way of study, synthesis, and summation of data from multiple sources. The analysts have presented the various facets of the market with a particular focus on identifying the key industry influencers. The data thus presented is comprehensive, reliable, and the result of extensive research, both primary and secondary.

INFORMATION SOURCES

Primary sources

  • Manufacturers and suppliers
  • Channel partners
  • Industry experts
  • Strategic decision makers

Secondary sources

  • Industry journals and periodicals
  • Government data
  • Financial reports of key industry players
  • Historical data
  • Press releases

DATA ANALYSIS

Data Synthesis

  • Collation of data
  • Estimation of key figures
  • Analysis of derived insights

Data Validation

  • Triangulation with data models
  • Reference against proprietary databases
  • Corroboration with industry experts

REPORT WRITING

Qualitative

  • Market drivers
  • Market challenges
  • Market trends
  • Five forces analysis

Quantitative

  • Market size and forecast
  • Market segmentation
  • Geographical insights
  • Competitive landscape

Interested in this report?

Get your sample now to see our research methodology and insights!

Download Now

Frequently Asked Questions

Amusement Center market growth will increase by USD 139809.8 thousand thousand during 2026-2030.

The Amusement Center market is expected to grow at a CAGR of 12.7% during 2026-2030.

Amusement Center market is segmented by Type (Amusement parks, Family entertainment centers, Water parks, Arcade centers) Age group (Adults, Children, Teens, Seniors) Revenue (Ticket, Food and beverage, Merchandise, Membership, Others)

Aspro Parks SA, Bowlero Corp., CEC Entertainment Concepts L.P., Chimelong Group Co. Ltd., Compagnie des Alpes, Dave and Busters Entertainment, Fantawild Holdings Inc., Great Wolf Resorts Inc., Haichang Ocean Park Holdings Ltd., Herschend Family Entertainment, Hershey Entertainment and Resorts, KidZania S.A.P.I. de C.V., Landmark Group, Merlin Entertainments Ltd., Parques Reunidos SAU, Scene 75 Entertainment Centers, Six Flags Entertainment Corp., Sky Zone LLC, TEEG Australia Pty Ltd., The Walt Disney Co., United Parks and Resorts Inc. are a few of the key vendors in the Amusement Center market.

North America will register the highest growth rate of 35.9% among the other regions. Therefore, the Amusement Center market in North America is expected to garner significant business opportunities for the vendors during the forecast period.

US, Canada, Mexico, China, Japan, India, South Korea, Australia, Indonesia, Germany, UK, France, Italy, Spain, The Netherlands, Brazil, Argentina, Chile, Saudi Arabia, UAE, South Africa, Israel, Turkey

  • Rising disposable income is driving market growth is the driving factor this market.

The Amusement Center market vendors should focus on grabbing business opportunities from the Type segment as it accounted for the largest market share in the base year.
RIA - Research AI Assistant
Ask RIA
