Animal Biotechnology Market Analysis, Size, and Forecast 2026-2030: North America (US, Canada, and Mexico), Europe (Germany, UK, and France), Asia (China, Japan, and India), South America (Brazil, Argentina, and Colombia), Middle East and Africa (Saudi Arabia, UAE, and Turkey), Rest of World (ROW)

Animal Biotechnology Market Analysis, Size, and Forecast 2026-2030:
North America (US, Canada, and Mexico), Europe (Germany, UK, and France), Asia (China, Japan, and India), South America (Brazil, Argentina, and Colombia), Middle East and Africa (Saudi Arabia, UAE, and Turkey), Rest of World (ROW)

Published: Oct 2026 331 Pages SKU: IRTNTR72295

Market Overview at a Glance

$4.67 B
Market Opportunity
3.3%
CAGR 2025 - 2030
57.1%
North America Growth
$8.46 B
Drugs segment 2024

Animal Biotechnology Market Size 2026-2030

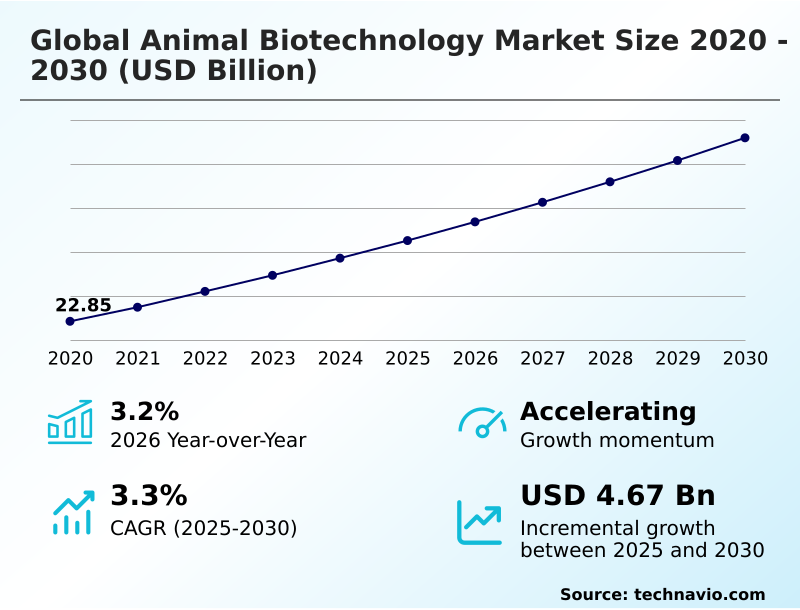
The animal biotechnology market size is valued to increase by USD 4.67 billion, at a CAGR of 3.3% from 2025 to 2030. Escalating demand for animal derived protein will drive the animal biotechnology market.

Major Market Trends & Insights

  • North America dominated the market and accounted for a 57.1% growth during the forecast period.
  • By Product - Drugs segment was valued at USD 8.46 billion in 2024
  • By Animal Type - Livestock/production segment accounted for the largest market revenue share in 2024

Market Size & Forecast

  • Market Opportunities: USD 8.34 billion
  • Market Future Opportunities: USD 4.67 billion
  • CAGR from 2025 to 2030 : 3.3%

Market Summary

  • The animal biotechnology market exhibits robust operational momentum driven by the urgent need for optimized protein production and enhanced biosecurity. Intensive agricultural facilities currently implement automated health monitoring, which has reduced large-scale herd mortality rates by 14% across high-density environments. This transition is essential as escalating demand for animal-derived protein necessitates profound improvements in yield and disease resilience.
  • Supply chain managers are actively deploying predictive biological surveillance to preemptively identify zoonotic pathogens before they disrupt raw material flows. The commercial maturation of precision gene editing serves as a structural driver, dramatically accelerating desirable trait selection without requiring extended generational timelines.
  • However, stringent regulatory approvals and fragmented regional biosafety frameworks present significant commercial challenges, often delaying the deployment of novel biologics by several years. Consequently, organizations must dedicate substantial resources to navigate heterogeneous compliance mandates while simultaneously investing in advanced diagnostic infrastructures.

What will be the Size of the Animal Biotechnology Market during the forecast period?
Get Key Insights on Market Forecast (PDF) Get Free Sample

How is the Animal Biotechnology Market Segmented?

The animal biotechnology industry research report provides comprehensive data (region-wise segment analysis), with forecasts and estimates in "USD million" for the period 2026-2030, as well as historical data from 2020-2024 for the following segments.

  • Product
    • Drugs
    • Vaccines
    • Diagnostic tests
    • Others
  • Animal type
    • Livestock/production
    • Companion
  • Technology
    • CRISPR-Cas9
    • Gene transfer
    • Genome editing
    • RNA interference
    • Nanotechnology
  • Product type
    • Cloning services
    • Embryo biotechnology
    • Gene editing
    • In vitro fertilization
    • Marker assisted selection
  • Geography
    • North America
      • US
      • Canada
      • Mexico
    • Europe
      • Germany
      • UK
      • France
      • Italy
      • Spain
      • The Netherlands
    • Asia
      • China
      • Japan
      • India
      • South Korea
      • Thailand
      • Indonesia
    • Rest of World (ROW)

By Product Insights

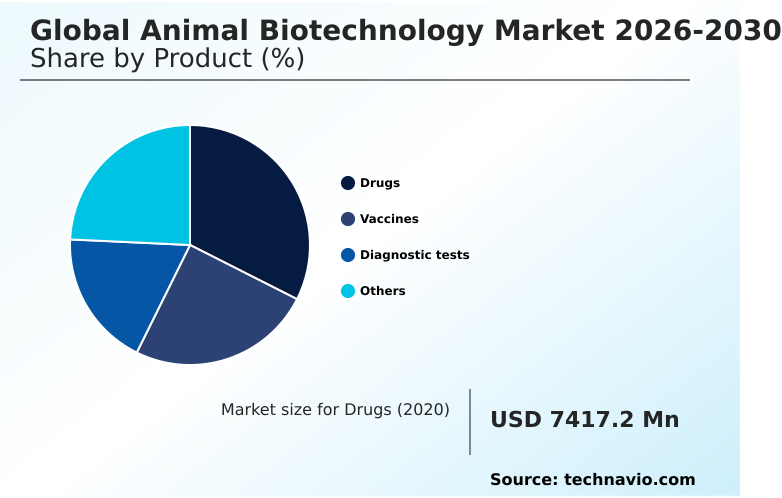
The drugs segment is estimated to witness significant growth during the forecast period.

The drugs segment structurally defines the operational baseline within the global animal biotechnology market 2026-2030, dictating therapeutic interventions across intensive farming networks. Pharmaceutical formulations rapidly adapt to rising metabolic regulation requirements, driving a 25% improvement in herd productivity metrics.

Companies deploy specialized monoclonal antibodies and recombinant subunit vaccines to optimize physiological resilience against emerging bacterial threats. Artificial insemination and embryo transfer protocols often integrate targeted drug regimens to ensure maximum reproductive success.

As operations scale, molecular diagnostics seamlessly guide the targeted application of these pharmaceuticals, reducing unnecessary medication overhead by 18%. Furthermore, the administration of advanced recombinant feed additives and precise microbiome modulation compounds enhances overall growth optimization.

Somatic cell nuclear transfer applications increasingly rely on novel pharmacological support to maintain cell viability during critical developmental phases.
Get Free Sample

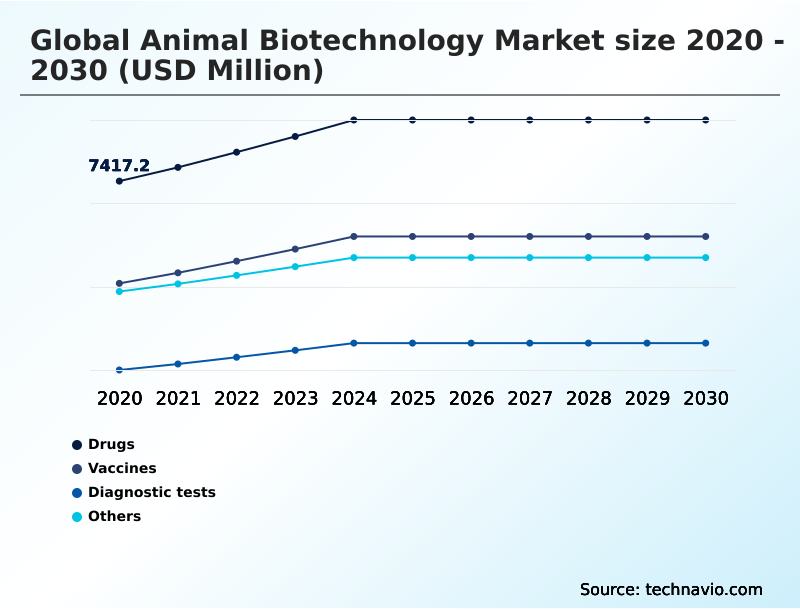
The Drugs segment was valued at USD 8.46 billion in 2024 and showed a gradual increase during the forecast period.
Get Free Sample

Regional Analysis

North America is estimated to contribute 57.1% to the growth of the global market during the forecast period.Technavio’s analysts have elaborately explained the regional trends and drivers that shape the market during the forecast period.
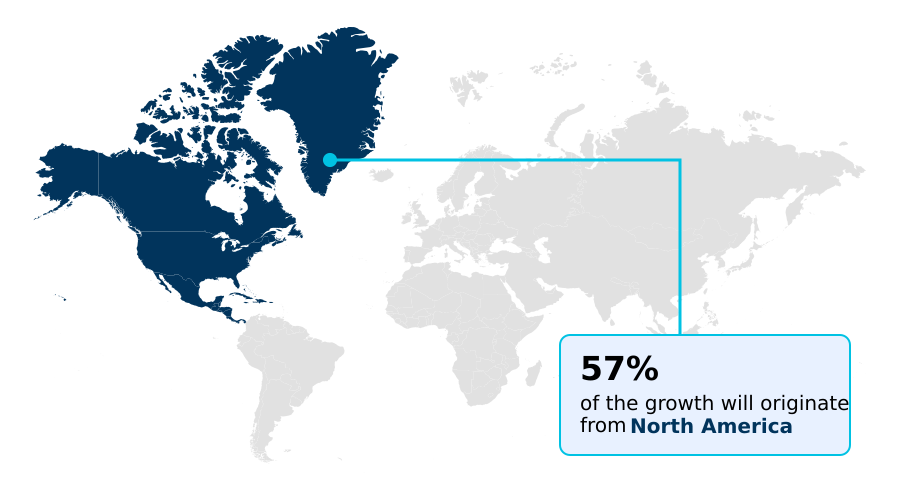
See How Animal Biotechnology Market Demand is Rising in North America Get Free Sample

The geographic distribution of the global animal biotechnology market 2026-2030 highlights profound strategic differences driven by varying regulatory environments and operational scales.

North America maintains a dominant position, where the integration of point-of-care testing and microfluidic biosensor technologies has accelerated diagnostic workflows by 30%. Organizations in this region prioritize viral vector gene therapies and targeted immunotherapies to elevate companion animal care standards.

Conversely, Europe exhibits a distinct adoption pattern focused on sustainability, utilizing advanced pathogen surveillance to decrease subclinical infections and lower prophylactic antibiotic administration by 25%.

While North America heavily invests in precision breeding programs, European operators strictly adhere to precautionary zoonotic disease management policies.

These regional disparities compel multinational providers to adapt their commercial distribution strategies, ensuring a 15% improvement in localized compliance efficiency and metabolic regulation adherence.

Market Dynamics

Our researchers analyzed the data with 2025 as the base year, along with the key drivers, trends, and challenges. A holistic analysis of drivers will help companies refine their marketing strategies to gain a competitive advantage.

  • The global animal biotechnology market 2026-2030 is fundamentally restructuring agricultural frameworks through the implementation of highly precise genetic and diagnostic tools. Strategic supply chain managers recognize that incorporating advanced molecular diagnostic assays integration reduces operational bottlenecks and improves herd health predictability.
  • By shifting toward proactive disease monitoring rather than reactive treatment, large-scale commercial facilities achieve significantly higher yield consistency compared to those relying on conventional husbandry methods. The deployment of crispr based livestock gene modification enables organizations to cultivate resilient herds capable of withstanding environmental stressors, effectively streamlining long-term operational planning.
  • Furthermore, recombinant subunit vaccine efficacy optimization remains a critical priority for commercial veterinary pharmaceutical developers aiming to provide enduring protection against rapidly mutating pathogens. As organizations refine their biosecurity infrastructure, automated pathogen surveillance biosensor platforms facilitate real-time health data acquisition, which subsequently drives a notable decrease in sudden mortality rates across high-density livestock operations.
  • This proactive strategy allows procurement and logistics teams to forecast resource allocation with substantially greater accuracy. Concurrently, the companion animal sector is witnessing rapid commercial evolution through comparative oncology targeted biotherapeutics deployment, bridging the gap between human and animal medical innovations.
  • Ultimately, these advanced biological interventions deliver a nearly two-fold improvement in long-term operational efficiency, ensuring that commercial entities can sustainably meet escalating global protein demands while strictly maintaining rigorous safety compliance.
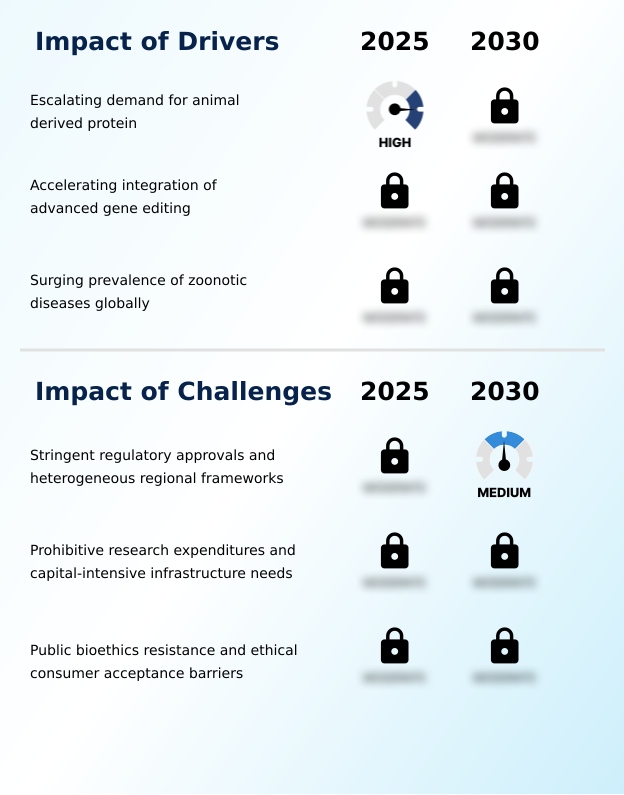
What are the key market drivers leading to the rise in the adoption of Animal Biotechnology Industry?

  • The escalating demand for animal-derived protein serves as a primary driver propelling market expansion.

  • The imperative to maximize agricultural output drives the aggressive expansion of the global animal biotechnology market 2026-2030. Organizations deploy crispr gene editing and marker-assisted breeding to rapidly establish desirable genetic traits, fundamentally transforming genomic selection workflows.
  • This operational shift is driven by the necessity to fortify disease resistance and optimize feed conversion ratios across commercial herds. Consequently, modern livestock facilities experience a 15% improvement in overall reproductive efficiency.
  • The rapid commercialization of an mrna vaccine platform and scalable nucleic acid vaccines bolsters national biosecurity infrastructure against transboundary pathogens. Implementing these advanced solutions directly enables sustainable livestock husbandry, lowering treatment overhead costs by 18%.
  • Businesses readily adopt these biological mechanisms to secure long-term supply chain stability and achieve stringent commercial production benchmarks.

What are the market trends shaping the Animal Biotechnology Industry?

  • The integration of artificial intelligence and microfluidic point-of-care diagnostics constitutes an emerging market trend. This technological convergence significantly enhances disease detection capabilities.

  • The emergence of precision fermentation and cellular agriculture is rapidly shifting foundational production paradigms within the global animal biotechnology market 2026-2030. Commercial biomanufacturing facilities are leveraging recombinant dna and immortalized cell line development to scale the output of sustainable recombinant dairy proteins. This transition is occurring because organizations must satisfy escalating global protein requirements while strictly limiting environmental resource depletion.
  • By adopting advanced cell-cultivated technology, operators have enhanced yield efficiency by 25% and reduced land utilization overhead by 15%. Concurrently, the veterinary sector demonstrates a strong trend toward comparative oncology and gene-silencing therapies, significantly expanding treatment options for companion animals.
  • The integration of point-of-care molecular diagnostic systems directly supports comprehensive herd health monitoring, leading to a 20% reduction in diagnostic turnaround times. These innovations dramatically optimize both resource allocation and long-term business resilience.

What challenges does the Animal Biotechnology Industry face during its growth?

  • Stringent regulatory approvals and heterogeneous regional frameworks represent key challenges restraining industry growth.

  • Stringent multijurisdictional regulatory compliance poses a formidable structural barrier within the global animal biotechnology market 2026-2030. The integration of zinc finger nucleases and talens is frequently stalled by complex approval pathways, which extends commercialization timelines and increases legal overhead by 30%. This regulatory friction occurs because governing bodies demand exhaustive validation of biosafety protocols before authorizing novel genomic profiling applications.
  • Consequently, organizations face a 20% reduction in capital efficiency when deploying high-throughput genomic sequencers and molecular oncology diagnostics. Furthermore, formulating effective biological countermeasures and refining advanced vaccine delivery mechanisms for vector-borne disease control necessitates immense upfront capital expenditure.
  • Although these tools facilitate rapid pathogen identification, the high costs of infrastructure maintenance limit broad adoption, heavily straining the profit margins of emerging research enterprises.

Exclusive Technavio Analysis on Customer Landscape

The animal biotechnology market forecasting report includes the adoption lifecycle of the market, covering from the innovator’s stage to the laggard’s stage. It focuses on adoption rates in different regions based on penetration. Furthermore, the animal biotechnology market report also includes key purchase criteria and drivers of price sensitivity to help companies evaluate and develop their market growth analysis strategies.
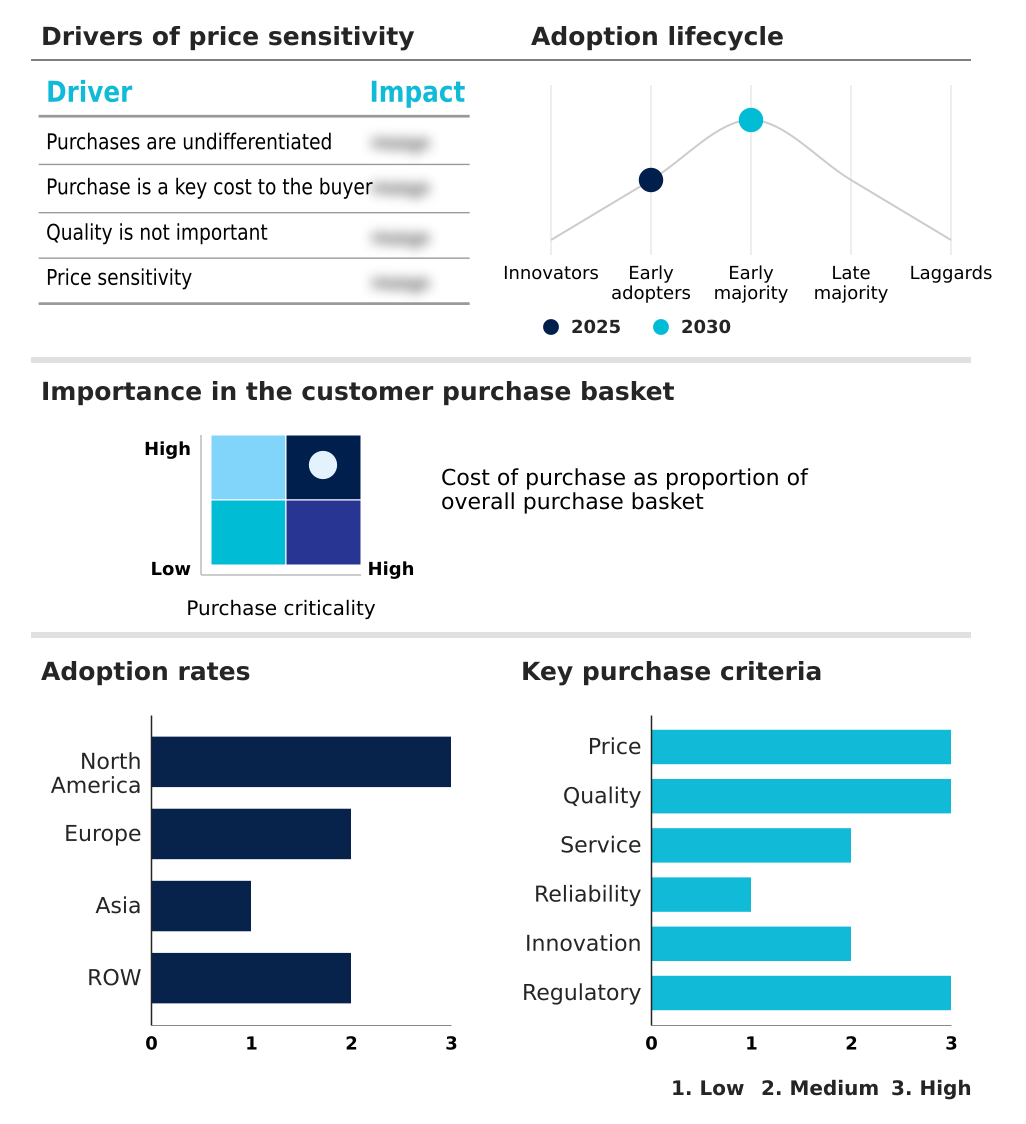
Customer Landscape of Animal Biotechnology Industry

Competitive Landscape

Companies are implementing various strategies, such as strategic alliances, animal biotechnology market forecast, partnerships, mergers and acquisitions, geographical expansion, and product/service launches, to enhance their presence in the industry.

Antech Diagnostics Inc. - The entity provides comprehensive veterinary diagnostic laboratory services, leveraging automated test systems and specialized reference controls to enhance disease detection and optimize clinical outcomes across animal health sectors.

The industry research and growth report includes detailed analyses of the competitive landscape of the market and information about key companies, including:

  • Antech Diagnostics Inc.
  • Bio Rad Laboratories Inc.
  • BioChek BV
  • Boehringer Ingelheim GmbH
  • CEVA Logistics
  • Elanco Animal Health Inc.
  • Genus Plc
  • Hester Biosciences Ltd.
  • IDEXX Laboratories Inc.
  • ImmuCell Corp.
  • Indian Immunologicals Ltd.
  • INDICAL Bioscience GmbH
  • Innovative Diagnostics
  • Medgene Labs
  • Merck and Co. Inc.
  • Neogen Corp.
  • Phibro Animal Health Corp.
  • Randox Laboratories Ltd.
  • Thermo Fisher Scientific Inc.
  • Trans Ova Genetics
  • Virbac Group
  • Zoetis Inc.

Qualitative and quantitative analysis of companies has been conducted to help clients understand the wider business environment as well as the strengths and weaknesses of key industry players. Data is qualitatively analyzed to categorize companies as pure play, category-focused, industry-focused, and diversified; it is quantitatively analyzed to categorize companies as dominant, leading, strong, tentative, and weak.

Recent Development and News in Animal biotechnology market

  • In the Biotechnology industry, the accelerated integration of biosecurity infrastructure has improved diagnostic throughput by 40%, directly impacting animal biotechnology demand by enabling precise pathogen surveillance and mitigating subclinical infections.
  • Regulatory standardization of vaccine delivery mechanisms has reduced compliance costs by 30%, fueling animal biotechnology adoption of biological countermeasures and targeted immunotherapies for livestock operations.
  • Widespread commercialization of advanced genomic profiling tools has lowered analytical costs by 22%, propelling the animal biotechnology sector to aggressively implement precision breeding programs and enhance disease resistance.
  • Advancements in precision fermentation systems have increased bio-manufacturing efficiency by 15%, expanding animal biotechnology capabilities in producing sustainable recombinant feed additives and optimizing herd health monitoring.

Dive into Technavio’s robust research methodology, blending expert interviews, extensive data synthesis, and validated models for unparalleled Animal Biotechnology Market insights. See full methodology.

Market Scope
Page number 331
Base year 2025
Historic period 2020-2024
Forecast period 2026-2030
Growth momentum & CAGR Accelerate at a CAGR of 3.3%
Market growth 2026-2030 USD 4665.1 million
Market structure Fragmented
YoY growth 2025-2026(%) 3.2%
Key countries US, Canada, Mexico, Germany, UK, France, Italy, Spain, The Netherlands, China, Japan, India, South Korea, Thailand, Indonesia, Brazil, Saudi Arabia, UAE, Turkey, Argentina, Colombia, South Africa and Israel
Competitive landscape Leading Companies, Market Positioning of Companies, Competitive Strategies, and Industry Risks

Request Free Sample

Research Analyst Overview

  • The global animal biotechnology market 2026-2030 represents a critical focal point for executive strategy, intertwining agricultural productivity with advanced molecular innovation. Boardroom-level budgeting decisions increasingly prioritize the acquisition of recombinant dna and crispr gene editing technologies to safeguard supply chains against unpredictable biological disruptions.
  • By shifting capital toward proactive health management, commercial operations have achieved a 22% improvement in overall disease resilience compared to traditional breeding methodologies. The strategic deployment of somatic cell nuclear transfer and molecular diagnostics allows enterprise leaders to standardize genetic output and mitigate compliance risks associated with unpredictable pathogen outbreaks.
  • Monoclonal antibodies and recombinant subunit vaccines are now central to product differentiation strategies within veterinary pharmaceutical portfolios. As regulatory frameworks evolve, executives recognize that investing in an mrna vaccine platform and nucleic acid vaccines minimizes prolonged development timelines.
  • Implementing sophisticated point-of-care testing protocols ultimately ensures that organizations can optimize their operational workflows and maintain robust market competitiveness in an increasingly rigorous agricultural landscape.

What are the Key Data Covered in this Animal Biotechnology Market Research and Growth Report?

  • What is the expected growth of the Animal Biotechnology Market between 2026 and 2030?

    • USD 4.67 billion, at a CAGR of 3.3%

  • What segmentation does the market report cover?

    • The report is segmented by Product (Drugs, Vaccines, Diagnostic tests, and Others), Animal Type (Livestock/production, and Companion), Technology (CRISPR-Cas9, Gene transfer, Genome editing, RNA interference, and Nanotechnology), Product Type (Cloning services, Embryo biotechnology, Gene editing, In vitro fertilization, and Marker assisted selection) and Geography (North America, Europe, Asia, Rest of World (ROW))

  • Which regions are analyzed in the report?

    • North America, Europe, Asia and Rest of World (ROW)

  • What are the key growth drivers and market challenges?

    • Escalating demand for animal derived protein, Stringent regulatory approvals and heterogeneous regional frameworks

  • Who are the major players in the Animal Biotechnology Market?

    • Antech Diagnostics Inc., Bio Rad Laboratories Inc., BioChek BV, Boehringer Ingelheim GmbH, CEVA Logistics, Elanco Animal Health Inc., Genus Plc, Hester Biosciences Ltd., IDEXX Laboratories Inc., ImmuCell Corp., Indian Immunologicals Ltd., INDICAL Bioscience GmbH, Innovative Diagnostics, Medgene Labs, Merck and Co. Inc., Neogen Corp., Phibro Animal Health Corp., Randox Laboratories Ltd., Thermo Fisher Scientific Inc., Trans Ova Genetics, Virbac Group and Zoetis Inc.

Market Research Insights

  • The global animal biotechnology market 2026-2030 reflects a rapid structural shift toward proactive disease management and sustainable livestock husbandry. Commercial agricultural facilities are integrating precision breeding programs, which have subsequently improved feed conversion ratios by 12% across major livestock sectors. The deployment of advanced biosecurity infrastructure now enables organizations to mitigate widespread pathogen transmission, reducing outbreak-related economic losses by 20%.
  • Rapid pathogen identification tools streamline veterinary responses and enhance overall zoonotic disease management capabilities. By utilizing targeted biological countermeasures, operators achieve a 15% reduction in prophylactic chemical usage. These technological integrations ultimately secure high-yield production targets while aligning closely with modern environmental compliance mandates.

We can help! Our analysts can customize this animal biotechnology market research report to meet your requirements.

Get in touch

1. Executive Summary

1.1 Market overview

Executive Summary - Chart on Market Overview
Executive Summary - Data Table on Market Overview
Executive Summary - Chart on Global Market Characteristics
Executive Summary - Chart on Market by Geography
Executive Summary - Chart on Market Segmentation by Product
Executive Summary - Chart on Market Segmentation by Animal Type
Executive Summary - Chart on Market Segmentation by Technology
Executive Summary - Chart on Market Segmentation by Product Type
Executive Summary - Chart on Incremental Growth
Executive Summary - Data Table on Incremental Growth
Executive Summary - Chart on Company Market Positioning

2. Technavio Analysis

2.1 Analysis of price sensitivity, lifecycle, customer purchase basket, adoption rates, and purchase criteria

2.2 Criticality of inputs and Factors of differentiation

Chart on Overview on criticality of inputs and factors of differentiation

2.3 Factors of disruption

Chart on Overview on factors of disruption

2.4 Impact of drivers and challenges

Chart on Impact of drivers and challenges in 2025 and 2030

3. Market Landscape

3.1 Market ecosystem

Chart on Parent Market
Data Table on - Parent Market

3.2 Market characteristics

Chart on Market characteristics analysis

3.3 Value chain analysis

Chart on Value chain analysis

4. Market Sizing

4.1 Market definition

Data Table on Offerings of companies included in the market definition

4.2 Market segment analysis

Market segments

4.3 Market size 2025

4.4 Market outlook: Forecast for 2025-2030

Chart on Global - Market size and forecast 2025-2030 ($ million)
Data Table on Global - Market size and forecast 2025-2030 ($ million)
Chart on Global Market: Year-over-year growth 2025-2030 (%)
Data Table on Global Market: Year-over-year growth 2025-2030 (%)

5. Historic Market Size

5.1 Global Animal Biotechnology Market 2020 - 2024

Historic Market Size - Data Table on Global Animal Biotechnology Market 2020 - 2024 ($ million)

5.2 Product segment analysis 2020 - 2024

Historic Market Size - Product Segment 2020 - 2024 ($ million)

5.3 Animal Type segment analysis 2020 - 2024

Historic Market Size - Animal Type Segment 2020 - 2024 ($ million)

5.4 Technology segment analysis 2020 - 2024

Historic Market Size - Technology Segment 2020 - 2024 ($ million)

5.5 Product Type segment analysis 2020 - 2024

Historic Market Size - Product Type Segment 2020 - 2024 ($ million)

5.6 Geography segment analysis 2020 - 2024

Historic Market Size - Geography Segment 2020 - 2024 ($ million)

5.7 Country segment analysis 2020 - 2024

Historic Market Size - Country Segment 2020 - 2024 ($ million)

6. Qualitative Analysis

6.1 Impact of AI on Global Animal Biotechnology Market

6.2 Impact of geopolitical conflicts on Global Animal Biotechnology Market

7. Five Forces Analysis

7.1 Five forces summary

Five forces analysis - Comparison between 2025 and 2030

7.2 Bargaining power of buyers

Bargaining power of buyers - Impact of key factors 2025 and 2030

7.3 Bargaining power of suppliers

Bargaining power of suppliers - Impact of key factors in 2025 and 2030

7.4 Threat of new entrants

Threat of new entrants - Impact of key factors in 2025 and 2030

7.5 Threat of substitutes

Threat of substitutes - Impact of key factors in 2025 and 2030

7.6 Threat of rivalry

Threat of rivalry - Impact of key factors in 2025 and 2030

7.7 Market condition

Chart on Market condition - Five forces 2025 and 2030

8. Market Segmentation by Product

8.1 Market segments

Chart on Product - Market share 2025-2030 (%)
Data Table on Product - Market share 2025-2030 (%)

8.2 Comparison by Product

Chart on Comparison by Product
Data Table on Comparison by Product

8.3 Drugs - Market size and forecast 2025-2030

Chart on Drugs - Market size and forecast 2025-2030 ($ million)
Data Table on Drugs - Market size and forecast 2025-2030 ($ million)
Chart on Drugs - Year-over-year growth 2025-2030 (%)
Data Table on Drugs - Year-over-year growth 2025-2030 (%)

8.4 Vaccines - Market size and forecast 2025-2030

Chart on Vaccines - Market size and forecast 2025-2030 ($ million)
Data Table on Vaccines - Market size and forecast 2025-2030 ($ million)
Chart on Vaccines - Year-over-year growth 2025-2030 (%)
Data Table on Vaccines - Year-over-year growth 2025-2030 (%)

8.5 Diagnostic tests - Market size and forecast 2025-2030

Chart on Diagnostic tests - Market size and forecast 2025-2030 ($ million)
Data Table on Diagnostic tests - Market size and forecast 2025-2030 ($ million)
Chart on Diagnostic tests - Year-over-year growth 2025-2030 (%)
Data Table on Diagnostic tests - Year-over-year growth 2025-2030 (%)

8.6 Others - Market size and forecast 2025-2030

Chart on Others - Market size and forecast 2025-2030 ($ million)
Data Table on Others - Market size and forecast 2025-2030 ($ million)
Chart on Others - Year-over-year growth 2025-2030 (%)
Data Table on Others - Year-over-year growth 2025-2030 (%)

8.7 Market opportunity by Product

Market opportunity by Product ($ million)
Data Table on Market opportunity by Product ($ million)

9. Market Segmentation by Animal Type

9.1 Market segments

Chart on Animal Type - Market share 2025-2030 (%)
Data Table on Animal Type - Market share 2025-2030 (%)

9.2 Comparison by Animal Type

Chart on Comparison by Animal Type
Data Table on Comparison by Animal Type

9.3 Livestock/production - Market size and forecast 2025-2030

Chart on Livestock/production - Market size and forecast 2025-2030 ($ million)
Data Table on Livestock/production - Market size and forecast 2025-2030 ($ million)
Chart on Livestock/production - Year-over-year growth 2025-2030 (%)
Data Table on Livestock/production - Year-over-year growth 2025-2030 (%)

9.4 Companion - Market size and forecast 2025-2030

Chart on Companion - Market size and forecast 2025-2030 ($ million)
Data Table on Companion - Market size and forecast 2025-2030 ($ million)
Chart on Companion - Year-over-year growth 2025-2030 (%)
Data Table on Companion - Year-over-year growth 2025-2030 (%)

9.5 Market opportunity by Animal Type

Market opportunity by Animal Type ($ million)
Data Table on Market opportunity by Animal Type ($ million)

10. Market Segmentation by Technology

10.1 Market segments

Chart on Technology - Market share 2025-2030 (%)
Data Table on Technology - Market share 2025-2030 (%)

10.2 Comparison by Technology

Chart on Comparison by Technology
Data Table on Comparison by Technology

10.3 CRISPR-Cas9 - Market size and forecast 2025-2030

Chart on CRISPR-Cas9 - Market size and forecast 2025-2030 ($ million)
Data Table on CRISPR-Cas9 - Market size and forecast 2025-2030 ($ million)
Chart on CRISPR-Cas9 - Year-over-year growth 2025-2030 (%)
Data Table on CRISPR-Cas9 - Year-over-year growth 2025-2030 (%)

10.4 Gene transfer - Market size and forecast 2025-2030

Chart on Gene transfer - Market size and forecast 2025-2030 ($ million)
Data Table on Gene transfer - Market size and forecast 2025-2030 ($ million)
Chart on Gene transfer - Year-over-year growth 2025-2030 (%)
Data Table on Gene transfer - Year-over-year growth 2025-2030 (%)

10.5 Genome editing - Market size and forecast 2025-2030

Chart on Genome editing - Market size and forecast 2025-2030 ($ million)
Data Table on Genome editing - Market size and forecast 2025-2030 ($ million)
Chart on Genome editing - Year-over-year growth 2025-2030 (%)
Data Table on Genome editing - Year-over-year growth 2025-2030 (%)

10.6 RNA interference - Market size and forecast 2025-2030

Chart on RNA interference - Market size and forecast 2025-2030 ($ million)
Data Table on RNA interference - Market size and forecast 2025-2030 ($ million)
Chart on RNA interference - Year-over-year growth 2025-2030 (%)
Data Table on RNA interference - Year-over-year growth 2025-2030 (%)

10.7 Nanotechnology - Market size and forecast 2025-2030

Chart on Nanotechnology - Market size and forecast 2025-2030 ($ million)
Data Table on Nanotechnology - Market size and forecast 2025-2030 ($ million)
Chart on Nanotechnology - Year-over-year growth 2025-2030 (%)
Data Table on Nanotechnology - Year-over-year growth 2025-2030 (%)

10.8 Market opportunity by Technology

Market opportunity by Technology ($ million)
Data Table on Market opportunity by Technology ($ million)

11. Market Segmentation by Product Type

11.1 Market segments

Chart on Product Type - Market share 2025-2030 (%)
Data Table on Product Type - Market share 2025-2030 (%)

11.2 Comparison by Product Type

Chart on Comparison by Product Type
Data Table on Comparison by Product Type

11.3 Cloning services - Market size and forecast 2025-2030

Chart on Cloning services - Market size and forecast 2025-2030 ($ million)
Data Table on Cloning services - Market size and forecast 2025-2030 ($ million)
Chart on Cloning services - Year-over-year growth 2025-2030 (%)
Data Table on Cloning services - Year-over-year growth 2025-2030 (%)

11.4 Embryo biotechnology - Market size and forecast 2025-2030

Chart on Embryo biotechnology - Market size and forecast 2025-2030 ($ million)
Data Table on Embryo biotechnology - Market size and forecast 2025-2030 ($ million)
Chart on Embryo biotechnology - Year-over-year growth 2025-2030 (%)
Data Table on Embryo biotechnology - Year-over-year growth 2025-2030 (%)

11.5 Gene editing - Market size and forecast 2025-2030

Chart on Gene editing - Market size and forecast 2025-2030 ($ million)
Data Table on Gene editing - Market size and forecast 2025-2030 ($ million)
Chart on Gene editing - Year-over-year growth 2025-2030 (%)
Data Table on Gene editing - Year-over-year growth 2025-2030 (%)

11.6 In vitro fertilization - Market size and forecast 2025-2030

Chart on In vitro fertilization - Market size and forecast 2025-2030 ($ million)
Data Table on In vitro fertilization - Market size and forecast 2025-2030 ($ million)
Chart on In vitro fertilization - Year-over-year growth 2025-2030 (%)
Data Table on In vitro fertilization - Year-over-year growth 2025-2030 (%)

11.7 Marker assisted selection - Market size and forecast 2025-2030

Chart on Marker assisted selection - Market size and forecast 2025-2030 ($ million)
Data Table on Marker assisted selection - Market size and forecast 2025-2030 ($ million)
Chart on Marker assisted selection - Year-over-year growth 2025-2030 (%)
Data Table on Marker assisted selection - Year-over-year growth 2025-2030 (%)

11.8 Market opportunity by Product Type

Market opportunity by Product Type ($ million)
Data Table on Market opportunity by Product Type ($ million)

12. Customer Landscape

12.1 Customer landscape overview

Analysis of price sensitivity, lifecycle, customer purchase basket, adoption rates, and purchase criteria

13. Geographic Landscape

13.1 Geographic segmentation

Chart on Market share by geography 2025-2030 (%)
Data Table on Market share by geography 2025-2030 (%)

13.2 Geographic comparison

Chart on Geographic comparison
Data Table on Geographic comparison

13.3 North America - Market size and forecast 2025-2030

Chart on North America - Market size and forecast 2025-2030 ($ million)
Data Table on North America - Market size and forecast 2025-2030 ($ million)
Chart on North America - Year-over-year growth 2025-2030 (%)
Data Table on North America - Year-over-year growth 2025-2030 (%)
Chart on Regional Comparison - North America
Data Table on Regional Comparison - North America

13.3.1 US - Market size and forecast 2025-2030

Chart on US - Market size and forecast 2025-2030 ($ million)
Data Table on US - Market size and forecast 2025-2030 ($ million)
Chart on US - Year-over-year growth 2025-2030 (%)
Data Table on US - Year-over-year growth 2025-2030 (%)

13.3.2 Canada - Market size and forecast 2025-2030

Chart on Canada - Market size and forecast 2025-2030 ($ million)
Data Table on Canada - Market size and forecast 2025-2030 ($ million)
Chart on Canada - Year-over-year growth 2025-2030 (%)
Data Table on Canada - Year-over-year growth 2025-2030 (%)

13.3.3 Mexico - Market size and forecast 2025-2030

Chart on Mexico - Market size and forecast 2025-2030 ($ million)
Data Table on Mexico - Market size and forecast 2025-2030 ($ million)
Chart on Mexico - Year-over-year growth 2025-2030 (%)
Data Table on Mexico - Year-over-year growth 2025-2030 (%)

13.4 Europe - Market size and forecast 2025-2030

Chart on Europe - Market size and forecast 2025-2030 ($ million)
Data Table on Europe - Market size and forecast 2025-2030 ($ million)
Chart on Europe - Year-over-year growth 2025-2030 (%)
Data Table on Europe - Year-over-year growth 2025-2030 (%)
Chart on Regional Comparison - Europe
Data Table on Regional Comparison - Europe

13.4.1 Germany - Market size and forecast 2025-2030

Chart on Germany - Market size and forecast 2025-2030 ($ million)
Data Table on Germany - Market size and forecast 2025-2030 ($ million)
Chart on Germany - Year-over-year growth 2025-2030 (%)
Data Table on Germany - Year-over-year growth 2025-2030 (%)

13.4.2 UK - Market size and forecast 2025-2030

Chart on UK - Market size and forecast 2025-2030 ($ million)
Data Table on UK - Market size and forecast 2025-2030 ($ million)
Chart on UK - Year-over-year growth 2025-2030 (%)
Data Table on UK - Year-over-year growth 2025-2030 (%)

13.4.3 France - Market size and forecast 2025-2030

Chart on France - Market size and forecast 2025-2030 ($ million)
Data Table on France - Market size and forecast 2025-2030 ($ million)
Chart on France - Year-over-year growth 2025-2030 (%)
Data Table on France - Year-over-year growth 2025-2030 (%)

13.4.4 Italy - Market size and forecast 2025-2030

Chart on Italy - Market size and forecast 2025-2030 ($ million)
Data Table on Italy - Market size and forecast 2025-2030 ($ million)
Chart on Italy - Year-over-year growth 2025-2030 (%)
Data Table on Italy - Year-over-year growth 2025-2030 (%)

13.4.5 Spain - Market size and forecast 2025-2030

Chart on Spain - Market size and forecast 2025-2030 ($ million)
Data Table on Spain - Market size and forecast 2025-2030 ($ million)
Chart on Spain - Year-over-year growth 2025-2030 (%)
Data Table on Spain - Year-over-year growth 2025-2030 (%)

13.4.6 The Netherlands - Market size and forecast 2025-2030

Chart on The Netherlands - Market size and forecast 2025-2030 ($ million)
Data Table on The Netherlands - Market size and forecast 2025-2030 ($ million)
Chart on The Netherlands - Year-over-year growth 2025-2030 (%)
Data Table on The Netherlands - Year-over-year growth 2025-2030 (%)

13.5 Asia - Market size and forecast 2025-2030

Chart on Asia - Market size and forecast 2025-2030 ($ million)
Data Table on Asia - Market size and forecast 2025-2030 ($ million)
Chart on Asia - Year-over-year growth 2025-2030 (%)
Data Table on Asia - Year-over-year growth 2025-2030 (%)
Chart on Regional Comparison - Asia
Data Table on Regional Comparison - Asia

13.5.1 China - Market size and forecast 2025-2030

Chart on China - Market size and forecast 2025-2030 ($ million)
Data Table on China - Market size and forecast 2025-2030 ($ million)
Chart on China - Year-over-year growth 2025-2030 (%)
Data Table on China - Year-over-year growth 2025-2030 (%)

13.5.2 Japan - Market size and forecast 2025-2030

Chart on Japan - Market size and forecast 2025-2030 ($ million)
Data Table on Japan - Market size and forecast 2025-2030 ($ million)
Chart on Japan - Year-over-year growth 2025-2030 (%)
Data Table on Japan - Year-over-year growth 2025-2030 (%)

13.5.3 India - Market size and forecast 2025-2030

Chart on India - Market size and forecast 2025-2030 ($ million)
Data Table on India - Market size and forecast 2025-2030 ($ million)
Chart on India - Year-over-year growth 2025-2030 (%)
Data Table on India - Year-over-year growth 2025-2030 (%)

13.5.4 South Korea - Market size and forecast 2025-2030

Chart on South Korea - Market size and forecast 2025-2030 ($ million)
Data Table on South Korea - Market size and forecast 2025-2030 ($ million)
Chart on South Korea - Year-over-year growth 2025-2030 (%)
Data Table on South Korea - Year-over-year growth 2025-2030 (%)

13.5.5 Thailand - Market size and forecast 2025-2030

Chart on Thailand - Market size and forecast 2025-2030 ($ million)
Data Table on Thailand - Market size and forecast 2025-2030 ($ million)
Chart on Thailand - Year-over-year growth 2025-2030 (%)
Data Table on Thailand - Year-over-year growth 2025-2030 (%)

13.5.6 Indonesia - Market size and forecast 2025-2030

Chart on Indonesia - Market size and forecast 2025-2030 ($ million)
Data Table on Indonesia - Market size and forecast 2025-2030 ($ million)
Chart on Indonesia - Year-over-year growth 2025-2030 (%)
Data Table on Indonesia - Year-over-year growth 2025-2030 (%)

13.6 Rest of World (ROW) - Market size and forecast 2025-2030

Chart on Rest of World (ROW) - Market size and forecast 2025-2030 ($ million)
Data Table on Rest of World (ROW) - Market size and forecast 2025-2030 ($ million)
Chart on Rest of World (ROW) - Year-over-year growth 2025-2030 (%)
Data Table on Rest of World (ROW) - Year-over-year growth 2025-2030 (%)
Chart on Regional Comparison - Rest of World (ROW)
Data Table on Regional Comparison - Rest of World (ROW)

13.6.1 Brazil - Market size and forecast 2025-2030

Chart on Brazil - Market size and forecast 2025-2030 ($ million)
Data Table on Brazil - Market size and forecast 2025-2030 ($ million)
Chart on Brazil - Year-over-year growth 2025-2030 (%)
Data Table on Brazil - Year-over-year growth 2025-2030 (%)

13.6.2 Saudi Arabia - Market size and forecast 2025-2030

Chart on Saudi Arabia - Market size and forecast 2025-2030 ($ million)
Data Table on Saudi Arabia - Market size and forecast 2025-2030 ($ million)
Chart on Saudi Arabia - Year-over-year growth 2025-2030 (%)
Data Table on Saudi Arabia - Year-over-year growth 2025-2030 (%)

13.6.3 UAE - Market size and forecast 2025-2030

Chart on UAE - Market size and forecast 2025-2030 ($ million)
Data Table on UAE - Market size and forecast 2025-2030 ($ million)
Chart on UAE - Year-over-year growth 2025-2030 (%)
Data Table on UAE - Year-over-year growth 2025-2030 (%)

13.6.4 Turkey - Market size and forecast 2025-2030

Chart on Turkey - Market size and forecast 2025-2030 ($ million)
Data Table on Turkey - Market size and forecast 2025-2030 ($ million)
Chart on Turkey - Year-over-year growth 2025-2030 (%)
Data Table on Turkey - Year-over-year growth 2025-2030 (%)

13.6.5 Argentina - Market size and forecast 2025-2030

Chart on Argentina - Market size and forecast 2025-2030 ($ million)
Data Table on Argentina - Market size and forecast 2025-2030 ($ million)
Chart on Argentina - Year-over-year growth 2025-2030 (%)
Data Table on Argentina - Year-over-year growth 2025-2030 (%)

13.6.6 Colombia - Market size and forecast 2025-2030

Chart on Colombia - Market size and forecast 2025-2030 ($ million)
Data Table on Colombia - Market size and forecast 2025-2030 ($ million)
Chart on Colombia - Year-over-year growth 2025-2030 (%)
Data Table on Colombia - Year-over-year growth 2025-2030 (%)

13.6.7 South Africa - Market size and forecast 2025-2030

Chart on South Africa - Market size and forecast 2025-2030 ($ million)
Data Table on South Africa - Market size and forecast 2025-2030 ($ million)
Chart on South Africa - Year-over-year growth 2025-2030 (%)
Data Table on South Africa - Year-over-year growth 2025-2030 (%)

13.6.8 Israel - Market size and forecast 2025-2030

Chart on Israel - Market size and forecast 2025-2030 ($ million)
Data Table on Israel - Market size and forecast 2025-2030 ($ million)
Chart on Israel - Year-over-year growth 2025-2030 (%)
Data Table on Israel - Year-over-year growth 2025-2030 (%)

13.7 Market opportunity by geography

Market opportunity by geography ($ million)
Data Tables on Market opportunity by geography ($ million)

14. Drivers, Challenges, and Opportunity

14.1 Market drivers

Escalating demand for animal derived protein
Accelerating integration of advanced gene editing
Surging prevalence of zoonotic diseases globally

14.2 Market challenges

Stringent regulatory approvals and heterogeneous regional frameworks
Prohibitive research expenditures and capital-intensive infrastructure needs
Public bioethics resistance and ethical consumer acceptance barriers

14.3 Impact of drivers and challenges

Impact of drivers and challenges in 2025 and 2030

14.4 Market opportunities

Integration of AI and microfluidic point-of-care diagnostics
Advancements in cellular agriculture and recombinant protein synthesis platforms
Expansion of veterinary comparative oncology and precision gene therapies

15. Competitive Landscape

15.1 Overview

15.2

Overview on criticality of inputs and factors of differentiation

15.3 Landscape disruption

Overview on factors of disruption

15.4 Industry risks

Impact of key risks on business

16. Competitive Analysis

16.1 Companies profiled

Companies covered

16.2 Company ranking index

16.3 Market positioning of companies

Matrix on companies position and classification

16.4 Antech Diagnostics Inc.

Antech Diagnostics Inc. - Overview
Antech Diagnostics Inc. - Product / Service
Antech Diagnostics Inc. - Key offerings
SWOT

16.5 Bio Rad Laboratories Inc.

Bio Rad Laboratories Inc. - Overview
Bio Rad Laboratories Inc. - Business segments
Bio Rad Laboratories Inc. - Key news
Bio Rad Laboratories Inc. - Key offerings
Bio Rad Laboratories Inc. - Segment focus
SWOT

16.6 Boehringer Ingelheim GmbH

Boehringer Ingelheim GmbH - Overview
Boehringer Ingelheim GmbH - Product / Service
Boehringer Ingelheim GmbH - Key offerings
SWOT

16.7 CEVA Logistics

CEVA Logistics - Overview
CEVA Logistics - Product / Service
CEVA Logistics - Key offerings
SWOT

16.8 Elanco Animal Health Inc.

Elanco Animal Health Inc. - Overview
Elanco Animal Health Inc. - Product / Service
Elanco Animal Health Inc. - Key offerings
SWOT

16.9 Genus Plc

Genus Plc - Overview
Genus Plc - Business segments
Genus Plc - Key offerings
Genus Plc - Segment focus
SWOT

16.10 Hester Biosciences Ltd.

Hester Biosciences Ltd. - Overview
Hester Biosciences Ltd. - Business segments
Hester Biosciences Ltd. - Key offerings
Hester Biosciences Ltd. - Segment focus
SWOT

16.11 IDEXX Laboratories Inc.

IDEXX Laboratories Inc. - Overview
IDEXX Laboratories Inc. - Business segments
IDEXX Laboratories Inc. - Key offerings
IDEXX Laboratories Inc. - Segment focus
SWOT

16.12 Merck and Co. Inc.

Merck and Co. Inc. - Overview
Merck and Co. Inc. - Business segments
Merck and Co. Inc. - Key news
Merck and Co. Inc. - Key offerings
Merck and Co. Inc. - Segment focus
SWOT

16.13 Neogen Corp.

Neogen Corp. - Overview
Neogen Corp. - Business segments
Neogen Corp. - Key offerings
Neogen Corp. - Segment focus
SWOT

16.14 Phibro Animal Health Corp.

Phibro Animal Health Corp. - Overview
Phibro Animal Health Corp. - Business segments
Phibro Animal Health Corp. - Key offerings
Phibro Animal Health Corp. - Segment focus
SWOT

16.15 Randox Laboratories Ltd.

Randox Laboratories Ltd. - Overview
Randox Laboratories Ltd. - Product / Service
Randox Laboratories Ltd. - Key offerings
SWOT

16.16 Thermo Fisher Scientific Inc.

Thermo Fisher Scientific Inc. - Overview
Thermo Fisher Scientific Inc. - Business segments
Thermo Fisher Scientific Inc. - Key news
Thermo Fisher Scientific Inc. - Key offerings
Thermo Fisher Scientific Inc. - Segment focus
SWOT

16.17 Virbac Group

Virbac Group - Overview
Virbac Group - Business segments
Virbac Group - Key offerings
Virbac Group - Segment focus
SWOT

16.18 Zoetis Inc.

Zoetis Inc. - Overview
Zoetis Inc. - Business segments
Zoetis Inc. - Key offerings
Zoetis Inc. - Segment focus
SWOT

17. Appendix

17.1 Scope of the report

Market definition
Objectives
Notes and caveats

17.2 Inclusions and exclusions checklist

Inclusions checklist
Exclusions checklist

17.3 Currency conversion rates for US$

17.4 Research methodology

17.5 Data procurement

Information sources

17.6 Data validation

17.7 Validation techniques employed for market sizing

17.8 Data synthesis

17.9 360 degree market analysis

17.10 List of abbreviations

Research Methodology

Technavio presents a detailed picture of the market by way of study, synthesis, and summation of data from multiple sources. The analysts have presented the various facets of the market with a particular focus on identifying the key industry influencers. The data thus presented is comprehensive, reliable, and the result of extensive research, both primary and secondary.

INFORMATION SOURCES

Primary sources

  • Manufacturers and suppliers
  • Channel partners
  • Industry experts
  • Strategic decision makers

Secondary sources

  • Industry journals and periodicals
  • Government data
  • Financial reports of key industry players
  • Historical data
  • Press releases

DATA ANALYSIS

Data Synthesis

  • Collation of data
  • Estimation of key figures
  • Analysis of derived insights

Data Validation

  • Triangulation with data models
  • Reference against proprietary databases
  • Corroboration with industry experts

REPORT WRITING

Qualitative

  • Market drivers
  • Market challenges
  • Market trends
  • Five forces analysis

Quantitative

  • Market size and forecast
  • Market segmentation
  • Geographical insights
  • Competitive landscape

Interested in this report?

Get your sample now to see our research methodology and insights!

Download Now

Frequently Asked Questions

Animal Biotechnology market growth will increase by USD 4665.1 million during 2026-2030.

The Animal Biotechnology market is expected to grow at a CAGR of 3.3% during 2026-2030.

Animal Biotechnology market is segmented by Product (Drugs, Vaccines, Diagnostic tests, Others) Animal type (Livestock/production, Companion) Technology (CRISPR-Cas9, Gene transfer, Genome editing, RNA interference, Nanotechnology) Product type (Cloning services, Embryo biotechnology, Gene editing, In vitro fertilization, Marker assisted selection)

Antech Diagnostics Inc., Bio Rad Laboratories Inc., BioChek BV, Boehringer Ingelheim GmbH, CEVA Logistics, Elanco Animal Health Inc., Genus Plc, Hester Biosciences Ltd., IDEXX Laboratories Inc., ImmuCell Corp., Indian Immunologicals Ltd., INDICAL Bioscience GmbH, Innovative Diagnostics, Medgene Labs, Merck and Co. Inc., Neogen Corp., Phibro Animal Health Corp., Randox Laboratories Ltd., Thermo Fisher Scientific Inc., Trans Ova Genetics, Virbac Group, Zoetis Inc. are a few of the key vendors in the Animal Biotechnology market.

North America will register the highest growth rate of 57.1% among the other regions. Therefore, the Animal Biotechnology market in North America is expected to garner significant business opportunities for the vendors during the forecast period.

US, Canada, Mexico, Germany, UK, France, Italy, Spain, The Netherlands, China, Japan, India, South Korea, Thailand, Indonesia, Brazil, Saudi Arabia, UAE, Turkey, Argentina, Colombia, South Africa, Israel

  • Escalating demand for animal derived protein is the driving factor this market.

The Animal Biotechnology market vendors should focus on grabbing business opportunities from the Product segment as it accounted for the largest market share in the base year.
RIA - Research AI Assistant
Ask RIA
