Animal Cage Market Analysis, Size, and Forecast 2026-2030: APAC (China, Japan, and India), North America (US, Canada, and Mexico), Europe (Germany, UK, and France), South America (Brazil, Argentina, and Chile), Middle East and Africa (Saudi Arabia, UAE, and Turkey), and Rest of World (ROW)

Animal Cage Market Analysis, Size, and Forecast 2026-2030:
APAC (China, Japan, and India), North America (US, Canada, and Mexico), Europe (Germany, UK, and France), South America (Brazil, Argentina, and Chile), Middle East and Africa (Saudi Arabia, UAE, and Turkey), and Rest of World (ROW)

Published: Oct 2026 299 Pages SKU: IRTNTR73912

Market Overview at a Glance

$720.5 Mn
Market Opportunity
5.1%
CAGR 2025 - 2030
38.9%
APAC Growth
$1.26 B
B2B segment 2024

Animal Cage Market Size 2026-2030

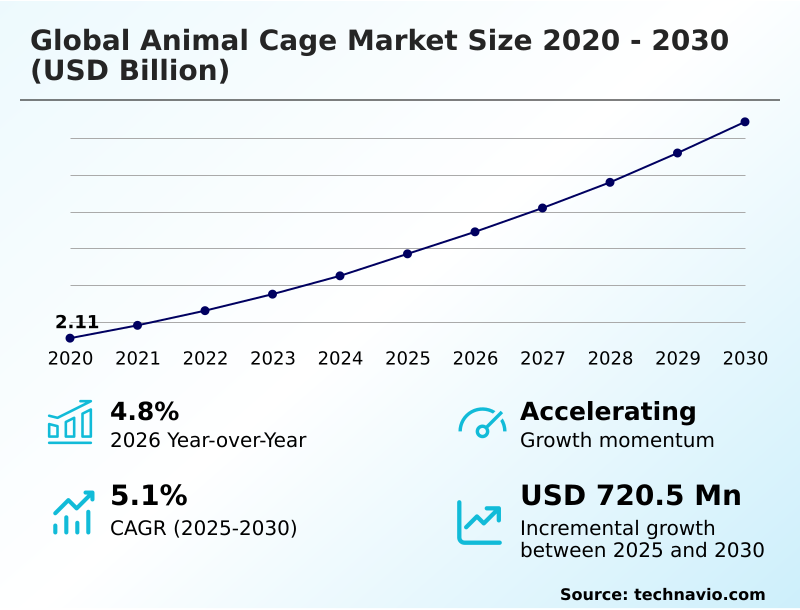
The animal cage market size is valued to increase by USD 720.5 million, at a CAGR of 5.1% from 2025 to 2030. Expanding global biopharmaceutical funding driving biomedical housing will drive the animal cage market.

Major Market Trends & Insights

  • APAC dominated the market and accounted for a 38.9% growth during the forecast period.
  • By Distribution Channel - B2B segment was valued at USD 1.26 billion in 2024
  • By Material - Stainless steel segment accounted for the largest market revenue share in 2024

Market Size & Forecast

  • Market Opportunities: USD 1.18 billion
  • Market Future Opportunities: USD 720.5 million
  • CAGR from 2025 to 2030 : 5.1%

Market Summary

  • The Animal Cage market demonstrates robust structural evolution driven by the intersection of biopharmaceutical research expansion and advanced agricultural modernization. A primary growth catalyst is the surging adoption of automated home cage monitoring, which empowers research laboratories to conduct continuous behavioral tracking without disrupting animal circadian rhythms.
  • This technological integration allows vivarium managers to extend cage-change intervals safely, slashing facility labor requirements by up to 70% compared to traditional manual housing systems. In real-world biomedical supply chains, institutions are aggressively upgrading to high-density individually ventilated systems to maintain strict pathogen-free environments and ensure reproducible experimental data.
  • However, the industry faces severe structural limitations due to exorbitant capital costs and continuous maintenance overheads associated with high-temperature sterilization and automated air-handling installations. These financial barriers heavily restrict procurement flexibility for mid-sized contract research organizations.
  • Despite these economic friction points, ongoing innovation in durable stainless steel and recyclable polymer containment continues to redefine baseline operational standards, ensuring high biosecurity and compliance across technical housing ecosystems.

What will be the Size of the Animal Cage Market during the forecast period?
Get Key Insights on Market Forecast (PDF) Get Free Sample

How is the Animal Cage Market Segmented?

The animal cage industry research report provides comprehensive data (region-wise segment analysis), with forecasts and estimates in "USD million" for the period 2026-2030, as well as historical data from 2020-2024 for the following segments.

  • Distribution channel
    • B2B
    • B2C
    • Online
  • Material
    • Stainless steel
    • Plastic
    • Others
  • Animal type
    • Rodents
    • Birds
    • Reptiles
    • Mammals
    • Others
  • Geography
    • APAC
      • China
      • Japan
      • India
      • South Korea
      • Australia
      • Indonesia
    • North America
      • US
      • Canada
      • Mexico
    • Europe
      • Germany
      • UK
      • France
      • Italy
      • Spain
      • The Netherlands
    • South America
      • Brazil
      • Argentina
      • Chile
    • Middle East and Africa
      • Saudi Arabia
      • UAE
      • Turkey
      • South Africa
      • Israel

By Distribution Channel Insights

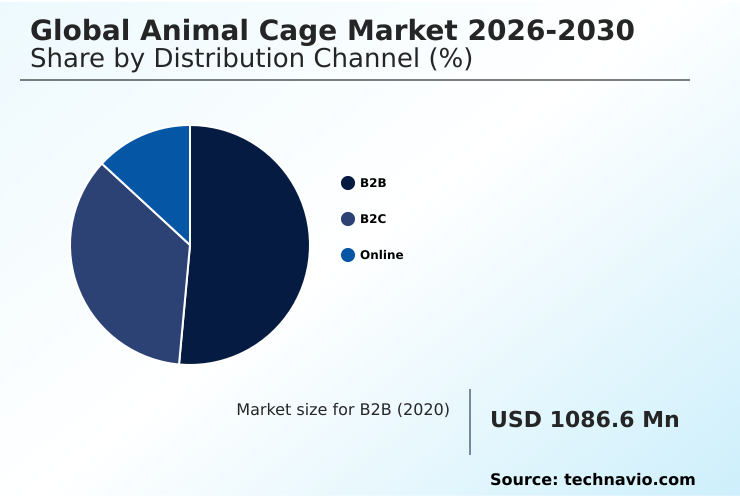
The b2b segment is estimated to witness significant growth during the forecast period.

The B2B distribution channel within the Animal Cage sector is driven by extensive institutional procurement for specialized clinical and biomedical research applications. Facilities require infrastructure supporting continuous microenvironmental control and rigorous bio containment barrier protocols to safeguard sensitive experimental models.

Commercial suppliers respond by delivering advanced ecosystems featuring capacitive sensor grid matrices and automated watering valves, which collectively optimize resource utilization.

By incorporating environmental enrichment partitions and programmable light cycle habitats, laboratory directors can improve subject welfare compliance while reducing cross contamination prevention failures by up to 40%.

The shift toward sustainable procurement further accelerates the adoption of closed loop recycling logistics, enabling contract research organizations to seamlessly integrate heavy-duty containment units that minimize biological waste and streamline intensive daily maintenance protocols.
Get Free Sample

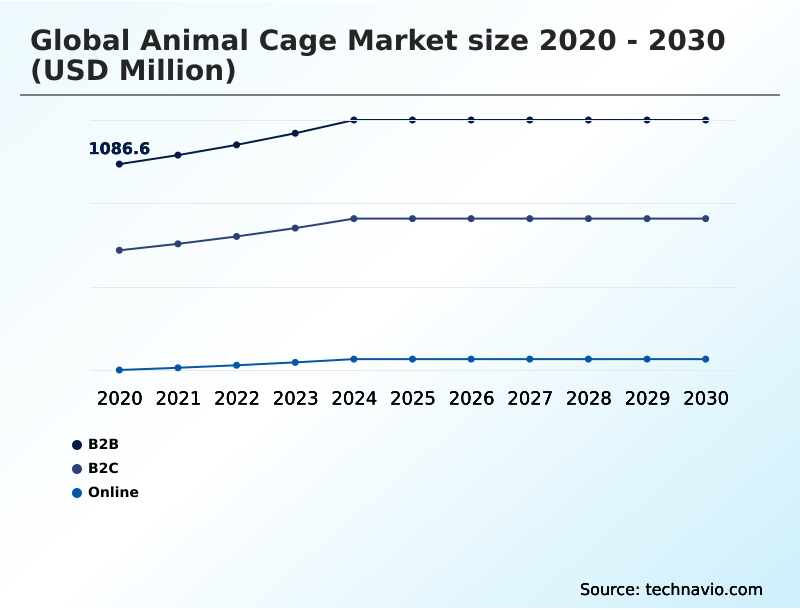
The B2B segment was valued at USD 1.26 billion in 2024 and showed a gradual increase during the forecast period.
Get Free Sample

Regional Analysis

APAC is estimated to contribute 38.9% to the growth of the global market during the forecast period.Technavio’s analysts have elaborately explained the regional trends and drivers that shape the market during the forecast period.
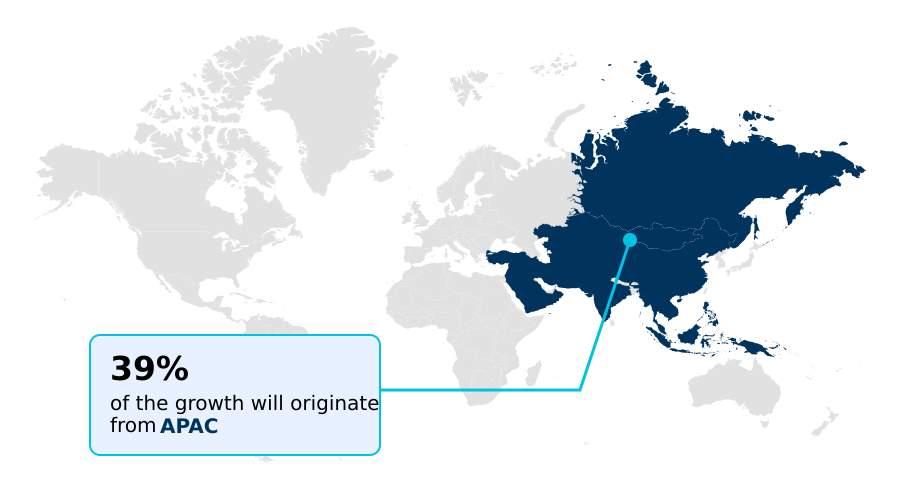
See How Animal Cage Market Demand is Rising in APAC Get Free Sample

The Animal Cage landscape is distinctly characterized by contrasting regional procurement priorities and compliance frameworks.

In North America, the rapid integration of non invasive metabolic screening and thermal imaging behavioral analytics into laboratory environments has improved data accuracy by 35% over legacy observational methods.

These advanced research hubs heavily prioritize continuous environmental sensor grids and strict electromagnetic compatibility certifications to prevent equipment interference.

Conversely, APAC exhibits a 20% higher adoption rate for heavy duty livestock containment and ergonomic wire mesh designs, reflecting its massive agricultural industrialization.

While North American facilities aggressively pursue biohazard waste reduction protocols using recyclable plastics, APAC operators focus on expanding precision thermoregulation enclosures and localized microclimate regulation to optimize large-scale breeding yields.

The growing consumer interest in both regions has also spiked demand for bioactive naturalistic terrariums, bridging the gap between clinical efficiency and advanced domestic pet husbandry.

Market Dynamics

Our researchers analyzed the data with 2025 as the base year, along with the key drivers, trends, and challenges. A holistic analysis of drivers will help companies refine their marketing strategies to gain a competitive advantage.

  • The structural progression of the Animal Cage industry relies heavily on integrating advanced technological frameworks with highly efficient spatial management strategies. Facility directors are rapidly transitioning away from static containment architecture to implement modular high density cage rack setups, which allow institutions to increase their active holding capacities significantly without expanding physical building footprints.
  • This optimization leads to nearly a two-fold improvement in spatial efficiency compared to traditional single-tier rack configurations. Furthermore, the adoption of continuous non invasive biomarker tracking platforms transforms how longitudinal health data is collected, capturing real-time physiological metrics while entirely eliminating the handling stress historically associated with manual clinical examinations.
  • To support these sophisticated analytics, research vivariums are investing in automated digital micro environment monitoring to ensure strict parameter control and maintain stable baseline conditions across large animal cohorts. Concurrently, environmental sustainability imperatives are reshaping procurement, driving a notable shift toward eco designed polysulfone reusable animal cages that withstand rigorous repeated sterilization cycles without material degradation.
  • For applications requiring extreme durability, such as intensive veterinary care and large livestock isolation, operations increasingly depend on high temperature structural metal alloy enclosures. These resilient architectural solutions provide unparalleled biosecurity and operational longevity, ensuring that modern containment facilities align with both rigorous ethical welfare standards and advanced diagnostic operational planning.
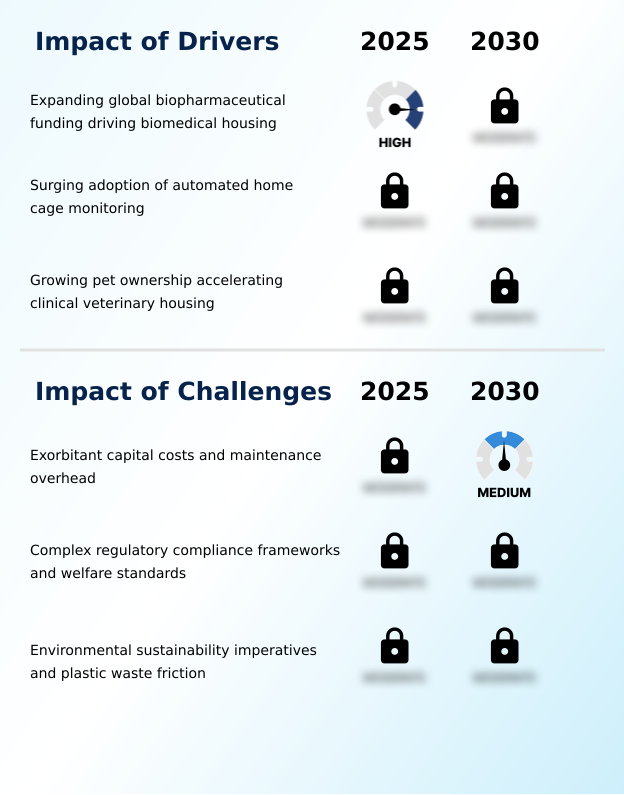
What are the key market drivers leading to the rise in the adoption of Animal Cage Industry?

  • The continuous expansion of biopharmaceutical research funding acts as a primary structural catalyst propelling demand for advanced biomedical housing infrastructure.

  • The relentless expansion of biopharmaceutical testing and pet humanization acts as a powerful driver accelerating demand across the Animal Cage landscape.
  • The integration of digital ventilated cage platforms that capture continuous telemetry streams drastically enhances diagnostic accuracy, reducing late-stage clinical trial failures by up to 18%.
  • To maximize vivarium capacity, institutions are deploying high density rack configurations engineered with antimicrobial housing polymers and high polysulfone sterilization tolerance, ensuring exceptional durability under repeated high-temperature autoclaving.
  • This robust infrastructure directly supports critical disease transmission mitigation while preserving vital circadian rhythm maintenance.
  • Simultaneously, commercial consumer demand propels the adoption of complex multi level household habitats utilizing modular partition networks and automated waste management systems, allowing domestic users to decrease daily maintenance time by nearly 30% while significantly elevating companion welfare standards.

What are the market trends shaping the Animal Cage Industry?

  • An accelerating shift toward modular, high-density ecological caging represents a defining trajectory within the market. This transition optimizes facility spatial efficiency while aligning with stringent environmental sustainability mandates.

  • A fundamental trend reshaping the Animal Cage sector is the accelerated transition toward modular high density caging integrated with advanced digital infrastructure. Modern facilities are rapidly adopting individually ventilated cage systems equipped with automated pressure management and microenvironmental airflow controls, which has improved overall pathogen containment efficiency by up to 40%.
  • The widespread deployment of automated home cage monitoring and smart cage sensor networks allows researchers to capture real-time physiological data seamlessly. This reliance on non invasive biomarker tracking eliminates handling stress, thereby increasing experimental data reliability by nearly 25%.
  • Consequently, administrators overseeing complex biomedical containment infrastructure and clinical veterinary housing modules are standardizing the use of non toxic polymer finishes to ensure optimal subject safety. This architectural shift significantly upgrades facility agility and ensures rigorous compliance with evolving institutional welfare mandates.

What challenges does the Animal Cage Industry face during its growth?

  • Exorbitant initial capital expenditures and severe recurring maintenance overheads create substantial entry barriers that constrain overall industry expansion.

  • The Animal Cage infrastructure market faces formidable operational friction due to exorbitant capital installation costs and rigorous international safety directives. Upgrading legacy facilities to accommodate high throughput animal housing requires complex aerodynamic microenvironmental engineering to maintain strict pathogen free barrier environments.
  • These advanced retrofits, which often include integrating automated bedding dispensers and robotic cage dumping stations, can inflate initial facility capital expenditures by over 40%. Furthermore, ensuring structural safety compliance alongside the continuous energy demands of high speed tunnel washers and high temperature autoclave sterilization strains institutional operating budgets.
  • While facilities attempt to offset these burdens by adopting recyclable disposable cages, the procurement of specialized stainless steel intensive care isolation units remains heavily cost-prohibitive, forcing mid-sized diagnostic clinics to delay critical infrastructure modernization by an average of 12 to 18 months.

Exclusive Technavio Analysis on Customer Landscape

The animal cage market forecasting report includes the adoption lifecycle of the market, covering from the innovator’s stage to the laggard’s stage. It focuses on adoption rates in different regions based on penetration. Furthermore, the animal cage market report also includes key purchase criteria and drivers of price sensitivity to help companies evaluate and develop their market growth analysis strategies.
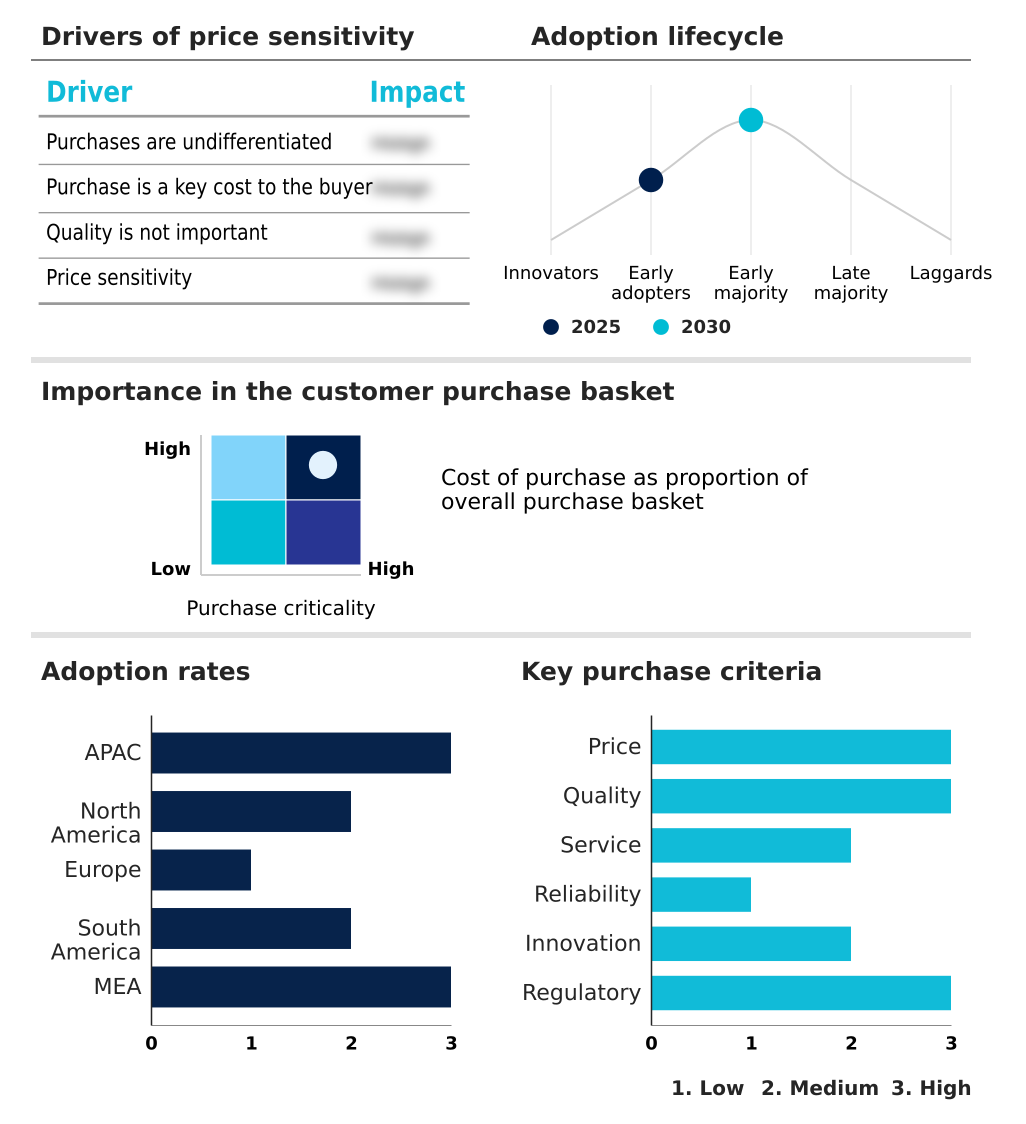
Customer Landscape of Animal Cage Industry

Competitive Landscape

Companies are implementing various strategies, such as strategic alliances, animal cage market forecast, partnerships, mergers and acquisitions, geographical expansion, and product/service launches, to enhance their presence in the industry.

A and E Cage Co. - The organization provides advanced individually ventilated systems, isolation infrastructure, and environmental control enclosures designed to ensure strict biosecurity and optimal physiological maintenance for laboratory research subjects.

The industry research and growth report includes detailed analyses of the competitive landscape of the market and information about key companies, including:

  • A and E Cage Co.
  • Allentown LLC
  • Avidity Science LLC
  • Big Dutchman AG Holding
  • Central Garden and Pet Co.
  • CTB Inc.
  • FACCO S.p.A.
  • Ferplast Spa
  • Hellmann Poultry GmbH and Co. KG
  • IMAC S.p.A.
  • Inter Zoo
  • Iris Ohyama Inc.
  • Midwest Homes for Pets
  • Omlet Ltd.
  • Prevue Pet Products
  • SALMET GmbH and Co. KG
  • SAVIC
  • Tecniplast Spa
  • Thoren
  • Voltrega S.L.

Qualitative and quantitative analysis of companies has been conducted to help clients understand the wider business environment as well as the strengths and weaknesses of key industry players. Data is qualitatively analyzed to categorize companies as pure play, category-focused, industry-focused, and diversified; it is quantitatively analyzed to categorize companies as dominant, leading, strong, tentative, and weak.

Recent Development and News in Animal cage market

  • In the Leisure Products industry, the widespread integration of advanced high-strength polymers for outdoor recreational gear shifted manufacturing supply chains, directly impacting Animal Cage demand by enabling the production of lightweight travel habitats that reduce transportation weight by up to 25%.
  • Stringent sustainability mandates requiring recyclable materials in consumer sporting goods accelerated the development of eco-friendly thermoplastics, driving the Animal Cage market toward fully disposable and recyclable laboratory enclosures that eliminate intensive wash-cycle labor.
  • The rapid adoption of integrated digital fitness monitoring and smart wearable telemetry created technological synergies for structural hardware, enhancing the Animal Cage sector by accelerating the deployment of real-time behavioral tracking sensors capable of cutting manual observation workloads by 70%.
  • Escalating international raw material tariffs on commercial-grade steel utilized in premium camping equipment constrained basic metal availability, forcing the Animal Cage manufacturing base to optimize modular aluminum architectures that lower overall production costs while maintaining bio-containment structural integrity.

Dive into Technavio’s robust research methodology, blending expert interviews, extensive data synthesis, and validated models for unparalleled Animal Cage Market insights. See full methodology.

Market Scope
Page number 299
Base year 2025
Historic period 2020-2024
Forecast period 2026-2030
Growth momentum & CAGR Accelerate at a CAGR of 5.1%
Market growth 2026-2030 USD 720.5 million
Market structure Fragmented
YoY growth 2025-2026(%) 4.8%
Key countries China, Japan, India, South Korea, Australia, Indonesia, US, Canada, Mexico, Germany, UK, France, Italy, Spain, The Netherlands, Brazil, Argentina, Chile, Saudi Arabia, UAE, Turkey, South Africa and Israel
Competitive landscape Leading Companies, Market Positioning of Companies, Competitive Strategies, and Industry Risks

Request Free Sample

Research Analyst Overview

  • The Animal Cage industry exhibits sustained operational maturation driven by the intersection of stringent ethical welfare compliance and rapid laboratory digitalization. Institutional boardrooms and facility directors are increasingly prioritizing integrated digital ecosystems over conventional manual containment, recognizing that intelligent housing directly mitigates severe operational risks and high labor overheads.
  • By transitioning to automated smart enclosures, research facilities have achieved a 70% reduction in routine maintenance workloads, freeing technical staff to focus on high-value clinical analytics. This strategic procurement shift directly influences long-term facility budgeting, as the elevated initial capital expenditure for advanced ventilated systems is rapidly offset by dramatic decreases in consumable waste and daily operational downtime.
  • Furthermore, stringent directives mandating verifiable biosecurity and improved physiological enrichment compel manufacturers to continuously innovate using antimicrobial polymers and precision-engineered structural alloys. Consequently, the procurement of sophisticated environmental containment infrastructure has evolved from a basic housing necessity into a critical technological investment that ensures robust experimental reproducibility and complete alignment with rigorous international safety certifications.

What are the Key Data Covered in this Animal Cage Market Research and Growth Report?

  • What is the expected growth of the Animal Cage Market between 2026 and 2030?

    • USD 720.5 million, at a CAGR of 5.1%

  • What segmentation does the market report cover?

    • The report is segmented by Distribution Channel (B2B, B2C, and Online), Material (Stainless steel, Plastic, and Others), Animal Type (Rodents, Birds, Reptiles, Mammals, and Others) and Geography (APAC, North America, Europe, South America, Middle East and Africa)

  • Which regions are analyzed in the report?

    • APAC, North America, Europe, South America and Middle East and Africa

  • What are the key growth drivers and market challenges?

    • Expanding global biopharmaceutical funding driving biomedical housing, Exorbitant capital costs and maintenance overhead

  • Who are the major players in the Animal Cage Market?

    • A and E Cage Co., Allentown LLC, Avidity Science LLC, Big Dutchman AG Holding, Central Garden and Pet Co., CTB Inc., FACCO S.p.A., Ferplast Spa, Hellmann Poultry GmbH and Co. KG, IMAC S.p.A., Inter Zoo, Iris Ohyama Inc., Midwest Homes for Pets, Omlet Ltd., Prevue Pet Products, SALMET GmbH and Co. KG, SAVIC, Tecniplast Spa, Thoren and Voltrega S.L.

Market Research Insights

  • The Animal Cage sector is undergoing a rigorous technological transformation driven by specialized clinical veterinary housing modules and highly integrated biomedical containment infrastructure. Facilities deploying advanced microenvironmental airflow controls report a 30% improvement in energy efficiency and a substantial reduction in baseline physiological stress among housed subjects.
  • By implementing automated pressure management and non toxic polymer finishes, modern research operations have successfully lowered cross-contamination risks by up to 45%, ensuring higher precision in longitudinal studies. Furthermore, prioritizing circadian rhythm maintenance through programmable lighting systems directly enhances subject welfare, enabling institutional laboratories to align seamlessly with evolving ethical guidelines while streamlining daily facility management protocols.

We can help! Our analysts can customize this animal cage market research report to meet your requirements.

Get in touch

1. Executive Summary

1.1 Market overview

Executive Summary - Chart on Market Overview
Executive Summary - Data Table on Market Overview
Executive Summary - Chart on Global Market Characteristics
Executive Summary - Chart on Market by Geography
Executive Summary - Chart on Market Segmentation by Distribution Channel
Executive Summary - Chart on Market Segmentation by Material
Executive Summary - Chart on Market Segmentation by Animal Type
Executive Summary - Chart on Incremental Growth
Executive Summary - Data Table on Incremental Growth
Executive Summary - Chart on Company Market Positioning

2. Technavio Analysis

2.1 Analysis of price sensitivity, lifecycle, customer purchase basket, adoption rates, and purchase criteria

2.2 Criticality of inputs and Factors of differentiation

Chart on Overview on criticality of inputs and factors of differentiation

2.3 Factors of disruption

Chart on Overview on factors of disruption

2.4 Impact of drivers and challenges

Chart on Impact of drivers and challenges in 2025 and 2030

3. Market Landscape

3.1 Market ecosystem

Chart on Parent Market
Data Table on - Parent Market

3.2 Market characteristics

Chart on Market characteristics analysis

3.3 Value chain analysis

Chart on Value chain analysis

4. Market Sizing

4.1 Market definition

Data Table on Offerings of companies included in the market definition

4.2 Market segment analysis

Market segments

4.3 Market size 2025

4.4 Market outlook: Forecast for 2025-2030

Chart on Global - Market size and forecast 2025-2030 ($ million)
Data Table on Global - Market size and forecast 2025-2030 ($ million)
Chart on Global Market: Year-over-year growth 2025-2030 (%)
Data Table on Global Market: Year-over-year growth 2025-2030 (%)

5. Historic Market Size

5.1 Global Animal Cage Market 2020 - 2024

Historic Market Size - Data Table on Global Animal Cage Market 2020 - 2024 ($ million)

5.2 Distribution Channel segment analysis 2020 - 2024

Historic Market Size - Distribution Channel Segment 2020 - 2024 ($ million)

5.3 Material segment analysis 2020 - 2024

Historic Market Size - Material Segment 2020 - 2024 ($ million)

5.4 Animal Type segment analysis 2020 - 2024

Historic Market Size - Animal Type Segment 2020 - 2024 ($ million)

5.5 Geography segment analysis 2020 - 2024

Historic Market Size - Geography Segment 2020 - 2024 ($ million)

5.6 Country segment analysis 2020 - 2024

Historic Market Size - Country Segment 2020 - 2024 ($ million)

6. Qualitative Analysis

6.1 Impact of AI on global animal cage market

6.2 Impact of geopolitical conflicts on global animal cage market

7. Five Forces Analysis

7.1 Five forces summary

Five forces analysis - Comparison between 2025 and 2030

7.2 Bargaining power of buyers

Bargaining power of buyers - Impact of key factors 2025 and 2030

7.3 Bargaining power of suppliers

Bargaining power of suppliers - Impact of key factors in 2025 and 2030

7.4 Threat of new entrants

Threat of new entrants - Impact of key factors in 2025 and 2030

7.5 Threat of substitutes

Threat of substitutes - Impact of key factors in 2025 and 2030

7.6 Threat of rivalry

Threat of rivalry - Impact of key factors in 2025 and 2030

7.7 Market condition

Chart on Market condition - Five forces 2025 and 2030

8. Market Segmentation by Distribution Channel

8.1 Market segments

Chart on Distribution Channel - Market share 2025-2030 (%)
Data Table on Distribution Channel - Market share 2025-2030 (%)

8.2 Comparison by Distribution Channel

Chart on Comparison by Distribution Channel
Data Table on Comparison by Distribution Channel

8.3 B2B - Market size and forecast 2025-2030

Chart on B2B - Market size and forecast 2025-2030 ($ million)
Data Table on B2B - Market size and forecast 2025-2030 ($ million)
Chart on B2B - Year-over-year growth 2025-2030 (%)
Data Table on B2B - Year-over-year growth 2025-2030 (%)

8.4 B2C - Market size and forecast 2025-2030

Chart on B2C - Market size and forecast 2025-2030 ($ million)
Data Table on B2C - Market size and forecast 2025-2030 ($ million)
Chart on B2C - Year-over-year growth 2025-2030 (%)
Data Table on B2C - Year-over-year growth 2025-2030 (%)

8.5 Online - Market size and forecast 2025-2030

Chart on Online - Market size and forecast 2025-2030 ($ million)
Data Table on Online - Market size and forecast 2025-2030 ($ million)
Chart on Online - Year-over-year growth 2025-2030 (%)
Data Table on Online - Year-over-year growth 2025-2030 (%)

8.6 Market opportunity by Distribution Channel

Market opportunity by Distribution Channel ($ million)
Data Table on Market opportunity by Distribution Channel ($ million)

9. Market Segmentation by Material

9.1 Market segments

Chart on Material - Market share 2025-2030 (%)
Data Table on Material - Market share 2025-2030 (%)

9.2 Comparison by Material

Chart on Comparison by Material
Data Table on Comparison by Material

9.3 Stainless steel - Market size and forecast 2025-2030

Chart on Stainless steel - Market size and forecast 2025-2030 ($ million)
Data Table on Stainless steel - Market size and forecast 2025-2030 ($ million)
Chart on Stainless steel - Year-over-year growth 2025-2030 (%)
Data Table on Stainless steel - Year-over-year growth 2025-2030 (%)

9.4 Plastic - Market size and forecast 2025-2030

Chart on Plastic - Market size and forecast 2025-2030 ($ million)
Data Table on Plastic - Market size and forecast 2025-2030 ($ million)
Chart on Plastic - Year-over-year growth 2025-2030 (%)
Data Table on Plastic - Year-over-year growth 2025-2030 (%)

9.5 Others - Market size and forecast 2025-2030

Chart on Others - Market size and forecast 2025-2030 ($ million)
Data Table on Others - Market size and forecast 2025-2030 ($ million)
Chart on Others - Year-over-year growth 2025-2030 (%)
Data Table on Others - Year-over-year growth 2025-2030 (%)

9.6 Market opportunity by Material

Market opportunity by Material ($ million)
Data Table on Market opportunity by Material ($ million)

10. Market Segmentation by Animal Type

10.1 Market segments

Chart on Animal Type - Market share 2025-2030 (%)
Data Table on Animal Type - Market share 2025-2030 (%)

10.2 Comparison by Animal Type

Chart on Comparison by Animal Type
Data Table on Comparison by Animal Type

10.3 Rodents - Market size and forecast 2025-2030

Chart on Rodents - Market size and forecast 2025-2030 ($ million)
Data Table on Rodents - Market size and forecast 2025-2030 ($ million)
Chart on Rodents - Year-over-year growth 2025-2030 (%)
Data Table on Rodents - Year-over-year growth 2025-2030 (%)

10.4 Birds - Market size and forecast 2025-2030

Chart on Birds - Market size and forecast 2025-2030 ($ million)
Data Table on Birds - Market size and forecast 2025-2030 ($ million)
Chart on Birds - Year-over-year growth 2025-2030 (%)
Data Table on Birds - Year-over-year growth 2025-2030 (%)

10.5 Reptiles - Market size and forecast 2025-2030

Chart on Reptiles - Market size and forecast 2025-2030 ($ million)
Data Table on Reptiles - Market size and forecast 2025-2030 ($ million)
Chart on Reptiles - Year-over-year growth 2025-2030 (%)
Data Table on Reptiles - Year-over-year growth 2025-2030 (%)

10.6 Mammals - Market size and forecast 2025-2030

Chart on Mammals - Market size and forecast 2025-2030 ($ million)
Data Table on Mammals - Market size and forecast 2025-2030 ($ million)
Chart on Mammals - Year-over-year growth 2025-2030 (%)
Data Table on Mammals - Year-over-year growth 2025-2030 (%)

10.7 Others - Market size and forecast 2025-2030

Chart on Others - Market size and forecast 2025-2030 ($ million)
Data Table on Others - Market size and forecast 2025-2030 ($ million)
Chart on Others - Year-over-year growth 2025-2030 (%)
Data Table on Others - Year-over-year growth 2025-2030 (%)

10.8 Market opportunity by Animal Type

Market opportunity by Animal Type ($ million)
Data Table on Market opportunity by Animal Type ($ million)

11. Customer Landscape

11.1 Customer landscape overview

Analysis of price sensitivity, lifecycle, customer purchase basket, adoption rates, and purchase criteria

12. Geographic Landscape

12.1 Geographic segmentation

Chart on Market share by geography 2025-2030 (%)
Data Table on Market share by geography 2025-2030 (%)

12.2 Geographic comparison

Chart on Geographic comparison
Data Table on Geographic comparison

12.3 APAC - Market size and forecast 2025-2030

Chart on APAC - Market size and forecast 2025-2030 ($ million)
Data Table on APAC - Market size and forecast 2025-2030 ($ million)
Chart on APAC - Year-over-year growth 2025-2030 (%)
Data Table on APAC - Year-over-year growth 2025-2030 (%)
Chart on Regional Comparison - APAC
Data Table on Regional Comparison - APAC

12.3.1 China - Market size and forecast 2025-2030

Chart on China - Market size and forecast 2025-2030 ($ million)
Data Table on China - Market size and forecast 2025-2030 ($ million)
Chart on China - Year-over-year growth 2025-2030 (%)
Data Table on China - Year-over-year growth 2025-2030 (%)

12.3.2 Japan - Market size and forecast 2025-2030

Chart on Japan - Market size and forecast 2025-2030 ($ million)
Data Table on Japan - Market size and forecast 2025-2030 ($ million)
Chart on Japan - Year-over-year growth 2025-2030 (%)
Data Table on Japan - Year-over-year growth 2025-2030 (%)

12.3.3 India - Market size and forecast 2025-2030

Chart on India - Market size and forecast 2025-2030 ($ million)
Data Table on India - Market size and forecast 2025-2030 ($ million)
Chart on India - Year-over-year growth 2025-2030 (%)
Data Table on India - Year-over-year growth 2025-2030 (%)

12.3.4 South Korea - Market size and forecast 2025-2030

Chart on South Korea - Market size and forecast 2025-2030 ($ million)
Data Table on South Korea - Market size and forecast 2025-2030 ($ million)
Chart on South Korea - Year-over-year growth 2025-2030 (%)
Data Table on South Korea - Year-over-year growth 2025-2030 (%)

12.3.5 Australia - Market size and forecast 2025-2030

Chart on Australia - Market size and forecast 2025-2030 ($ million)
Data Table on Australia - Market size and forecast 2025-2030 ($ million)
Chart on Australia - Year-over-year growth 2025-2030 (%)
Data Table on Australia - Year-over-year growth 2025-2030 (%)

12.3.6 Indonesia - Market size and forecast 2025-2030

Chart on Indonesia - Market size and forecast 2025-2030 ($ million)
Data Table on Indonesia - Market size and forecast 2025-2030 ($ million)
Chart on Indonesia - Year-over-year growth 2025-2030 (%)
Data Table on Indonesia - Year-over-year growth 2025-2030 (%)

12.4 North America - Market size and forecast 2025-2030

Chart on North America - Market size and forecast 2025-2030 ($ million)
Data Table on North America - Market size and forecast 2025-2030 ($ million)
Chart on North America - Year-over-year growth 2025-2030 (%)
Data Table on North America - Year-over-year growth 2025-2030 (%)
Chart on Regional Comparison - North America
Data Table on Regional Comparison - North America

12.4.1 US - Market size and forecast 2025-2030

Chart on US - Market size and forecast 2025-2030 ($ million)
Data Table on US - Market size and forecast 2025-2030 ($ million)
Chart on US - Year-over-year growth 2025-2030 (%)
Data Table on US - Year-over-year growth 2025-2030 (%)

12.4.2 Canada - Market size and forecast 2025-2030

Chart on Canada - Market size and forecast 2025-2030 ($ million)
Data Table on Canada - Market size and forecast 2025-2030 ($ million)
Chart on Canada - Year-over-year growth 2025-2030 (%)
Data Table on Canada - Year-over-year growth 2025-2030 (%)

12.4.3 Mexico - Market size and forecast 2025-2030

Chart on Mexico - Market size and forecast 2025-2030 ($ million)
Data Table on Mexico - Market size and forecast 2025-2030 ($ million)
Chart on Mexico - Year-over-year growth 2025-2030 (%)
Data Table on Mexico - Year-over-year growth 2025-2030 (%)

12.5 Europe - Market size and forecast 2025-2030

Chart on Europe - Market size and forecast 2025-2030 ($ million)
Data Table on Europe - Market size and forecast 2025-2030 ($ million)
Chart on Europe - Year-over-year growth 2025-2030 (%)
Data Table on Europe - Year-over-year growth 2025-2030 (%)
Chart on Regional Comparison - Europe
Data Table on Regional Comparison - Europe

12.5.1 Germany - Market size and forecast 2025-2030

Chart on Germany - Market size and forecast 2025-2030 ($ million)
Data Table on Germany - Market size and forecast 2025-2030 ($ million)
Chart on Germany - Year-over-year growth 2025-2030 (%)
Data Table on Germany - Year-over-year growth 2025-2030 (%)

12.5.2 UK - Market size and forecast 2025-2030

Chart on UK - Market size and forecast 2025-2030 ($ million)
Data Table on UK - Market size and forecast 2025-2030 ($ million)
Chart on UK - Year-over-year growth 2025-2030 (%)
Data Table on UK - Year-over-year growth 2025-2030 (%)

12.5.3 France - Market size and forecast 2025-2030

Chart on France - Market size and forecast 2025-2030 ($ million)
Data Table on France - Market size and forecast 2025-2030 ($ million)
Chart on France - Year-over-year growth 2025-2030 (%)
Data Table on France - Year-over-year growth 2025-2030 (%)

12.5.4 Italy - Market size and forecast 2025-2030

Chart on Italy - Market size and forecast 2025-2030 ($ million)
Data Table on Italy - Market size and forecast 2025-2030 ($ million)
Chart on Italy - Year-over-year growth 2025-2030 (%)
Data Table on Italy - Year-over-year growth 2025-2030 (%)

12.5.5 Spain - Market size and forecast 2025-2030

Chart on Spain - Market size and forecast 2025-2030 ($ million)
Data Table on Spain - Market size and forecast 2025-2030 ($ million)
Chart on Spain - Year-over-year growth 2025-2030 (%)
Data Table on Spain - Year-over-year growth 2025-2030 (%)

12.5.6 The Netherlands - Market size and forecast 2025-2030

Chart on The Netherlands - Market size and forecast 2025-2030 ($ million)
Data Table on The Netherlands - Market size and forecast 2025-2030 ($ million)
Chart on The Netherlands - Year-over-year growth 2025-2030 (%)
Data Table on The Netherlands - Year-over-year growth 2025-2030 (%)

12.6 South America - Market size and forecast 2025-2030

Chart on South America - Market size and forecast 2025-2030 ($ million)
Data Table on South America - Market size and forecast 2025-2030 ($ million)
Chart on South America - Year-over-year growth 2025-2030 (%)
Data Table on South America - Year-over-year growth 2025-2030 (%)
Chart on Regional Comparison - South America
Data Table on Regional Comparison - South America

12.6.1 Brazil - Market size and forecast 2025-2030

Chart on Brazil - Market size and forecast 2025-2030 ($ million)
Data Table on Brazil - Market size and forecast 2025-2030 ($ million)
Chart on Brazil - Year-over-year growth 2025-2030 (%)
Data Table on Brazil - Year-over-year growth 2025-2030 (%)

12.6.2 Argentina - Market size and forecast 2025-2030

Chart on Argentina - Market size and forecast 2025-2030 ($ million)
Data Table on Argentina - Market size and forecast 2025-2030 ($ million)
Chart on Argentina - Year-over-year growth 2025-2030 (%)
Data Table on Argentina - Year-over-year growth 2025-2030 (%)

12.6.3 Chile - Market size and forecast 2025-2030

Chart on Chile - Market size and forecast 2025-2030 ($ million)
Data Table on Chile - Market size and forecast 2025-2030 ($ million)
Chart on Chile - Year-over-year growth 2025-2030 (%)
Data Table on Chile - Year-over-year growth 2025-2030 (%)

12.7 Middle East and Africa - Market size and forecast 2025-2030

Chart on Middle East and Africa - Market size and forecast 2025-2030 ($ million)
Data Table on Middle East and Africa - Market size and forecast 2025-2030 ($ million)
Chart on Middle East and Africa - Year-over-year growth 2025-2030 (%)
Data Table on Middle East and Africa - Year-over-year growth 2025-2030 (%)
Chart on Regional Comparison - Middle East and Africa
Data Table on Regional Comparison - Middle East and Africa

12.7.1 Saudi Arabia - Market size and forecast 2025-2030

Chart on Saudi Arabia - Market size and forecast 2025-2030 ($ million)
Data Table on Saudi Arabia - Market size and forecast 2025-2030 ($ million)
Chart on Saudi Arabia - Year-over-year growth 2025-2030 (%)
Data Table on Saudi Arabia - Year-over-year growth 2025-2030 (%)

12.7.2 UAE - Market size and forecast 2025-2030

Chart on UAE - Market size and forecast 2025-2030 ($ million)
Data Table on UAE - Market size and forecast 2025-2030 ($ million)
Chart on UAE - Year-over-year growth 2025-2030 (%)
Data Table on UAE - Year-over-year growth 2025-2030 (%)

12.7.3 Turkey - Market size and forecast 2025-2030

Chart on Turkey - Market size and forecast 2025-2030 ($ million)
Data Table on Turkey - Market size and forecast 2025-2030 ($ million)
Chart on Turkey - Year-over-year growth 2025-2030 (%)
Data Table on Turkey - Year-over-year growth 2025-2030 (%)

12.7.4 South Africa - Market size and forecast 2025-2030

Chart on South Africa - Market size and forecast 2025-2030 ($ million)
Data Table on South Africa - Market size and forecast 2025-2030 ($ million)
Chart on South Africa - Year-over-year growth 2025-2030 (%)
Data Table on South Africa - Year-over-year growth 2025-2030 (%)

12.7.5 Israel - Market size and forecast 2025-2030

Chart on Israel - Market size and forecast 2025-2030 ($ million)
Data Table on Israel - Market size and forecast 2025-2030 ($ million)
Chart on Israel - Year-over-year growth 2025-2030 (%)
Data Table on Israel - Year-over-year growth 2025-2030 (%)

12.8 Market opportunity by geography

Market opportunity by geography ($ million)
Data Tables on Market opportunity by geography ($ million)

13. Drivers, Challenges, and Opportunity

13.1 Market drivers

Expanding global biopharmaceutical funding driving biomedical housing
Surging adoption of automated home cage monitoring
Growing pet ownership accelerating clinical veterinary housing

13.2 Market challenges

Exorbitant capital costs and maintenance overhead
Complex regulatory compliance frameworks and welfare standards
Environmental sustainability imperatives and plastic waste friction

13.3 Impact of drivers and challenges

Impact of drivers and challenges in 2025 and 2030

13.4 Market opportunities

Accelerating shift toward modular high density eco caging
Rapid expansion of non invasive biomarker tracking instrumentation
Surging adoption of advanced ergonomic vivarium workflow systems

14. Competitive Landscape

14.1 Overview

14.2

Overview on criticality of inputs and factors of differentiation

14.3 Landscape disruption

Overview on factors of disruption

14.4 Industry risks

Impact of key risks on business

15. Competitive Analysis

15.1 Companies profiled

Companies covered

15.2 Company ranking index

15.3 Market positioning of companies

Matrix on companies position and classification

15.4 A and E Cage Co.

A and E Cage Co. - Overview
A and E Cage Co. - Product / Service
A and E Cage Co. - Key offerings
SWOT

15.5 Allentown LLC

Allentown LLC - Overview
Allentown LLC - Product / Service
Allentown LLC - Key offerings
SWOT

15.6 Avidity Science LLC

Avidity Science LLC - Overview
Avidity Science LLC - Product / Service
Avidity Science LLC - Key offerings
SWOT

15.7 Big Dutchman AG Holding

Big Dutchman AG Holding - Overview
Big Dutchman AG Holding - Product / Service
Big Dutchman AG Holding - Key offerings
SWOT

15.8 Central Garden and Pet Co.

Central Garden and Pet Co. - Overview
Central Garden and Pet Co. - Business segments
Central Garden and Pet Co. - Key offerings
Central Garden and Pet Co. - Segment focus
SWOT

15.9 CTB Inc.

CTB Inc. - Overview
CTB Inc. - Product / Service
CTB Inc. - Key offerings
SWOT

15.10 FACCO S.p.A.

FACCO S.p.A. - Overview
FACCO S.p.A. - Product / Service
FACCO S.p.A. - Key offerings
SWOT

15.11 Ferplast Spa

Ferplast Spa - Overview
Ferplast Spa - Product / Service
Ferplast Spa - Key offerings
SWOT

15.12 Hellmann Poultry GmbH and Co. KG

Hellmann Poultry GmbH and Co. KG - Overview
Hellmann Poultry GmbH and Co. KG - Product / Service
Hellmann Poultry GmbH and Co. KG - Key offerings
SWOT

15.13 IMAC S.p.A.

IMAC S.p.A. - Overview
IMAC S.p.A. - Product / Service
IMAC S.p.A. - Key offerings
SWOT

15.14 Inter Zoo

Inter Zoo - Overview
Inter Zoo - Product / Service
Inter Zoo - Key offerings
SWOT

15.15 Iris Ohyama Inc.

Iris Ohyama Inc. - Overview
Iris Ohyama Inc. - Product / Service
Iris Ohyama Inc. - Key offerings
SWOT

15.16 Midwest Homes for Pets

Midwest Homes for Pets - Overview
Midwest Homes for Pets - Product / Service
Midwest Homes for Pets - Key offerings
SWOT

15.17 Omlet Ltd.

Omlet Ltd. - Overview
Omlet Ltd. - Product / Service
Omlet Ltd. - Key offerings
SWOT

15.18 Prevue Pet Products

Prevue Pet Products - Overview
Prevue Pet Products - Product / Service
Prevue Pet Products - Key offerings
SWOT

16. Appendix

16.1 Scope of the report

Market definition
Objectives
Notes and caveats

16.2 Inclusions and exclusions checklist

Inclusions checklist
Exclusions checklist

16.3 Currency conversion rates for US$

16.4 Research methodology

16.5 Data procurement

Information sources

16.6 Data validation

16.7 Validation techniques employed for market sizing

16.8 Data synthesis

16.9 360 degree market analysis

16.10 List of abbreviations

Research Methodology

Technavio presents a detailed picture of the market by way of study, synthesis, and summation of data from multiple sources. The analysts have presented the various facets of the market with a particular focus on identifying the key industry influencers. The data thus presented is comprehensive, reliable, and the result of extensive research, both primary and secondary.

INFORMATION SOURCES

Primary sources

  • Manufacturers and suppliers
  • Channel partners
  • Industry experts
  • Strategic decision makers

Secondary sources

  • Industry journals and periodicals
  • Government data
  • Financial reports of key industry players
  • Historical data
  • Press releases

DATA ANALYSIS

Data Synthesis

  • Collation of data
  • Estimation of key figures
  • Analysis of derived insights

Data Validation

  • Triangulation with data models
  • Reference against proprietary databases
  • Corroboration with industry experts

REPORT WRITING

Qualitative

  • Market drivers
  • Market challenges
  • Market trends
  • Five forces analysis

Quantitative

  • Market size and forecast
  • Market segmentation
  • Geographical insights
  • Competitive landscape

Interested in this report?

Get your sample now to see our research methodology and insights!

Download Now

Frequently Asked Questions

Animal Cage market growth will increase by USD 720.5 million during 2026-2030.

The Animal Cage market is expected to grow at a CAGR of 5.1% during 2026-2030.

Animal Cage market is segmented by Distribution channel (B2B, B2C, Online) Material (Stainless steel, Plastic, Others) Animal type (Rodents, Birds, Reptiles, Mammals, Others)

A and E Cage Co., Allentown LLC, Avidity Science LLC, Big Dutchman AG Holding, Central Garden and Pet Co., CTB Inc., FACCO S.p.A., Ferplast Spa, Hellmann Poultry GmbH and Co. KG, IMAC S.p.A., Inter Zoo, Iris Ohyama Inc., Midwest Homes for Pets, Omlet Ltd., Prevue Pet Products, SALMET GmbH and Co. KG, SAVIC, Tecniplast Spa, Thoren, Voltrega S.L. are a few of the key vendors in the Animal Cage market.

APAC will register the highest growth rate of 38.9% among the other regions. Therefore, the Animal Cage market in APAC is expected to garner significant business opportunities for the vendors during the forecast period.

China, Japan, India, South Korea, Australia, Indonesia, US, Canada, Mexico, Germany, UK, France, Italy, Spain, The Netherlands, Brazil, Argentina, Chile, Saudi Arabia, UAE, Turkey, South Africa, Israel

  • Expanding global biopharmaceutical funding driving biomedical housing is the driving factor this market.

The Animal Cage market vendors should focus on grabbing business opportunities from the Distribution channel segment as it accounted for the largest market share in the base year.
RIA - Research AI Assistant
Ask RIA
