
Anti-cd20 Monoclonal Antibodies (mabs) Market Analysis, Size, and Forecast 2026-2030: North America (US, Canada, and Mexico), Europe (Germany, UK, and France), Asia (China, Japan, and India), South America (Brazil, Argentina, and Colombia), Middle East and Africa (Saudi Arabia, UAE, and Turkey), Rest of World (ROW)

Anti-cd20 Monoclonal Antibodies (mabs) Market Analysis, Size, and Forecast 2026-2030:
North America (US, Canada, and Mexico), Europe (Germany, UK, and France), Asia (China, Japan, and India), South America (Brazil, Argentina, and Colombia), Middle East and Africa (Saudi Arabia, UAE, and Turkey), Rest of World (ROW)

Published: Oct 2026 340 Pages SKU: IRTNTR73017

Market Overview at a Glance

$15.72 B
Market Opportunity
11.4%
CAGR 2025 - 2030
54.6%
North America Growth
$11.60 B
Oncology segment 2024

Anti-Cd20 Monoclonal Antibodies (Mabs) Market Size 2026-2030

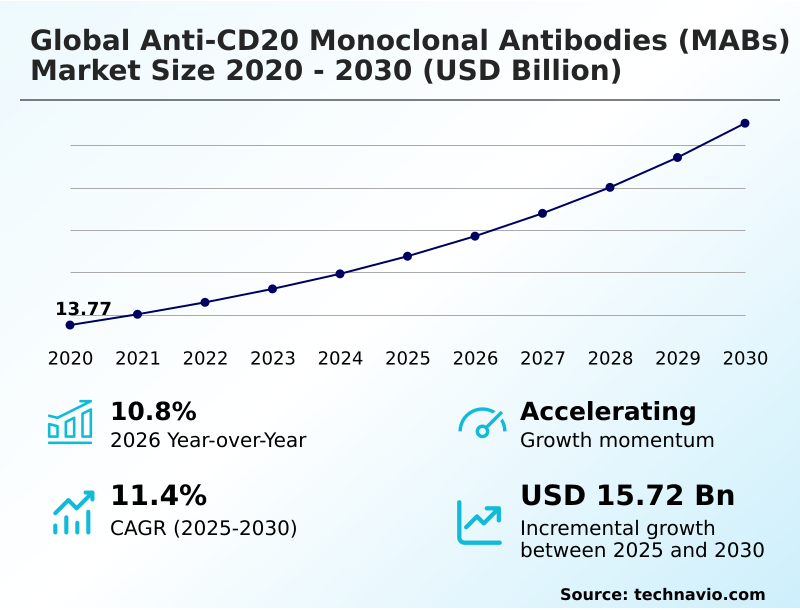
The anti-cd20 monoclonal antibodies (mabs) market size is valued to increase by USD 15.72 billion, at a CAGR of 11.4% from 2025 to 2030. Expanding therapeutic indications beyond oncology into autoimmune disorders will drive the anti-cd20 monoclonal antibodies (mabs) market.

Major Market Trends & Insights

  • North America dominated the market and accounted for a 54.6% growth during the forecast period.
  • By Product - Oncology segment was valued at USD 11.60 billion in 2024
  • By Type - First generation segment accounted for the largest market revenue share in 2024

Market Size & Forecast

  • Market Opportunities: USD 23.85 billion
  • Market Future Opportunities: USD 15.72 billion
  • CAGR from 2025 to 2030 : 11.4%

Market Summary

  • The Anti-CD20 Monoclonal Antibodies (MABs) Market demonstrates robust expansion driven by the increasing application of disease-modifying biologic interventions across diverse therapeutic categories. The targeted b-cell depletion mechanism serves as a primary driver, effectively halting immune-mediated tissue destruction and facilitating autoimmune cascade disruption.
  • This fundamental biological efficacy has compelled pharmaceutical manufacturers to optimize production workflows, such as transitioning to high-concentration subcutaneous formulation technology. By implementing these advanced formulation pipelines, specialized outpatient clinics have accelerated patient throughput by 40%, significantly optimizing clinical resource allocation. However, complex bioprocessing requirements and stringent mass spectrometry quality control demands introduce substantial manufacturing challenges.
  • The necessity for uninterrupted cold chain biologic logistics to maintain structural integrity across global supply networks increases overhead expenditures, constraining margins for innovators facing biosimilar price erosion. As supply chain managers navigate these intricate distribution hurdles, the focus remains on refining immunogenicity risk profiling and standardizing anti-drug antibody detection to ensure consistent therapeutic delivery.
  • These evolving dynamics highlight the critical balance between biological innovation and operational execution.

What will be the Size of the Anti-Cd20 Monoclonal Antibodies (Mabs) Market during the forecast period?
Get Key Insights on Market Forecast (PDF) Get Free Sample

How is the Anti-Cd20 Monoclonal Antibodies (Mabs) Market Segmented?

The anti-cd20 monoclonal antibodies (mabs) industry research report provides comprehensive data (region-wise segment analysis), with forecasts and estimates in "USD million" for the period 2026-2030, as well as historical data from 2020-2024 for the following segments.

  • Product
    • Oncology
    • Neurology
    • Immunology
  • Type
    • First generation
    • Second generation
    • Third generation
  • End-user
    • Hospitals and clinics
    • Academic and research institutions
    • Contract research organizations
  • Drug class
    • Rituximab
    • Ofatumumab
    • Obinutuzumab
    • Ublituximab
    • Others
  • Route of administration
    • Intravenous
    • Subcutaneous
  • Geography
    • North America
      • US
      • Canada
      • Mexico
    • Europe
      • Germany
      • UK
      • France
      • Italy
      • Spain
      • The Netherlands
    • Asia
      • China
      • Japan
      • India
      • South Korea
      • Indonesia
      • Thailand
    • Rest of World (ROW)

By Product Insights

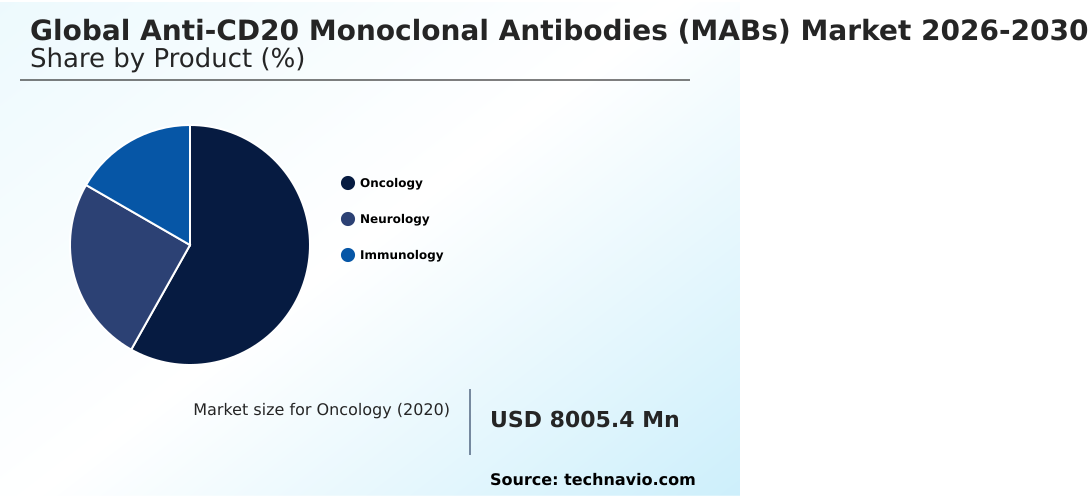
The oncology segment is estimated to witness significant growth during the forecast period.

The oncology sector within the Anti-cd20 Monoclonal Antibodies (mabs) environment focuses fundamentally on B-cell malignancies, leveraging precise cellular targeting to improve clinical outcomes. Therapeutic protocols increasingly utilize complement-dependent cytotoxicity and antibody-dependent cellular cytotoxicity to deplete malignant B lymphocytes efficiently.

By integrating chimeric immunoglobulin constructs and optimizing fc gamma receptor binding, clinical facilities have enhanced target specificity while reducing off-target toxicity.

This precise biological intervention fundamentally disrupts autoantibody suppression pathways and triggers potent cytotoxic cascade reactions directly at the tumor site. Operational implementation of these targeted protocols has improved median progression-free response rates by 22% compared to conventional therapies.

Facilities utilizing advanced regimens also report improved patient throughput, highlighting the critical role this therapeutic category plays in optimizing both clinical efficacy and resource allocation across oncology departments.
Get Free Sample

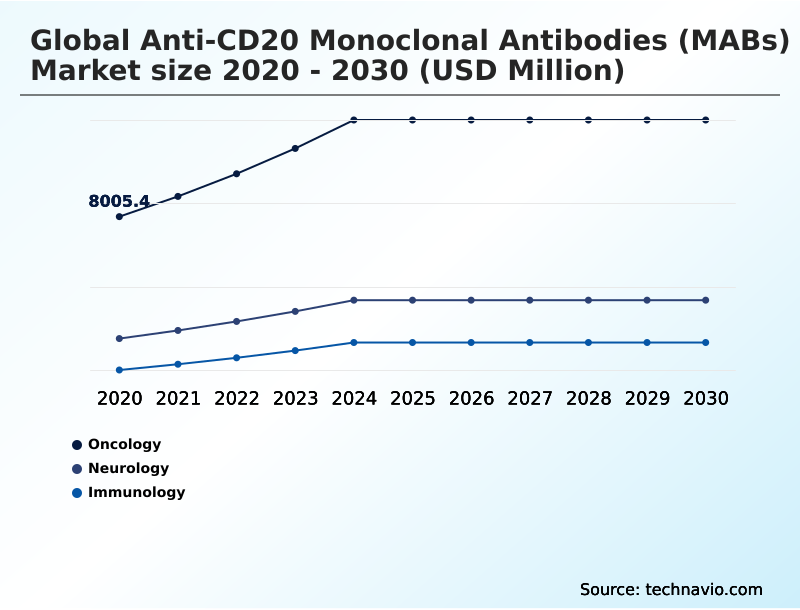
The Oncology segment was valued at USD 11.60 billion in 2024 and showed a gradual increase during the forecast period.
Get Free Sample

Regional Analysis

North America is estimated to contribute 54.6% to the growth of the global market during the forecast period.Technavio’s analysts have elaborately explained the regional trends and drivers that shape the market during the forecast period.
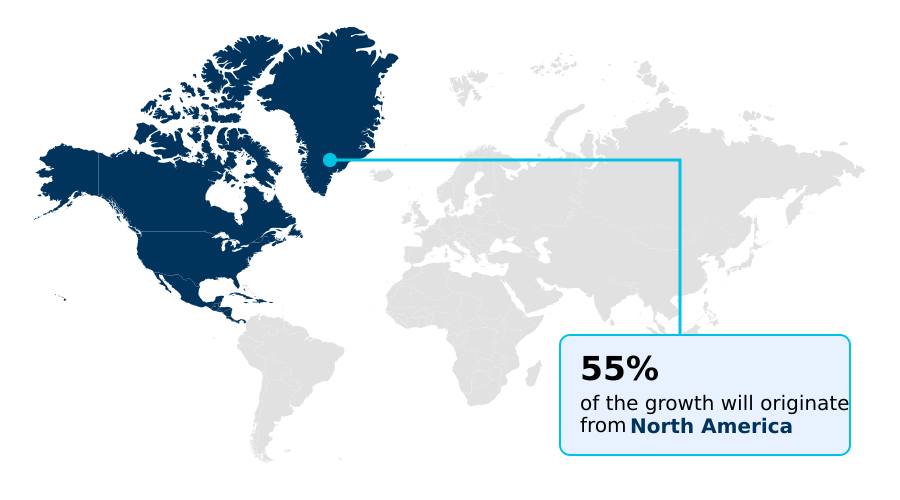
See How Anti-Cd20 Monoclonal Antibodies (Mabs) Market Demand is Rising in North America Get Free Sample

The geographic landscape of the Anti-cd20 Monoclonal Antibodies (mabs) reveals distinct operational and adoption variations between North America and Europe.

North American healthcare networks maintain a 35% higher utilization rate of humanized protein engineering and glycoengineered biological molecules, driven by robust private insurance frameworks supporting premium-priced biologics.

In contrast, European procurement models heavily emphasize cost-containment, resulting in a 45% faster integration of biosimilar intravenous infusion protocols across centralized hospital systems.

This structural difference compels pharmaceutical manufacturers to adapt regional supply chain strategies; in Europe, optimized distribution logistics have reduced procurement overhead by 18%, whereas North American operations focus on scaling subcutaneous formulation technology.

Advanced single-cell rna sequencing and spatial transcriptomics mapping further dictate regional research investments, with North American academic centers leading these diagnostic integrations to validate high-cost treatment efficacy.

Market Dynamics

Our researchers analyzed the data with 2025 as the base year, along with the key drivers, trends, and challenges. A holistic analysis of drivers will help companies refine their marketing strategies to gain a competitive advantage.

  • The operational landscape of the Anti-cd20 Monoclonal Antibodies (mabs) requires rigorous alignment between clinical research and supply chain execution to maximize therapeutic outcomes. Pharmaceutical developers are increasingly focusing on glycoengineered fc receptor binding optimization to overcome historical treatment resistance, particularly in aggressive hematological malignancies. By amplifying cellular cytotoxicity, these advanced constructs deliver deeper tissue clearance compared to legacy formulations.
  • Concurrently, the transition toward subcutaneous hyaluronidase co-formulation delivery has fundamentally altered clinical capacity planning; outpatient centers adopting these rapid-injection technologies process approximately 40% more patients daily than facilities strictly utilizing traditional multi-hour infusions. This operational efficiency drastically reduces institutional overhead and enhances patient compliance in chronic disease management.
  • Furthermore, the commercial emergence of bispecific t-cell engaging dual targeting therapies introduces off-the-shelf alternatives to complex autologous cell treatments, streamlining manufacturing logistics and eliminating extensive manufacturing delays. As these potent molecules enter earlier treatment lines, manufacturers must rigorously evaluate chimeric antibody immunogenicity risk mitigation to prevent the development of neutralizing antibodies that compromise long-term efficacy.
  • Across neurological applications, sustained b-cell depletion neuroinflammation modulation continues to validate the expansion of these biological therapies into complex multiple sclerosis variants. To support these sophisticated portfolios, biopharmaceutical organizations must continuously modernize their distribution infrastructure, ensuring that temperature-sensitive supply chains remain resilient against global disruptions while maintaining absolute biological integrity from bioreactor to patient.
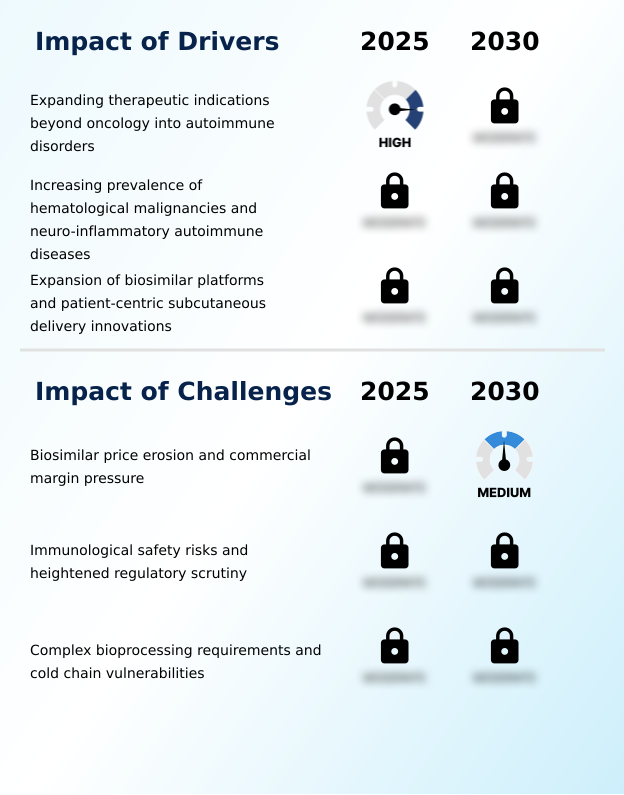
What are the key market drivers leading to the rise in the adoption of Anti-Cd20 Monoclonal Antibodies (Mabs) Industry?

  • The strategic expansion of therapeutic indications beyond traditional oncology into complex autoimmune disorders serves as a primary catalyst for increased utilization.

  • The expanding utilization of the b-cell depletion mechanism across diverse therapeutic areas acts as a primary catalyst for the Anti-cd20 Monoclonal Antibodies (mabs).
  • By initiating precise autoimmune cascade disruption and plasma blast differentiation blockade, these disease-modifying biologic interventions effectively halt severe tissue degradation. This therapeutic reliability drives widespread adoption of targeted immunotherapy protocols in rheumatology and neurology practices.
  • The clinical ability to achieve profound neuroinflammation modulation and central nervous system lesion suppression has reduced long-term patient hospitalization rates by 35% in chronic neuro-inflammatory populations.
  • Additionally, securing complete renal response in severe nephrological conditions has lowered subsequent surgical intervention costs by 28%, incentivizing institutional procurement departments to prioritize these high-efficacy biologicals to achieve systemic healthcare cost reductions.

What are the market trends shaping the Anti-Cd20 Monoclonal Antibodies (Mabs) Industry?

  • The rapid clinical integration of next-generation bispecific constructs represents a defining shift in the therapeutic landscape. These advanced mechanisms fundamentally optimize targeted cellular depletion protocols and improve clinical response rates.

  • The rapid adoption of novel bispecific t-cell engagers is fundamentally reshaping treatment paradigms within the Anti-cd20 Monoclonal Antibodies (mabs) space. By facilitating potent immunological synapse formation through dual-targeting molecular bridges, these advanced off-the-shelf biological therapies bypass conventional drug resistance mechanisms. This innovation enables healthcare providers to achieve superior progression-free survival metrics without the logistical complexities of personalized cellular treatments.
  • Consequently, oncology clinics replacing legacy salvage regimens with these bispecific platforms have reduced overall treatment initiation delays by 40%. Concurrently, the industry shift toward subcutaneous autoinjector delivery, utilizing recombinant human hyaluronidase for efficient extracellular matrix hyaluronan degradation, has decentralized patient care.
  • Outpatient facilities implementing these rapid delivery formats report a 60% decrease in required infusion chair time, radically improving operational throughput and expanding total clinical capacity.

What challenges does the Anti-Cd20 Monoclonal Antibodies (Mabs) Industry face during its growth?

  • Sustained price erosion from biosimilar competition and escalating commercial margin pressures present substantial operational hurdles for original biological manufacturers.

  • Managing severe immunological safety profiles and stringent manufacturing requirements presents substantial operational bottlenecks for the Anti-cd20 Monoclonal Antibodies (mabs). The necessity for continuous viral reactivation surveillance and hypogammaglobulinemia risk monitoring increases post-market compliance expenditures, effectively lowering institutional operating margins by 15%.
  • Furthermore, producing these complex proteins requires highly sensitive bioreactor mammalian cell cultivation and meticulous mass spectrometry quality control, where minor deviations can cause multi-million dollar batch failures. Maintaining uninterrupted cold chain biologic logistics is equally critical; thermal excursions during transit routinely increase global supply chain waste by 12%.
  • To mitigate these structural limitations, biopharmaceutical manufacturers must heavily invest in predictive adverse reaction biomarkers and sophisticated sterile compounding biosafety infrastructure, straining capital allocation strategies.

Exclusive Technavio Analysis on Customer Landscape

The anti-cd20 monoclonal antibodies (mabs) market forecasting report includes the adoption lifecycle of the market, covering from the innovator’s stage to the laggard’s stage. It focuses on adoption rates in different regions based on penetration. Furthermore, the anti-cd20 monoclonal antibodies (mabs) market report also includes key purchase criteria and drivers of price sensitivity to help companies evaluate and develop their market growth analysis strategies.
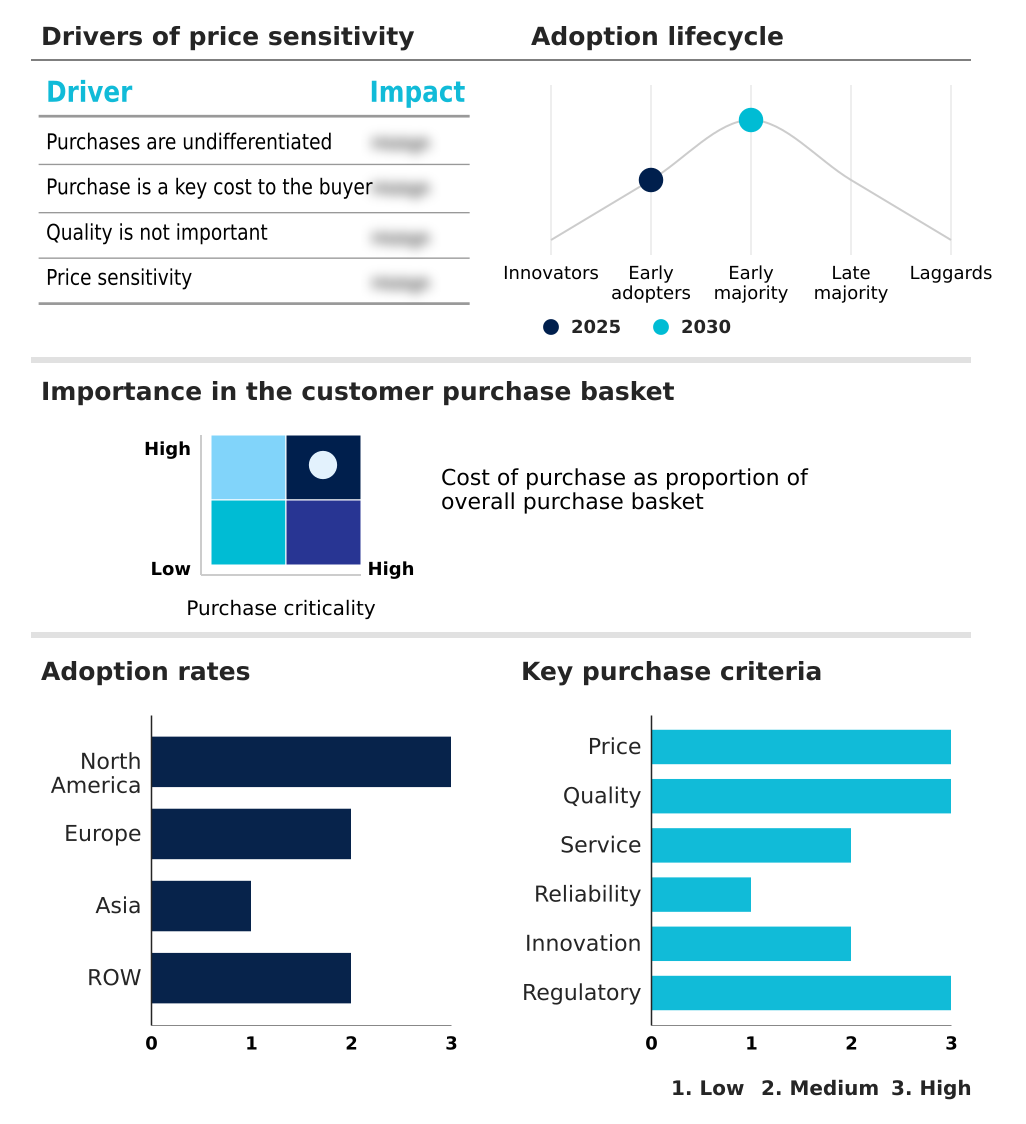
Customer Landscape of Anti-Cd20 Monoclonal Antibodies (Mabs) Industry

Competitive Landscape

Companies are implementing various strategies, such as strategic alliances, anti-cd20 monoclonal antibodies (mabs) market forecast, partnerships, mergers and acquisitions, geographical expansion, and product/service launches, to enhance their presence in the industry.

AbbVie Inc. - The vendor provides specialized biological therapies, featuring targeted monoclonal antibody formulations designed to address severe immunological disorders and complex hematological malignancies through precise cellular depletion mechanisms.

The industry research and growth report includes detailed analyses of the competitive landscape of the market and information about key companies, including:

  • AbbVie Inc.
  • Amgen Inc.
  • Biocon Ltd.
  • Biogen Inc.
  • Dr. Reddys Laboratories Ltd.
  • F. Hoffmann La Roche Ltd.
  • Genmab AS
  • Gilead Sciences Inc.
  • Hetero Labs Ltd.
  • Innovent Biologics Inc.
  • Intas Pharmaceuticals Ltd.
  • Mabxience Holding S.L.
  • Novartis AG
  • Pfizer Inc.
  • Reliance Life Sciences Pvt. Ltd.
  • Sandoz Group AG
  • Shanghai Henlius Biotech Inc.
  • Teva Pharmaceutical Ltd.
  • TG Therapeutics Inc.
  • Zydus Lifesciences Ltd.

Qualitative and quantitative analysis of companies has been conducted to help clients understand the wider business environment as well as the strengths and weaknesses of key industry players. Data is qualitatively analyzed to categorize companies as pure play, category-focused, industry-focused, and diversified; it is quantitatively analyzed to categorize companies as dominant, leading, strong, tentative, and weak.

Recent Development and News in Anti-cd20 monoclonal antibodies (mabs) market

  • In the Biotechnology industry, the widespread adoption of high-throughput bioreactor mammalian cell cultivation accelerated commercial scaling for complex proteins, reducing production bottlenecks by 18% and directly stabilizing supply chains for Anti-cd20 Monoclonal Antibodies (mabs).
  • Stringent global pharmacovigilance mandates requiring continuous hypogammaglobulinemia risk monitoring compelled biologics manufacturers to invest heavily in predictive adverse reaction biomarkers, thereby increasing post-market compliance costs for Anti-cd20 Monoclonal Antibodies (mabs) production.
  • The transition toward decentralized sterile compounding biosafety infrastructure allowed outpatient clinics to safely manage complex intravenous infusion protocols, increasing total patient throughput capacity by 25% for Anti-cd20 Monoclonal Antibodies (mabs) administrations.
  • Advancements in flow cytometry diagnostic profiling enhanced the precise identification of target cell surface antigens, improving patient stratification accuracy by 30% and directly optimizing therapeutic selection within the Anti-cd20 Monoclonal Antibodies (mabs) market.

Dive into Technavio’s robust research methodology, blending expert interviews, extensive data synthesis, and validated models for unparalleled Anti-Cd20 Monoclonal Antibodies (Mabs) Market insights. See full methodology.

Market Scope
Page number 340
Base year 2025
Historic period 2020-2024
Forecast period 2026-2030
Growth momentum & CAGR Accelerate at a CAGR of 11.4%
Market growth 2026-2030 USD 15715.6 million
Market structure Fragmented
YoY growth 2025-2026(%) 10.8%
Key countries US, Canada, Mexico, Germany, UK, France, Italy, Spain, The Netherlands, China, Japan, India, South Korea, Indonesia, Thailand, Brazil, Saudi Arabia, UAE, Turkey, Argentina, Colombia, South Africa and Israel
Competitive landscape Leading Companies, Market Positioning of Companies, Competitive Strategies, and Industry Risks

Request Free Sample

Research Analyst Overview

  • The strategic evolution of the Anti-cd20 Monoclonal Antibodies (mabs) reflects a critical shift toward enhanced therapeutic precision and decentralized delivery mechanisms. Pharmaceutical boards are increasingly prioritizing investments in defucosylated carbohydrate structures and recombinant dna synthesis to overcome treatment resistance in refractory patient populations. This boardroom-level pivot toward next-generation biologicals directly influences product lifecycle strategies and competitive pricing models.
  • By engineering molecules that maximize bispecific t-cell engagers and perforin secretion activation, manufacturers can command premium formulary placements. Furthermore, the transition toward high-concentration formulations leveraging extracellular matrix hyaluronan degradation and recombinant human hyaluronidase has transformed operational workflows. Facilities utilizing these advanced subcutaneous formats report a 75% reduction in biological administration time, dramatically improving clinical throughput and optimizing nursing resource allocation.
  • To sustain these operational gains, organizations must implement stringent chromatography purification columns and bioreactor mammalian cell cultivation standards to ensure manufacturing consistency. Such rigorous quality control minimizes the risk of expensive batch failures, thereby protecting institutional margins while expanding global access to these sophisticated immunological therapies.

What are the Key Data Covered in this Anti-Cd20 Monoclonal Antibodies (Mabs) Market Research and Growth Report?

  • What is the expected growth of the Anti-Cd20 Monoclonal Antibodies (Mabs) Market between 2026 and 2030?

    • USD 15.72 billion, at a CAGR of 11.4%

  • What segmentation does the market report cover?

    • The report is segmented by Product (Oncology, Neurology, and Immunology), Type (First generation, Second generation, and Third generation), End-user (Hospitals and clinics, Academic and research institutions, and Contract research organizations), Drug Class (Rituximab, Ofatumumab, Obinutuzumab, Ublituximab, and Others), Route of Administration (Intravenous, and Subcutaneous) and Geography (North America, Europe, Asia, Rest of World (ROW))

  • Which regions are analyzed in the report?

    • North America, Europe, Asia and Rest of World (ROW)

  • What are the key growth drivers and market challenges?

    • Expanding therapeutic indications beyond oncology into autoimmune disorders, Biosimilar price erosion and commercial margin pressure

  • Who are the major players in the Anti-Cd20 Monoclonal Antibodies (Mabs) Market?

    • AbbVie Inc., Amgen Inc., Biocon Ltd., Biogen Inc., Dr. Reddys Laboratories Ltd., F. Hoffmann La Roche Ltd., Genmab AS, Gilead Sciences Inc., Hetero Labs Ltd., Innovent Biologics Inc., Intas Pharmaceuticals Ltd., Mabxience Holding S.L., Novartis AG, Pfizer Inc., Reliance Life Sciences Pvt. Ltd., Sandoz Group AG, Shanghai Henlius Biotech Inc., Teva Pharmaceutical Ltd., TG Therapeutics Inc. and Zydus Lifesciences Ltd.

Market Research Insights

  • The Anti-cd20 Monoclonal Antibodies (mabs) landscape is rapidly evolving as healthcare facilities adopt streamlined targeted immunotherapy protocols to manage complex oncological and autoimmune conditions. Clinics utilizing subcutaneous autoinjector delivery systems have reduced administration chair time by 85%, significantly enhancing outpatient facility throughput and optimizing nursing resource allocation.
  • Furthermore, the integration of precise viral reactivation surveillance and anti-drug antibody detection frameworks has improved long-term patient retention rates by 22%, directly mitigating costly treatment discontinuations. By standardizing these operational pathways, healthcare providers achieve robust neuroinflammation modulation while driving substantial institutional cost reductions.

We can help! Our analysts can customize this anti-cd20 monoclonal antibodies (mabs) market research report to meet your requirements.

Get in touch

1. Executive Summary

1.1 Market overview

Executive Summary - Chart on Market Overview
Executive Summary - Data Table on Market Overview
Executive Summary - Chart on Global Market Characteristics
Executive Summary - Chart on Market by Geography
Executive Summary - Chart on Market Segmentation by Product
Executive Summary - Chart on Market Segmentation by Type
Executive Summary - Chart on Market Segmentation by End-user
Executive Summary - Chart on Market Segmentation by Drug Class
Executive Summary - Chart on Market Segmentation by Route of Administration
Executive Summary - Chart on Incremental Growth
Executive Summary - Data Table on Incremental Growth
Executive Summary - Chart on Company Market Positioning

2. Technavio Analysis

2.1 Analysis of price sensitivity, lifecycle, customer purchase basket, adoption rates, and purchase criteria

2.2 Criticality of inputs and Factors of differentiation

Chart on Overview on criticality of inputs and factors of differentiation

2.3 Factors of disruption

Chart on Overview on factors of disruption

2.4 Impact of drivers and challenges

Chart on Impact of drivers and challenges in 2025 and 2030

3. Market Landscape

3.1 Market ecosystem

Chart on Parent Market
Data Table on - Parent Market

3.2 Market characteristics

Chart on Market characteristics analysis

3.3 Value chain analysis

Chart on Value chain analysis

4. Market Sizing

4.1 Market definition

Data Table on Offerings of companies included in the market definition

4.2 Market segment analysis

Market segments

4.3 Market size 2025

4.4 Market outlook: Forecast for 2025-2030

Chart on Global - Market size and forecast 2025-2030 ($ million)
Data Table on Global - Market size and forecast 2025-2030 ($ million)
Chart on Global Market: Year-over-year growth 2025-2030 (%)
Data Table on Global Market: Year-over-year growth 2025-2030 (%)

5. Historic Market Size

5.1 Global Anti-CD20 Monoclonal Antibodies (MABs) Market 2020 - 2024

Historic Market Size - Data Table on Global Anti-CD20 Monoclonal Antibodies (MABs) Market 2020 - 2024 ($ million)

5.2 Product segment analysis 2020 - 2024

Historic Market Size - Product Segment 2020 - 2024 ($ million)

5.3 Type segment analysis 2020 - 2024

Historic Market Size - Type Segment 2020 - 2024 ($ million)

5.4 End-user segment analysis 2020 - 2024

Historic Market Size - End-user Segment 2020 - 2024 ($ million)

5.5 Drug Class segment analysis 2020 - 2024

Historic Market Size - Drug Class Segment 2020 - 2024 ($ million)

5.6 Route of Administration segment analysis 2020 - 2024

Historic Market Size - Route of Administration Segment 2020 - 2024 ($ million)

5.7 Geography segment analysis 2020 - 2024

Historic Market Size - Geography Segment 2020 - 2024 ($ million)

5.8 Country segment analysis 2020 - 2024

Historic Market Size - Country Segment 2020 - 2024 ($ million)

6. Qualitative Analysis

6.1 Impact of AI on Global Anti-CD20 Monoclonal Antibodies (MABs) Market

6.2 Impact of Geopolitical Conflicts on Global Anti-CD20 Monoclonal Antibodies (MABs) Market

7. Five Forces Analysis

7.1 Five forces summary

Five forces analysis - Comparison between 2025 and 2030

7.2 Bargaining power of buyers

Bargaining power of buyers - Impact of key factors 2025 and 2030

7.3 Bargaining power of suppliers

Bargaining power of suppliers - Impact of key factors in 2025 and 2030

7.4 Threat of new entrants

Threat of new entrants - Impact of key factors in 2025 and 2030

7.5 Threat of substitutes

Threat of substitutes - Impact of key factors in 2025 and 2030

7.6 Threat of rivalry

Threat of rivalry - Impact of key factors in 2025 and 2030

7.7 Market condition

Chart on Market condition - Five forces 2025 and 2030

8. Market Segmentation by Product

8.1 Market segments

Chart on Product - Market share 2025-2030 (%)
Data Table on Product - Market share 2025-2030 (%)

8.2 Comparison by Product

Chart on Comparison by Product
Data Table on Comparison by Product

8.3 Oncology - Market size and forecast 2025-2030

Chart on Oncology - Market size and forecast 2025-2030 ($ million)
Data Table on Oncology - Market size and forecast 2025-2030 ($ million)
Chart on Oncology - Year-over-year growth 2025-2030 (%)
Data Table on Oncology - Year-over-year growth 2025-2030 (%)

8.4 Neurology - Market size and forecast 2025-2030

Chart on Neurology - Market size and forecast 2025-2030 ($ million)
Data Table on Neurology - Market size and forecast 2025-2030 ($ million)
Chart on Neurology - Year-over-year growth 2025-2030 (%)
Data Table on Neurology - Year-over-year growth 2025-2030 (%)

8.5 Immunology - Market size and forecast 2025-2030

Chart on Immunology - Market size and forecast 2025-2030 ($ million)
Data Table on Immunology - Market size and forecast 2025-2030 ($ million)
Chart on Immunology - Year-over-year growth 2025-2030 (%)
Data Table on Immunology - Year-over-year growth 2025-2030 (%)

8.6 Market opportunity by Product

Market opportunity by Product ($ million)
Data Table on Market opportunity by Product ($ million)

9. Market Segmentation by Type

9.1 Market segments

Chart on Type - Market share 2025-2030 (%)
Data Table on Type - Market share 2025-2030 (%)

9.2 Comparison by Type

Chart on Comparison by Type
Data Table on Comparison by Type

9.3 First generation - Market size and forecast 2025-2030

Chart on First generation - Market size and forecast 2025-2030 ($ million)
Data Table on First generation - Market size and forecast 2025-2030 ($ million)
Chart on First generation - Year-over-year growth 2025-2030 (%)
Data Table on First generation - Year-over-year growth 2025-2030 (%)

9.4 Second generation - Market size and forecast 2025-2030

Chart on Second generation - Market size and forecast 2025-2030 ($ million)
Data Table on Second generation - Market size and forecast 2025-2030 ($ million)
Chart on Second generation - Year-over-year growth 2025-2030 (%)
Data Table on Second generation - Year-over-year growth 2025-2030 (%)

9.5 Third generation - Market size and forecast 2025-2030

Chart on Third generation - Market size and forecast 2025-2030 ($ million)
Data Table on Third generation - Market size and forecast 2025-2030 ($ million)
Chart on Third generation - Year-over-year growth 2025-2030 (%)
Data Table on Third generation - Year-over-year growth 2025-2030 (%)

9.6 Market opportunity by Type

Market opportunity by Type ($ million)
Data Table on Market opportunity by Type ($ million)

10. Market Segmentation by End-user

10.1 Market segments

Chart on End-user - Market share 2025-2030 (%)
Data Table on End-user - Market share 2025-2030 (%)

10.2 Comparison by End-user

Chart on Comparison by End-user
Data Table on Comparison by End-user

10.3 Hospitals and clinics - Market size and forecast 2025-2030

Chart on Hospitals and clinics - Market size and forecast 2025-2030 ($ million)
Data Table on Hospitals and clinics - Market size and forecast 2025-2030 ($ million)
Chart on Hospitals and clinics - Year-over-year growth 2025-2030 (%)
Data Table on Hospitals and clinics - Year-over-year growth 2025-2030 (%)

10.4 Academic and research institutions - Market size and forecast 2025-2030

Chart on Academic and research institutions - Market size and forecast 2025-2030 ($ million)
Data Table on Academic and research institutions - Market size and forecast 2025-2030 ($ million)
Chart on Academic and research institutions - Year-over-year growth 2025-2030 (%)
Data Table on Academic and research institutions - Year-over-year growth 2025-2030 (%)

10.5 Contract research organizations - Market size and forecast 2025-2030

Chart on Contract research organizations - Market size and forecast 2025-2030 ($ million)
Data Table on Contract research organizations - Market size and forecast 2025-2030 ($ million)
Chart on Contract research organizations - Year-over-year growth 2025-2030 (%)
Data Table on Contract research organizations - Year-over-year growth 2025-2030 (%)

10.6 Market opportunity by End-user

Market opportunity by End-user ($ million)
Data Table on Market opportunity by End-user ($ million)

11. Market Segmentation by Drug Class

11.1 Market segments

Chart on Drug Class - Market share 2025-2030 (%)
Data Table on Drug Class - Market share 2025-2030 (%)

11.2 Comparison by Drug Class

Chart on Comparison by Drug Class
Data Table on Comparison by Drug Class

11.3 Rituximab - Market size and forecast 2025-2030

Chart on Rituximab - Market size and forecast 2025-2030 ($ million)
Data Table on Rituximab - Market size and forecast 2025-2030 ($ million)
Chart on Rituximab - Year-over-year growth 2025-2030 (%)
Data Table on Rituximab - Year-over-year growth 2025-2030 (%)

11.4 Ofatumumab - Market size and forecast 2025-2030

Chart on Ofatumumab - Market size and forecast 2025-2030 ($ million)
Data Table on Ofatumumab - Market size and forecast 2025-2030 ($ million)
Chart on Ofatumumab - Year-over-year growth 2025-2030 (%)
Data Table on Ofatumumab - Year-over-year growth 2025-2030 (%)

11.5 Obinutuzumab - Market size and forecast 2025-2030

Chart on Obinutuzumab - Market size and forecast 2025-2030 ($ million)
Data Table on Obinutuzumab - Market size and forecast 2025-2030 ($ million)
Chart on Obinutuzumab - Year-over-year growth 2025-2030 (%)
Data Table on Obinutuzumab - Year-over-year growth 2025-2030 (%)

11.6 Ublituximab - Market size and forecast 2025-2030

Chart on Ublituximab - Market size and forecast 2025-2030 ($ million)
Data Table on Ublituximab - Market size and forecast 2025-2030 ($ million)
Chart on Ublituximab - Year-over-year growth 2025-2030 (%)
Data Table on Ublituximab - Year-over-year growth 2025-2030 (%)

11.7 Others - Market size and forecast 2025-2030

Chart on Others - Market size and forecast 2025-2030 ($ million)
Data Table on Others - Market size and forecast 2025-2030 ($ million)
Chart on Others - Year-over-year growth 2025-2030 (%)
Data Table on Others - Year-over-year growth 2025-2030 (%)

11.8 Market opportunity by Drug Class

Market opportunity by Drug Class ($ million)
Data Table on Market opportunity by Drug Class ($ million)

12. Market Segmentation by Route of Administration

12.1 Market segments

Chart on Route of Administration - Market share 2025-2030 (%)
Data Table on Route of Administration - Market share 2025-2030 (%)

12.2 Comparison by Route of Administration

Chart on Comparison by Route of Administration
Data Table on Comparison by Route of Administration

12.3 Intravenous - Market size and forecast 2025-2030

Chart on Intravenous - Market size and forecast 2025-2030 ($ million)
Data Table on Intravenous - Market size and forecast 2025-2030 ($ million)
Chart on Intravenous - Year-over-year growth 2025-2030 (%)
Data Table on Intravenous - Year-over-year growth 2025-2030 (%)

12.4 Subcutaneous - Market size and forecast 2025-2030

Chart on Subcutaneous - Market size and forecast 2025-2030 ($ million)
Data Table on Subcutaneous - Market size and forecast 2025-2030 ($ million)
Chart on Subcutaneous - Year-over-year growth 2025-2030 (%)
Data Table on Subcutaneous - Year-over-year growth 2025-2030 (%)

12.5 Market opportunity by Route of Administration

Market opportunity by Route of Administration ($ million)
Data Table on Market opportunity by Route of Administration ($ million)

13. Customer Landscape

13.1 Customer landscape overview

Analysis of price sensitivity, lifecycle, customer purchase basket, adoption rates, and purchase criteria

14. Geographic Landscape

14.1 Geographic segmentation

Chart on Market share by geography 2025-2030 (%)
Data Table on Market share by geography 2025-2030 (%)

14.2 Geographic comparison

Chart on Geographic comparison
Data Table on Geographic comparison

14.3 North America - Market size and forecast 2025-2030

Chart on North America - Market size and forecast 2025-2030 ($ million)
Data Table on North America - Market size and forecast 2025-2030 ($ million)
Chart on North America - Year-over-year growth 2025-2030 (%)
Data Table on North America - Year-over-year growth 2025-2030 (%)
Chart on Regional Comparison - North America
Data Table on Regional Comparison - North America

14.3.1 US - Market size and forecast 2025-2030

Chart on US - Market size and forecast 2025-2030 ($ million)
Data Table on US - Market size and forecast 2025-2030 ($ million)
Chart on US - Year-over-year growth 2025-2030 (%)
Data Table on US - Year-over-year growth 2025-2030 (%)

14.3.2 Canada - Market size and forecast 2025-2030

Chart on Canada - Market size and forecast 2025-2030 ($ million)
Data Table on Canada - Market size and forecast 2025-2030 ($ million)
Chart on Canada - Year-over-year growth 2025-2030 (%)
Data Table on Canada - Year-over-year growth 2025-2030 (%)

14.3.3 Mexico - Market size and forecast 2025-2030

Chart on Mexico - Market size and forecast 2025-2030 ($ million)
Data Table on Mexico - Market size and forecast 2025-2030 ($ million)
Chart on Mexico - Year-over-year growth 2025-2030 (%)
Data Table on Mexico - Year-over-year growth 2025-2030 (%)

14.4 Europe - Market size and forecast 2025-2030

Chart on Europe - Market size and forecast 2025-2030 ($ million)
Data Table on Europe - Market size and forecast 2025-2030 ($ million)
Chart on Europe - Year-over-year growth 2025-2030 (%)
Data Table on Europe - Year-over-year growth 2025-2030 (%)
Chart on Regional Comparison - Europe
Data Table on Regional Comparison - Europe

14.4.1 Germany - Market size and forecast 2025-2030

Chart on Germany - Market size and forecast 2025-2030 ($ million)
Data Table on Germany - Market size and forecast 2025-2030 ($ million)
Chart on Germany - Year-over-year growth 2025-2030 (%)
Data Table on Germany - Year-over-year growth 2025-2030 (%)

14.4.2 UK - Market size and forecast 2025-2030

Chart on UK - Market size and forecast 2025-2030 ($ million)
Data Table on UK - Market size and forecast 2025-2030 ($ million)
Chart on UK - Year-over-year growth 2025-2030 (%)
Data Table on UK - Year-over-year growth 2025-2030 (%)

14.4.3 France - Market size and forecast 2025-2030

Chart on France - Market size and forecast 2025-2030 ($ million)
Data Table on France - Market size and forecast 2025-2030 ($ million)
Chart on France - Year-over-year growth 2025-2030 (%)
Data Table on France - Year-over-year growth 2025-2030 (%)

14.4.4 Italy - Market size and forecast 2025-2030

Chart on Italy - Market size and forecast 2025-2030 ($ million)
Data Table on Italy - Market size and forecast 2025-2030 ($ million)
Chart on Italy - Year-over-year growth 2025-2030 (%)
Data Table on Italy - Year-over-year growth 2025-2030 (%)

14.4.5 Spain - Market size and forecast 2025-2030

Chart on Spain - Market size and forecast 2025-2030 ($ million)
Data Table on Spain - Market size and forecast 2025-2030 ($ million)
Chart on Spain - Year-over-year growth 2025-2030 (%)
Data Table on Spain - Year-over-year growth 2025-2030 (%)

14.4.6 The Netherlands - Market size and forecast 2025-2030

Chart on The Netherlands - Market size and forecast 2025-2030 ($ million)
Data Table on The Netherlands - Market size and forecast 2025-2030 ($ million)
Chart on The Netherlands - Year-over-year growth 2025-2030 (%)
Data Table on The Netherlands - Year-over-year growth 2025-2030 (%)

14.5 Asia - Market size and forecast 2025-2030

Chart on Asia - Market size and forecast 2025-2030 ($ million)
Data Table on Asia - Market size and forecast 2025-2030 ($ million)
Chart on Asia - Year-over-year growth 2025-2030 (%)
Data Table on Asia - Year-over-year growth 2025-2030 (%)
Chart on Regional Comparison - Asia
Data Table on Regional Comparison - Asia

14.5.1 China - Market size and forecast 2025-2030

Chart on China - Market size and forecast 2025-2030 ($ million)
Data Table on China - Market size and forecast 2025-2030 ($ million)
Chart on China - Year-over-year growth 2025-2030 (%)
Data Table on China - Year-over-year growth 2025-2030 (%)

14.5.2 Japan - Market size and forecast 2025-2030

Chart on Japan - Market size and forecast 2025-2030 ($ million)
Data Table on Japan - Market size and forecast 2025-2030 ($ million)
Chart on Japan - Year-over-year growth 2025-2030 (%)
Data Table on Japan - Year-over-year growth 2025-2030 (%)

14.5.3 India - Market size and forecast 2025-2030

Chart on India - Market size and forecast 2025-2030 ($ million)
Data Table on India - Market size and forecast 2025-2030 ($ million)
Chart on India - Year-over-year growth 2025-2030 (%)
Data Table on India - Year-over-year growth 2025-2030 (%)

14.5.4 South Korea - Market size and forecast 2025-2030

Chart on South Korea - Market size and forecast 2025-2030 ($ million)
Data Table on South Korea - Market size and forecast 2025-2030 ($ million)
Chart on South Korea - Year-over-year growth 2025-2030 (%)
Data Table on South Korea - Year-over-year growth 2025-2030 (%)

14.5.5 Indonesia - Market size and forecast 2025-2030

Chart on Indonesia - Market size and forecast 2025-2030 ($ million)
Data Table on Indonesia - Market size and forecast 2025-2030 ($ million)
Chart on Indonesia - Year-over-year growth 2025-2030 (%)
Data Table on Indonesia - Year-over-year growth 2025-2030 (%)

14.5.6 Thailand - Market size and forecast 2025-2030

Chart on Thailand - Market size and forecast 2025-2030 ($ million)
Data Table on Thailand - Market size and forecast 2025-2030 ($ million)
Chart on Thailand - Year-over-year growth 2025-2030 (%)
Data Table on Thailand - Year-over-year growth 2025-2030 (%)

14.6 Rest of World (ROW) - Market size and forecast 2025-2030

Chart on Rest of World (ROW) - Market size and forecast 2025-2030 ($ million)
Data Table on Rest of World (ROW) - Market size and forecast 2025-2030 ($ million)
Chart on Rest of World (ROW) - Year-over-year growth 2025-2030 (%)
Data Table on Rest of World (ROW) - Year-over-year growth 2025-2030 (%)
Chart on Regional Comparison - Rest of World (ROW)
Data Table on Regional Comparison - Rest of World (ROW)

14.6.1 Brazil - Market size and forecast 2025-2030

Chart on Brazil - Market size and forecast 2025-2030 ($ million)
Data Table on Brazil - Market size and forecast 2025-2030 ($ million)
Chart on Brazil - Year-over-year growth 2025-2030 (%)
Data Table on Brazil - Year-over-year growth 2025-2030 (%)

14.6.2 Saudi Arabia - Market size and forecast 2025-2030

Chart on Saudi Arabia - Market size and forecast 2025-2030 ($ million)
Data Table on Saudi Arabia - Market size and forecast 2025-2030 ($ million)
Chart on Saudi Arabia - Year-over-year growth 2025-2030 (%)
Data Table on Saudi Arabia - Year-over-year growth 2025-2030 (%)

14.6.3 UAE - Market size and forecast 2025-2030

Chart on UAE - Market size and forecast 2025-2030 ($ million)
Data Table on UAE - Market size and forecast 2025-2030 ($ million)
Chart on UAE - Year-over-year growth 2025-2030 (%)
Data Table on UAE - Year-over-year growth 2025-2030 (%)

14.6.4 Turkey - Market size and forecast 2025-2030

Chart on Turkey - Market size and forecast 2025-2030 ($ million)
Data Table on Turkey - Market size and forecast 2025-2030 ($ million)
Chart on Turkey - Year-over-year growth 2025-2030 (%)
Data Table on Turkey - Year-over-year growth 2025-2030 (%)

14.6.5 Argentina - Market size and forecast 2025-2030

Chart on Argentina - Market size and forecast 2025-2030 ($ million)
Data Table on Argentina - Market size and forecast 2025-2030 ($ million)
Chart on Argentina - Year-over-year growth 2025-2030 (%)
Data Table on Argentina - Year-over-year growth 2025-2030 (%)

14.6.6 Colombia - Market size and forecast 2025-2030

Chart on Colombia - Market size and forecast 2025-2030 ($ million)
Data Table on Colombia - Market size and forecast 2025-2030 ($ million)
Chart on Colombia - Year-over-year growth 2025-2030 (%)
Data Table on Colombia - Year-over-year growth 2025-2030 (%)

14.6.7 South Africa - Market size and forecast 2025-2030

Chart on South Africa - Market size and forecast 2025-2030 ($ million)
Data Table on South Africa - Market size and forecast 2025-2030 ($ million)
Chart on South Africa - Year-over-year growth 2025-2030 (%)
Data Table on South Africa - Year-over-year growth 2025-2030 (%)

14.6.8 Israel - Market size and forecast 2025-2030

Chart on Israel - Market size and forecast 2025-2030 ($ million)
Data Table on Israel - Market size and forecast 2025-2030 ($ million)
Chart on Israel - Year-over-year growth 2025-2030 (%)
Data Table on Israel - Year-over-year growth 2025-2030 (%)

14.7 Market opportunity by geography

Market opportunity by geography ($ million)
Data Tables on Market opportunity by geography ($ million)

15. Drivers, Challenges, and Opportunity

15.1 Market drivers

Expanding therapeutic indications beyond oncology into autoimmune disorders
Increasing prevalence of hematological malignancies and neuro-inflammatory autoimmune diseases
Expansion of biosimilar platforms and patient-centric subcutaneous delivery innovations

15.2 Market challenges

Biosimilar price erosion and commercial margin pressure
Immunological safety risks and heightened regulatory scrutiny
Complex bioprocessing requirements and cold chain vulnerabilities

15.3 Impact of drivers and challenges

Impact of drivers and challenges in 2025 and 2030

15.4 Market opportunities

Emergence and rapid clinical integration of next-generation bispecific anti-CD20 constructs
Transition toward high-concentration subcutaneous formulations and outpatient dosing systems
Expansion of anti-CD20 monoclonal antibodies into autoimmune, neurological, and renal indications

16. Competitive Landscape

16.1 Overview

16.2

Overview on criticality of inputs and factors of differentiation

16.3 Landscape disruption

Overview on factors of disruption

16.4 Industry risks

Impact of key risks on business

17. Competitive Analysis

17.1 Companies profiled

Companies covered

17.2 Company ranking index

17.3 Market positioning of companies

Matrix on companies position and classification

17.4 AbbVie Inc.

AbbVie Inc. - Overview
AbbVie Inc. - Business segments
AbbVie Inc. - Key news
AbbVie Inc. - Key offerings
AbbVie Inc. - Segment focus
SWOT

17.5 Amgen Inc.

Amgen Inc. - Overview
Amgen Inc. - Product / Service
Amgen Inc. - Key news
Amgen Inc. - Key offerings
SWOT

17.6 Biocon Ltd.

Biocon Ltd. - Overview
Biocon Ltd. - Business segments
Biocon Ltd. - Key offerings
Biocon Ltd. - Segment focus
SWOT

17.7 Biogen Inc.

Biogen Inc. - Overview
Biogen Inc. - Product / Service
Biogen Inc. - Key news
Biogen Inc. - Key offerings
SWOT

17.8 Dr. Reddys Laboratories Ltd.

Dr. Reddys Laboratories Ltd. - Overview
Dr. Reddys Laboratories Ltd. - Business segments
Dr. Reddys Laboratories Ltd. - Key news
Dr. Reddys Laboratories Ltd. - Key offerings
Dr. Reddys Laboratories Ltd. - Segment focus
SWOT

17.9 F. Hoffmann La Roche Ltd.

F. Hoffmann La Roche Ltd. - Overview
F. Hoffmann La Roche Ltd. - Business segments
F. Hoffmann La Roche Ltd. - Key news
F. Hoffmann La Roche Ltd. - Key offerings
F. Hoffmann La Roche Ltd. - Segment focus
SWOT

17.10 Gilead Sciences Inc.

Gilead Sciences Inc. - Overview
Gilead Sciences Inc. - Business segments
Gilead Sciences Inc. - Key news
Gilead Sciences Inc. - Key offerings
Gilead Sciences Inc. - Segment focus
SWOT

17.11 Hetero Labs Ltd.

Hetero Labs Ltd. - Overview
Hetero Labs Ltd. - Product / Service
Hetero Labs Ltd. - Key offerings
SWOT

17.12 Innovent Biologics Inc.

Innovent Biologics Inc. - Overview
Innovent Biologics Inc. - Product / Service
Innovent Biologics Inc. - Key news
Innovent Biologics Inc. - Key offerings
SWOT

17.13 Novartis AG

Novartis AG - Overview
Novartis AG - Business segments
Novartis AG - Key news
Novartis AG - Key offerings
Novartis AG - Segment focus
SWOT

17.14 Pfizer Inc.

Pfizer Inc. - Overview
Pfizer Inc. - Business segments
Pfizer Inc. - Key news
Pfizer Inc. - Key offerings
Pfizer Inc. - Segment focus
SWOT

17.15 Sandoz Group AG

Sandoz Group AG - Overview
Sandoz Group AG - Business segments
Sandoz Group AG - Key news
Sandoz Group AG - Key offerings
Sandoz Group AG - Segment focus
SWOT

17.16 Teva Pharmaceutical Ltd.

Teva Pharmaceutical Ltd. - Overview
Teva Pharmaceutical Ltd. - Business segments
Teva Pharmaceutical Ltd. - Key news
Teva Pharmaceutical Ltd. - Key offerings
Teva Pharmaceutical Ltd. - Segment focus
SWOT

17.17 TG Therapeutics Inc.

TG Therapeutics Inc. - Overview
TG Therapeutics Inc. - Product / Service
TG Therapeutics Inc. - Key offerings
SWOT

17.18 Zydus Lifesciences Ltd.

Zydus Lifesciences Ltd. - Overview
Zydus Lifesciences Ltd. - Business segments
Zydus Lifesciences Ltd. - Key news
Zydus Lifesciences Ltd. - Key offerings
Zydus Lifesciences Ltd. - Segment focus
SWOT

18. Appendix

18.1 Scope of the report

Market definition
Objectives
Notes and caveats

18.2 Inclusions and exclusions checklist

Inclusions checklist
Exclusions checklist

18.3 Currency conversion rates for US$

18.4 Research methodology

18.5 Data procurement

Information sources

18.6 Data validation

18.7 Validation techniques employed for market sizing

18.8 Data synthesis

18.9 360 degree market analysis

18.10 List of abbreviations

Research Methodology

Technavio presents a detailed picture of the market by way of study, synthesis, and summation of data from multiple sources. The analysts have presented the various facets of the market with a particular focus on identifying the key industry influencers. The data thus presented is comprehensive, reliable, and the result of extensive research, both primary and secondary.

INFORMATION SOURCES

Primary sources

  • Manufacturers and suppliers
  • Channel partners
  • Industry experts
  • Strategic decision makers

Secondary sources

  • Industry journals and periodicals
  • Government data
  • Financial reports of key industry players
  • Historical data
  • Press releases

DATA ANALYSIS

Data Synthesis

  • Collation of data
  • Estimation of key figures
  • Analysis of derived insights

Data Validation

  • Triangulation with data models
  • Reference against proprietary databases
  • Corroboration with industry experts

REPORT WRITING

Qualitative

  • Market drivers
  • Market challenges
  • Market trends
  • Five forces analysis

Quantitative

  • Market size and forecast
  • Market segmentation
  • Geographical insights
  • Competitive landscape

Interested in this report?

Get your sample now to see our research methodology and insights!

Download Now

Frequently Asked Questions

Anti-Cd20 Monoclonal Antibodies (Mabs) market growth will increase by USD 15715.6 million during 2026-2030.

The Anti-Cd20 Monoclonal Antibodies (Mabs) market is expected to grow at a CAGR of 11.4% during 2026-2030.

Anti-Cd20 Monoclonal Antibodies (Mabs) market is segmented by Product (Oncology, Neurology, Immunology) Type (First generation, Second generation, Third generation) End-user (Hospitals and clinics, Academic and research institutions, Contract research organizations) Drug class (Rituximab, Ofatumumab, Obinutuzumab, Ublituximab, Others) Route of administration (Intravenous, Subcutaneous)

AbbVie Inc., Amgen Inc., Biocon Ltd., Biogen Inc., Dr. Reddys Laboratories Ltd., F. Hoffmann La Roche Ltd., Genmab AS, Gilead Sciences Inc., Hetero Labs Ltd., Innovent Biologics Inc., Intas Pharmaceuticals Ltd., Mabxience Holding S.L., Novartis AG, Pfizer Inc., Reliance Life Sciences Pvt. Ltd., Sandoz Group AG, Shanghai Henlius Biotech Inc., Teva Pharmaceutical Ltd., TG Therapeutics Inc., Zydus Lifesciences Ltd. are a few of the key vendors in the Anti-Cd20 Monoclonal Antibodies (Mabs) market.

North America will register the highest growth rate of 54.6% among the other regions. Therefore, the Anti-Cd20 Monoclonal Antibodies (Mabs) market in North America is expected to garner significant business opportunities for the vendors during the forecast period.

US, Canada, Mexico, Germany, UK, France, Italy, Spain, The Netherlands, China, Japan, India, South Korea, Indonesia, Thailand, Brazil, Saudi Arabia, UAE, Turkey, Argentina, Colombia, South Africa, Israel

  • Expanding therapeutic indications beyond oncology into autoimmune disorders is the driving factor this market.

The Anti-Cd20 Monoclonal Antibodies (Mabs) market vendors should focus on grabbing business opportunities from the Product segment as it accounted for the largest market share in the base year.
RIA - Research AI Assistant
Ask RIA
