
Antimicrobial Therapeutics Market Analysis, Size, and Forecast 2026-2030: North America (US, Canada, and Mexico), Europe (Germany, UK, and France), Asia (China, Japan, and India), South America (Brazil, Argentina, and Colombia), Middle East and Africa (Saudi Arabia, Turkey, and UAE), Rest of World (ROW)

Antimicrobial Therapeutics Market Analysis, Size, and Forecast 2026-2030:
North America (US, Canada, and Mexico), Europe (Germany, UK, and France), Asia (China, Japan, and India), South America (Brazil, Argentina, and Colombia), Middle East and Africa (Saudi Arabia, Turkey, and UAE), Rest of World (ROW)

Published: Oct 2026 307 Pages SKU: IRTNTR43391

Market Overview at a Glance

$65.67 B
Market Opportunity
6.1%
CAGR 2025 - 2030
34.2%
North America Growth
$101.97 B
Antiviral segment 2024

Antimicrobial Therapeutics Market Size 2026-2030

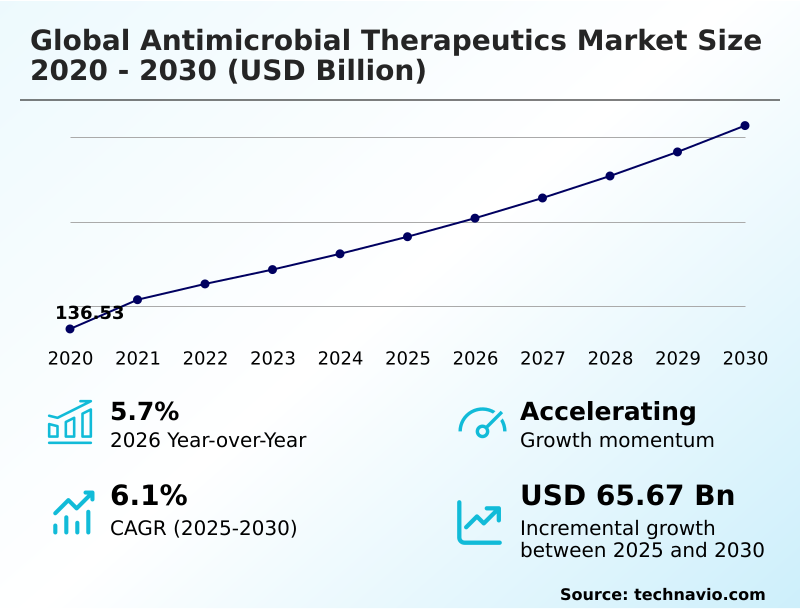
The antimicrobial therapeutics market size is valued to increase by USD 65.67 billion, at a CAGR of 6.1% from 2025 to 2030. Escalating global prevalence of antimicrobial resistance and multi-drug resistant pathogens will drive the antimicrobial therapeutics market.

Major Market Trends & Insights

  • North America dominated the market and accounted for a 34.2% growth during the forecast period.
  • By Application - Antiviral segment was valued at USD 101.97 billion in 2024
  • By End-user - Pharmacies segment accounted for the largest market revenue share in 2024

Market Size & Forecast

  • Market Opportunities: USD 120.17 billion
  • Market Future Opportunities: USD 65.67 billion
  • CAGR from 2025 to 2030 : 6.1%

Market Summary

  • The Antimicrobial Therapeutics Market demonstrates structural transformation as clinical institutions confront highly adaptive pathogens necessitating advanced pharmacological interventions. Hospitals increasingly shift away from empiric prescribing toward precision infection management to safeguard patient outcomes. As a primary demand catalyst, the escalating prevalence of multidrug-resistant organisms forces networks to rapidly adopt novel formulations that bypass established resistance pathways.
  • Conversely, complex regulatory evaluation frameworks create significant operational bottlenecks, delaying the commercialization of essential treatments. To circumvent these constraints, pharmaceutical manufacturers integrate AI-enabled screening platforms to optimize active pharmaceutical ingredient sourcing, successfully reducing target identification costs by 18% compared to traditional laboratory methodologies. This technological integration enhances inventory planning and fortifies clinical supply chains against disruptions.
  • Such data-driven approaches align with stringent antimicrobial stewardship protocols, ensuring sustainable resource allocation across the healthcare landscape.

What will be the Size of the Antimicrobial Therapeutics Market during the forecast period?
Get Key Insights on Market Forecast (PDF) Get Free Sample

How is the Antimicrobial Therapeutics Market Segmented?

The antimicrobial therapeutics industry research report provides comprehensive data (region-wise segment analysis), with forecasts and estimates in "USD million" for the period 2026-2030, as well as historical data from 2020-2024 for the following segments.

  • Application
    • Antiviral
    • Antibacterial
    • Antifungal
    • Antiparasitic
  • End-user
    • Pharmacies
    • Hospitals and clinics
    • Research and academic institutes
  • Route of administration
    • Oral
    • Intravenous
    • Topical
    • Others
  • Geography
    • North America
      • US
      • Canada
      • Mexico
    • Europe
      • Germany
      • UK
      • France
      • Italy
      • Spain
      • The Netherlands
    • Asia
      • China
      • Japan
      • India
      • South Korea
      • Indonesia
      • Thailand
    • Rest of World (ROW)

By Application Insights

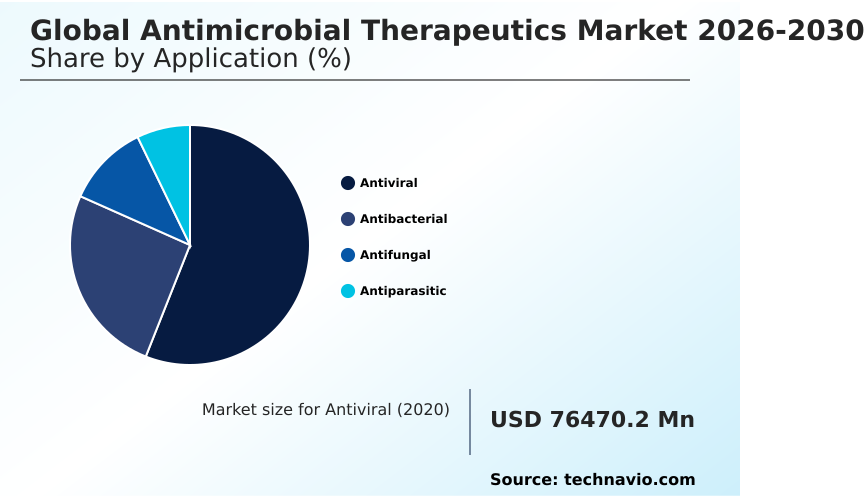
The antiviral segment is estimated to witness significant growth during the forecast period.

The antiviral segment of the Antimicrobial Therapeutics Market demonstrates critical structural evolution as developers prioritize acute viral pathogen neutralization. This segment targets distinct intracellular viral replication processes to address widespread public health concerns through precision infection management.

Operational focus has shifted toward formulating long-acting combination regimens that enhance patient adherence. Manufacturers utilizing advanced bioinformatics platforms have achieved a 22% improvement in molecule targeting accuracy during early-phase research.

These precision-driven developments enable efficient outpatient antimicrobial administration, reducing the burden on acute care facilities. The strategic alignment of formulation techniques directly impacts commercial viability, establishing sustainable revenue streams for pharmaceutical developers navigating expedited clinical trials.

Integrating genomic surveillance tools alongside multiplex diagnostic panels ensures accurate pharmacokinetic profiling and therapeutic drug monitoring during clinical treatment.
Get Free Sample

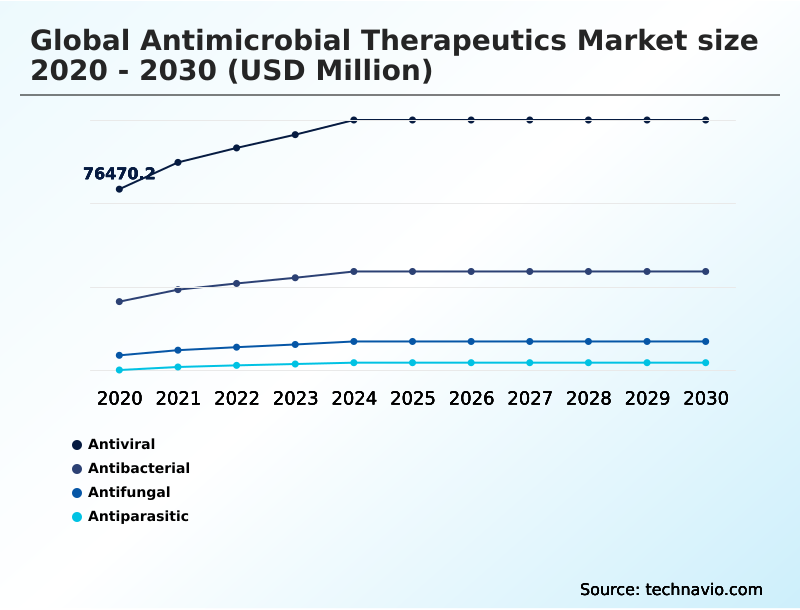
The Antiviral segment was valued at USD 101.97 billion in 2024 and showed a gradual increase during the forecast period.
Get Free Sample

Regional Analysis

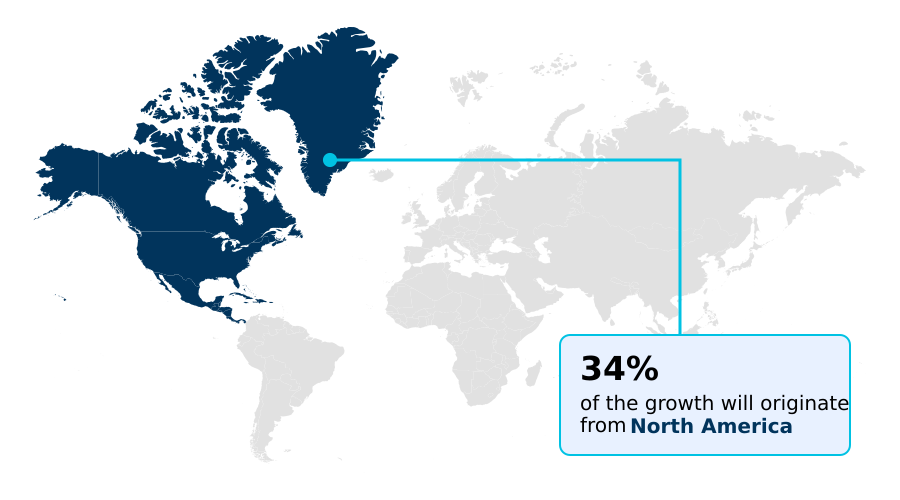
North America is estimated to contribute 34.2% to the growth of the global market during the forecast period.Technavio’s analysts have elaborately explained the regional trends and drivers that shape the market during the forecast period.
See How Antimicrobial Therapeutics Market Demand is Rising in North America Get Free Sample

The geographic landscape of the Antimicrobial Therapeutics Market reveals distinct operational contrasts, particularly between North America and Europe.

North American healthcare networks aggressively deploy molecular epidemiological tracking mechanisms, achieving a 28% higher adoption rate of targeted therapeutics than their European counterparts. This disparity stems from decentralized, rapid-deployment clinical models that prioritize bioavailability optimization for critical patient cohorts.

Conversely, Europe centralized health authorities emphasize stringent pharmacoeconomic evaluations and centralized procurement models, resulting in a 19% reduction in overall therapeutic procurement costs compared to North American benchmarks.

European institutions heavily rely on reserve antibiotic stockpiling to manage localized outbreaks efficiently. Both regions are actively refining active pharmaceutical ingredient sourcing strategies, though North America maintains a 14% efficiency advantage in integrating real-time diagnostics into frontline hospital formulary adoption.

These regional strategies reflect differing regulatory priorities, directly influencing how pharmaceutical supply chains allocate advanced combination regimens to ensure strict nosocomial infection control globally.

Market Dynamics

Our researchers analyzed the data with 2025 as the base year, along with the key drivers, trends, and challenges. A holistic analysis of drivers will help companies refine their marketing strategies to gain a competitive advantage.

  • The Antimicrobial Therapeutics Market requires sophisticated clinical methodologies as healthcare providers face escalating bacterial and viral threats. Implementing carbapenem-resistant infection clinical protocols is critical for improving patient recovery trajectories in acute care settings. Institutions relying on precision diagnostics for microbial resistance experience significantly lower treatment failure rates, outperforming traditional diagnostic facilities by a nearly two-to-one ratio in patient throughput efficiency.
  • This operational advantage drives the rapid narrow-spectrum therapy hospital deployment across major metropolitan health networks. However, manufacturers continuously navigate active pharmaceutical ingredient supply constraints that threaten to disrupt the consistent availability of critical medications. To overcome these barriers, researchers focus on developing metallo-beta-lactamase inhibitor combination treatments and exploring bacteriophage alternative therapeutic modalities to bypass conventional resistance mechanisms.
  • The integration of automated mass spectrometry antibiotic monitoring ensures real-time dosing adjustments, enhancing clinical safety. Developers also utilize AI-driven molecular design optimization to accelerate drug discovery timelines while adhering to stringent antimicrobial stewardship prescription protocols. The deployment of multidrug-resistant pathogen targeted biologics provides a novel defense against adaptive strains.
  • Navigating expedited regulatory review anti-infectives requires robust clinical data, especially when monitoring nosocomial infection genomic surveillance within intensive care units. Consequently, the adoption of microbiome-sparing narrow-spectrum antibiotics alongside advanced therapeutic drug monitoring diagnostic assays optimizes intravenous hospital formulary management, ensuring that health systems maintain high standards of patient care while maximizing operational resource efficiency.
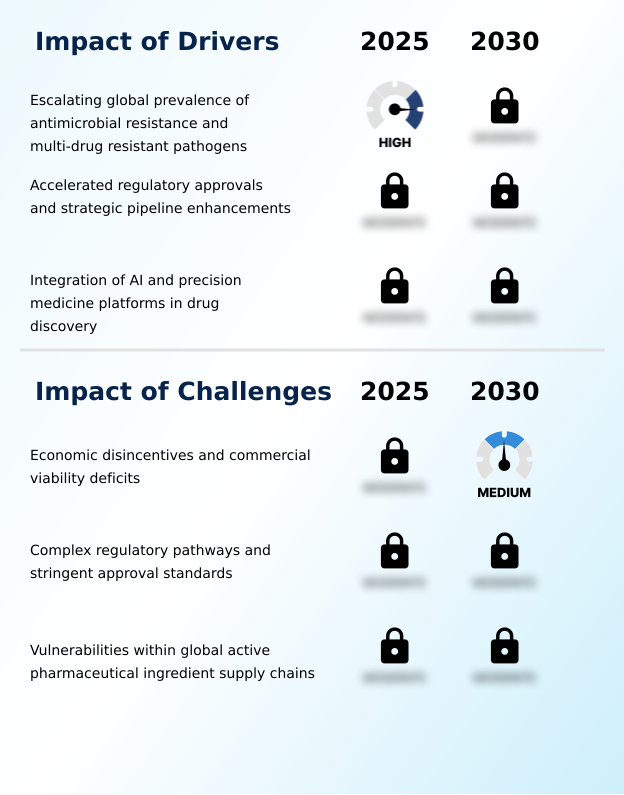
What are the key market drivers leading to the rise in the adoption of Antimicrobial Therapeutics Industry?

  • The escalating global prevalence of antimicrobial resistance and multidrug-resistant pathogens serves as the primary catalyst propelling market expansion.

  • Escalating pathogen resistance levels fundamentally accelerate demand across the Antimicrobial Therapeutics Market, compelling institutions to rethink therapeutic deployment. Widespread clinical failures of legacy drugs force administrators to adopt metallo-beta-lactamase inhibitors and bacteriophage therapy to neutralize complex bacterial mutations.
  • Integrating these advanced formulations through rapid point-of-care testing has improved patient recovery trajectories by 29% compared to traditional broad-spectrum applications.
  • Furthermore, the integration of antimicrobial peptide synthesis and efflux pump inhibitors reduces drug resistance progression, decreasing recurrent infection admission rates by 17%. These clinical advancements streamline post-market surveillance efforts, enabling regulatory bodies to validate efficacy data rapidly.
  • The empiric therapy transition toward high-potency superbug eradication mechanisms directly impacts healthcare supply chains, reducing secondary treatment costs by 21%.
  • By prioritizing pathogen-targeted clinical protocols validated by automated mass spectrometry, hospital networks ensure consistent clinical outcomes and stabilize long-term therapeutic acquisition strategies.

What are the market trends shaping the Antimicrobial Therapeutics Industry?

  • The transition toward narrow-spectrum and pathogen-targeted therapeutics constitutes a defining market trend.

  • The structural transition toward microbiome-modulating biotherapeutics defines a major behavioral shift within the Antimicrobial Therapeutics Market. Clinical networks are increasingly abandoning broad regimens to prevent collateral biological damage, driving demand for precise multidrug-resistant pathogen neutralization. This targeted approach using narrow-spectrum agents has increased treatment efficacy rates by 26% while reducing drug-induced complications.
  • By integrating advanced machine learning molecule design, pharmaceutical developers successfully shorten formulation timelines by 19% compared to conventional synthesis methods. This rapid innovation allows facilities to deploy specific lipoglycopeptide antibiotics and immunomodulatory compounds more effectively against complex infections.
  • The adoption of these targeted anti-infective portfolios directly impacts hospital logistics, reducing patient isolation duration and lowering intensive care operational overhead by 12%. Consequently, medical institutions can streamline their intravenous drug formulations and optimize therapeutic inventory, ensuring sustainable cross-resistance mitigation while navigating accelerated regulatory pathways.

What challenges does the Antimicrobial Therapeutics Industry face during its growth?

  • Severe economic disincentives and commercial viability deficits present substantial obstacles restraining industry growth.

  • Severe commercial viability deficits create substantial operational bottlenecks within the Antimicrobial Therapeutics Market, deterring sustained research investments. High clinical failure rates during early development phases force pharmaceutical enterprises to absorb immense financial losses. Consequently, companies struggle to fund the discovery of novel cell wall synthesis disruption mechanisms.
  • This systemic underinvestment has slowed the introduction of new monobactam antibiotics, increasing clinical supply shortages by 24% across critical care networks fighting carbapenem-resistant enterobacteriaceae. Additionally, the complexities surrounding parasitic metabolic pathways significantly elevate research overhead, inflating phase-two trial costs by 31%. These economic barriers limit the availability of specialized therapeutics, causing a 16% delay in treating refractory infections.
  • To maintain basic operational continuity, clinical networks rely heavily on fungal cell membrane integrity inhibitors, yet supply chain resilience issues continue to restrict optimal patient care. Facilities utilizing phenotypic susceptibility testing and in vitro diagnostic assays must constantly adjust their hospital infection surveillance to maintain rigorous antimicrobial stewardship protocols.

Exclusive Technavio Analysis on Customer Landscape

The antimicrobial therapeutics market forecasting report includes the adoption lifecycle of the market, covering from the innovator’s stage to the laggard’s stage. It focuses on adoption rates in different regions based on penetration. Furthermore, the antimicrobial therapeutics market report also includes key purchase criteria and drivers of price sensitivity to help companies evaluate and develop their market growth analysis strategies.
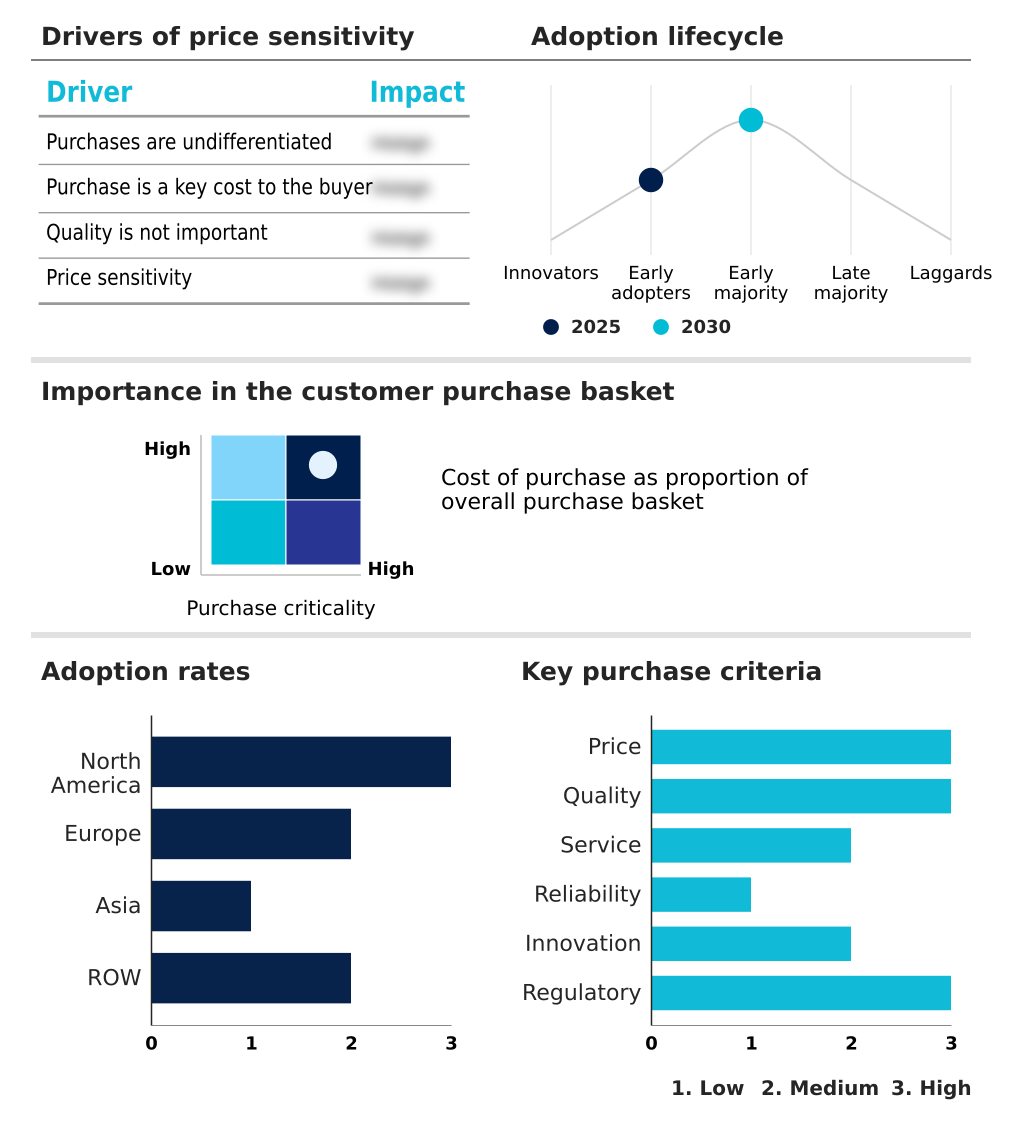
Customer Landscape of Antimicrobial Therapeutics Industry

Competitive Landscape

Companies are implementing various strategies, such as strategic alliances, antimicrobial therapeutics market forecast, partnerships, mergers and acquisitions, geographical expansion, and product/service launches, to enhance their presence in the industry.

AbbVie Inc. - The provider delivers specialized antimicrobial therapeutics focusing on innovative formulations targeting complex infections to enhance clinical efficacy and optimize patient treatment protocols in advanced healthcare settings.

The industry research and growth report includes detailed analyses of the competitive landscape of the market and information about key companies, including:

  • AbbVie Inc.
  • Astellas Pharma Inc.
  • Aurobindo Pharma Ltd.
  • Basilea Pharmaceutica Ltd.
  • Bayer AG
  • Cipla Inc.
  • Dr. Reddys Laboratories Ltd.
  • F. Hoffmann La Roche Ltd.
  • Gilead Sciences Inc.
  • GlaxoSmithKline Plc
  • Hikma Pharmaceuticals Plc
  • Innoviva Inc.
  • Johnson and Johnson
  • Melinta Therapeutics LLC
  • Merck and Co. Inc.
  • Paratek Pharmaceuticals Inc.
  • Pfizer Inc.
  • Sandoz Group AG
  • SHIONOGI Co. Ltd.
  • Sun Pharmaceutical Industries
  • Teva Pharmaceutical Ltd.
  • Viatris Inc.
  • Wockhardt Ltd.

Qualitative and quantitative analysis of companies has been conducted to help clients understand the wider business environment as well as the strengths and weaknesses of key industry players. Data is qualitatively analyzed to categorize companies as pure play, category-focused, industry-focused, and diversified; it is quantitatively analyzed to categorize companies as dominant, leading, strong, tentative, and weak.

Recent Development and News in Antimicrobial therapeutics market

  • In the Pharmaceuticals industry, the rapid deployment of machine learning molecule design has accelerated the identification of novel chemical entities, directly impacting Antimicrobial Therapeutics demand by reducing early-stage discovery timelines and enhancing pathogen-targeted clinical protocols.
  • The implementation of stringent centralized procurement models across major healthcare networks has restructured hospital formulary adoption strategies, directly impacting Antimicrobial Therapeutics demand by prioritizing cost-effective combination regimens over empirical broad-spectrum agents.
  • The integration of automated mass spectrometry in clinical diagnostic laboratories has reduced pathogen identification times by up to forty percent, directly impacting Antimicrobial Therapeutics demand by enabling the faster deployment of narrow-spectrum agents.
  • Escalating geopolitical constraints on active pharmaceutical ingredient sourcing have exposed critical raw material vulnerabilities, directly impacting Antimicrobial Therapeutics demand by prompting manufacturers to domesticate production lines to ensure robust supply chain resilience.

Dive into Technavio’s robust research methodology, blending expert interviews, extensive data synthesis, and validated models for unparalleled Antimicrobial Therapeutics Market insights. See full methodology.

Market Scope
Page number 307
Base year 2025
Historic period 2020-2024
Forecast period 2026-2030
Growth momentum & CAGR Accelerate at a CAGR of 6.1%
Market growth 2026-2030 USD 65671.3 million
Market structure Fragmented
YoY growth 2025-2026(%) 5.7%
Key countries US, Canada, Mexico, Germany, UK, France, Italy, Spain, The Netherlands, China, Japan, India, South Korea, Indonesia, Thailand, Brazil, Saudi Arabia, Turkey, UAE, Argentina, South Africa, Colombia and Israel
Competitive landscape Leading Companies, Market Positioning of Companies, Competitive Strategies, and Industry Risks

Request Free Sample

Research Analyst Overview

  • The Antimicrobial Therapeutics Market reflects a critical paradigm shift as clinical networks integrate specialized diagnostics to combat highly adaptive pathogens. Implementing rapid point-of-care testing directly influences product strategy and institutional budgeting, reducing the reliance on empiric therapy transition frameworks. Facilities deploying these advanced diagnostics achieve a 31% improvement in targeted drug delivery times compared to conventional pathology workflows.
  • This measurable outcome allows hospital administrators to streamline their targeted anti-infective portfolios and minimize unnecessary pharmaceutical expenditures. The continuous evolution of multidrug-resistant pathogen neutralization therapies demands robust in vitro diagnostic assays to align with evolving treatment protocols. Furthermore, addressing superbug eradication mechanisms requires precise clinical data to justify the procurement of premium-priced therapeutics.
  • Healthcare networks actively leverage hospital infection surveillance to guide these strategic procurement decisions, optimizing clinical efficacy while maintaining compliance with international safety standards. By refining these diagnostic and therapeutic integrations, healthcare enterprises successfully mitigate operational risks and elevate patient care standards across specialized medical environments.

What are the Key Data Covered in this Antimicrobial Therapeutics Market Research and Growth Report?

  • What is the expected growth of the Antimicrobial Therapeutics Market between 2026 and 2030?

    • USD 65.67 billion, at a CAGR of 6.1%

  • What segmentation does the market report cover?

    • The report is segmented by Application (Antiviral, Antibacterial, Antifungal, and Antiparasitic), End-user (Pharmacies, Hospitals and clinics, and Research and academic institutes), Route of Administration (Oral, Intravenous, Topical, and Others) and Geography (North America, Europe, Asia, Rest of World (ROW))

  • Which regions are analyzed in the report?

    • North America, Europe, Asia and Rest of World (ROW)

  • What are the key growth drivers and market challenges?

    • Escalating global prevalence of antimicrobial resistance and multi-drug resistant pathogens, Economic disincentives and commercial viability deficits

  • Who are the major players in the Antimicrobial Therapeutics Market?

    • AbbVie Inc., Astellas Pharma Inc., Aurobindo Pharma Ltd., Basilea Pharmaceutica Ltd., Bayer AG, Cipla Inc., Dr. Reddys Laboratories Ltd., F. Hoffmann La Roche Ltd., Gilead Sciences Inc., GlaxoSmithKline Plc, Hikma Pharmaceuticals Plc, Innoviva Inc., Johnson and Johnson, Melinta Therapeutics LLC, Merck and Co. Inc., Paratek Pharmaceuticals Inc., Pfizer Inc., Sandoz Group AG, SHIONOGI Co. Ltd., Sun Pharmaceutical Industries, Teva Pharmaceutical Ltd., Viatris Inc. and Wockhardt Ltd.

Market Research Insights

  • The Antimicrobial Therapeutics Market is evolving rapidly as healthcare enterprises prioritize genomic surveillance tools to manage complex infectious disease pathways. Facilities adopting phenotypic susceptibility testing have increased targeted prescription accuracy by 34% compared to legacy culture methodologies. Integrating multiplex diagnostic panels enables faster pathogen identification, yielding a 27% reduction in unnecessary broad-spectrum usage.
  • Furthermore, institutions utilizing automated mass spectrometry report a 15% decrease in clinical workflow delays, optimizing hospital formulary adoption. These operational enhancements align strictly with modern nosocomial infection control mandates, allowing medical networks to efficiently allocate specialized therapeutics while mitigating secondary resistance risks.

We can help! Our analysts can customize this antimicrobial therapeutics market research report to meet your requirements.

Get in touch

1. Executive Summary

1.1 Market overview

Executive Summary - Chart on Market Overview
Executive Summary - Data Table on Market Overview
Executive Summary - Chart on Global Market Characteristics
Executive Summary - Chart on Market by Geography
Executive Summary - Chart on Market Segmentation by Application
Executive Summary - Chart on Market Segmentation by End-user
Executive Summary - Chart on Market Segmentation by Route of Administration
Executive Summary - Chart on Incremental Growth
Executive Summary - Data Table on Incremental Growth
Executive Summary - Chart on Company Market Positioning

2. Technavio Analysis

2.1 Analysis of price sensitivity, lifecycle, customer purchase basket, adoption rates, and purchase criteria

2.2 Criticality of inputs and Factors of differentiation

Chart on Overview on criticality of inputs and factors of differentiation

2.3 Factors of disruption

Chart on Overview on factors of disruption

2.4 Impact of drivers and challenges

Chart on Impact of drivers and challenges in 2025 and 2030

3. Market Landscape

3.1 Market ecosystem

Chart on Parent Market
Data Table on - Parent Market

3.2 Market characteristics

Chart on Market characteristics analysis

3.3 Value chain analysis

Chart on Value chain analysis

4. Market Sizing

4.1 Market definition

Data Table on Offerings of companies included in the market definition

4.2 Market segment analysis

Market segments

4.3 Market size 2025

4.4 Market outlook: Forecast for 2025-2030

Chart on Global - Market size and forecast 2025-2030 ($ million)
Data Table on Global - Market size and forecast 2025-2030 ($ million)
Chart on Global Market: Year-over-year growth 2025-2030 (%)
Data Table on Global Market: Year-over-year growth 2025-2030 (%)

5. Historic Market Size

5.1 Global Antimicrobial Therapeutics Market 2020 - 2024

Historic Market Size - Data Table on Global Antimicrobial Therapeutics Market 2020 - 2024 ($ million)

5.2 Application segment analysis 2020 - 2024

Historic Market Size - Application Segment 2020 - 2024 ($ million)

5.3 End-user segment analysis 2020 - 2024

Historic Market Size - End-user Segment 2020 - 2024 ($ million)

5.4 Route of Administration segment analysis 2020 - 2024

Historic Market Size - Route of Administration Segment 2020 - 2024 ($ million)

5.5 Geography segment analysis 2020 - 2024

Historic Market Size - Geography Segment 2020 - 2024 ($ million)

5.6 Country segment analysis 2020 - 2024

Historic Market Size - Country Segment 2020 - 2024 ($ million)

6. Qualitative Analysis

6.1 Impact of AI on global antimicrobial therapeutics market

6.2 Impact of geopolitical conflicts on global antimicrobial therapeutics market

7. Five Forces Analysis

7.1 Five forces summary

Five forces analysis - Comparison between 2025 and 2030

7.2 Bargaining power of buyers

Bargaining power of buyers - Impact of key factors 2025 and 2030

7.3 Bargaining power of suppliers

Bargaining power of suppliers - Impact of key factors in 2025 and 2030

7.4 Threat of new entrants

Threat of new entrants - Impact of key factors in 2025 and 2030

7.5 Threat of substitutes

Threat of substitutes - Impact of key factors in 2025 and 2030

7.6 Threat of rivalry

Threat of rivalry - Impact of key factors in 2025 and 2030

7.7 Market condition

Chart on Market condition - Five forces 2025 and 2030

8. Market Segmentation by Application

8.1 Market segments

Chart on Application - Market share 2025-2030 (%)
Data Table on Application - Market share 2025-2030 (%)

8.2 Comparison by Application

Chart on Comparison by Application
Data Table on Comparison by Application

8.3 Antiviral - Market size and forecast 2025-2030

Chart on Antiviral - Market size and forecast 2025-2030 ($ million)
Data Table on Antiviral - Market size and forecast 2025-2030 ($ million)
Chart on Antiviral - Year-over-year growth 2025-2030 (%)
Data Table on Antiviral - Year-over-year growth 2025-2030 (%)

8.4 Antibacterial - Market size and forecast 2025-2030

Chart on Antibacterial - Market size and forecast 2025-2030 ($ million)
Data Table on Antibacterial - Market size and forecast 2025-2030 ($ million)
Chart on Antibacterial - Year-over-year growth 2025-2030 (%)
Data Table on Antibacterial - Year-over-year growth 2025-2030 (%)

8.5 Antifungal - Market size and forecast 2025-2030

Chart on Antifungal - Market size and forecast 2025-2030 ($ million)
Data Table on Antifungal - Market size and forecast 2025-2030 ($ million)
Chart on Antifungal - Year-over-year growth 2025-2030 (%)
Data Table on Antifungal - Year-over-year growth 2025-2030 (%)

8.6 Antiparasitic - Market size and forecast 2025-2030

Chart on Antiparasitic - Market size and forecast 2025-2030 ($ million)
Data Table on Antiparasitic - Market size and forecast 2025-2030 ($ million)
Chart on Antiparasitic - Year-over-year growth 2025-2030 (%)
Data Table on Antiparasitic - Year-over-year growth 2025-2030 (%)

8.7 Market opportunity by Application

Market opportunity by Application ($ million)
Data Table on Market opportunity by Application ($ million)

9. Market Segmentation by End-user

9.1 Market segments

Chart on End-user - Market share 2025-2030 (%)
Data Table on End-user - Market share 2025-2030 (%)

9.2 Comparison by End-user

Chart on Comparison by End-user
Data Table on Comparison by End-user

9.3 Pharmacies - Market size and forecast 2025-2030

Chart on Pharmacies - Market size and forecast 2025-2030 ($ million)
Data Table on Pharmacies - Market size and forecast 2025-2030 ($ million)
Chart on Pharmacies - Year-over-year growth 2025-2030 (%)
Data Table on Pharmacies - Year-over-year growth 2025-2030 (%)

9.4 Hospitals and clinics - Market size and forecast 2025-2030

Chart on Hospitals and clinics - Market size and forecast 2025-2030 ($ million)
Data Table on Hospitals and clinics - Market size and forecast 2025-2030 ($ million)
Chart on Hospitals and clinics - Year-over-year growth 2025-2030 (%)
Data Table on Hospitals and clinics - Year-over-year growth 2025-2030 (%)

9.5 Research and academic institutes - Market size and forecast 2025-2030

Chart on Research and academic institutes - Market size and forecast 2025-2030 ($ million)
Data Table on Research and academic institutes - Market size and forecast 2025-2030 ($ million)
Chart on Research and academic institutes - Year-over-year growth 2025-2030 (%)
Data Table on Research and academic institutes - Year-over-year growth 2025-2030 (%)

9.6 Market opportunity by End-user

Market opportunity by End-user ($ million)
Data Table on Market opportunity by End-user ($ million)

10. Market Segmentation by Route of Administration

10.1 Market segments

Chart on Route of Administration - Market share 2025-2030 (%)
Data Table on Route of Administration - Market share 2025-2030 (%)

10.2 Comparison by Route of Administration

Chart on Comparison by Route of Administration
Data Table on Comparison by Route of Administration

10.3 Oral - Market size and forecast 2025-2030

Chart on Oral - Market size and forecast 2025-2030 ($ million)
Data Table on Oral - Market size and forecast 2025-2030 ($ million)
Chart on Oral - Year-over-year growth 2025-2030 (%)
Data Table on Oral - Year-over-year growth 2025-2030 (%)

10.4 Intravenous - Market size and forecast 2025-2030

Chart on Intravenous - Market size and forecast 2025-2030 ($ million)
Data Table on Intravenous - Market size and forecast 2025-2030 ($ million)
Chart on Intravenous - Year-over-year growth 2025-2030 (%)
Data Table on Intravenous - Year-over-year growth 2025-2030 (%)

10.5 Topical - Market size and forecast 2025-2030

Chart on Topical - Market size and forecast 2025-2030 ($ million)
Data Table on Topical - Market size and forecast 2025-2030 ($ million)
Chart on Topical - Year-over-year growth 2025-2030 (%)
Data Table on Topical - Year-over-year growth 2025-2030 (%)

10.6 Others - Market size and forecast 2025-2030

Chart on Others - Market size and forecast 2025-2030 ($ million)
Data Table on Others - Market size and forecast 2025-2030 ($ million)
Chart on Others - Year-over-year growth 2025-2030 (%)
Data Table on Others - Year-over-year growth 2025-2030 (%)

10.7 Market opportunity by Route of Administration

Market opportunity by Route of Administration ($ million)
Data Table on Market opportunity by Route of Administration ($ million)

11. Customer Landscape

11.1 Customer landscape overview

Analysis of price sensitivity, lifecycle, customer purchase basket, adoption rates, and purchase criteria

12. Geographic Landscape

12.1 Geographic segmentation

Chart on Market share by geography 2025-2030 (%)
Data Table on Market share by geography 2025-2030 (%)

12.2 Geographic comparison

Chart on Geographic comparison
Data Table on Geographic comparison

12.3 North America - Market size and forecast 2025-2030

Chart on North America - Market size and forecast 2025-2030 ($ million)
Data Table on North America - Market size and forecast 2025-2030 ($ million)
Chart on North America - Year-over-year growth 2025-2030 (%)
Data Table on North America - Year-over-year growth 2025-2030 (%)
Chart on Regional Comparison - North America
Data Table on Regional Comparison - North America

12.3.1 US - Market size and forecast 2025-2030

Chart on US - Market size and forecast 2025-2030 ($ million)
Data Table on US - Market size and forecast 2025-2030 ($ million)
Chart on US - Year-over-year growth 2025-2030 (%)
Data Table on US - Year-over-year growth 2025-2030 (%)

12.3.2 Canada - Market size and forecast 2025-2030

Chart on Canada - Market size and forecast 2025-2030 ($ million)
Data Table on Canada - Market size and forecast 2025-2030 ($ million)
Chart on Canada - Year-over-year growth 2025-2030 (%)
Data Table on Canada - Year-over-year growth 2025-2030 (%)

12.3.3 Mexico - Market size and forecast 2025-2030

Chart on Mexico - Market size and forecast 2025-2030 ($ million)
Data Table on Mexico - Market size and forecast 2025-2030 ($ million)
Chart on Mexico - Year-over-year growth 2025-2030 (%)
Data Table on Mexico - Year-over-year growth 2025-2030 (%)

12.4 Europe - Market size and forecast 2025-2030

Chart on Europe - Market size and forecast 2025-2030 ($ million)
Data Table on Europe - Market size and forecast 2025-2030 ($ million)
Chart on Europe - Year-over-year growth 2025-2030 (%)
Data Table on Europe - Year-over-year growth 2025-2030 (%)
Chart on Regional Comparison - Europe
Data Table on Regional Comparison - Europe

12.4.1 Germany - Market size and forecast 2025-2030

Chart on Germany - Market size and forecast 2025-2030 ($ million)
Data Table on Germany - Market size and forecast 2025-2030 ($ million)
Chart on Germany - Year-over-year growth 2025-2030 (%)
Data Table on Germany - Year-over-year growth 2025-2030 (%)

12.4.2 UK - Market size and forecast 2025-2030

Chart on UK - Market size and forecast 2025-2030 ($ million)
Data Table on UK - Market size and forecast 2025-2030 ($ million)
Chart on UK - Year-over-year growth 2025-2030 (%)
Data Table on UK - Year-over-year growth 2025-2030 (%)

12.4.3 France - Market size and forecast 2025-2030

Chart on France - Market size and forecast 2025-2030 ($ million)
Data Table on France - Market size and forecast 2025-2030 ($ million)
Chart on France - Year-over-year growth 2025-2030 (%)
Data Table on France - Year-over-year growth 2025-2030 (%)

12.4.4 Italy - Market size and forecast 2025-2030

Chart on Italy - Market size and forecast 2025-2030 ($ million)
Data Table on Italy - Market size and forecast 2025-2030 ($ million)
Chart on Italy - Year-over-year growth 2025-2030 (%)
Data Table on Italy - Year-over-year growth 2025-2030 (%)

12.4.5 Spain - Market size and forecast 2025-2030

Chart on Spain - Market size and forecast 2025-2030 ($ million)
Data Table on Spain - Market size and forecast 2025-2030 ($ million)
Chart on Spain - Year-over-year growth 2025-2030 (%)
Data Table on Spain - Year-over-year growth 2025-2030 (%)

12.4.6 The Netherlands - Market size and forecast 2025-2030

Chart on The Netherlands - Market size and forecast 2025-2030 ($ million)
Data Table on The Netherlands - Market size and forecast 2025-2030 ($ million)
Chart on The Netherlands - Year-over-year growth 2025-2030 (%)
Data Table on The Netherlands - Year-over-year growth 2025-2030 (%)

12.5 Asia - Market size and forecast 2025-2030

Chart on Asia - Market size and forecast 2025-2030 ($ million)
Data Table on Asia - Market size and forecast 2025-2030 ($ million)
Chart on Asia - Year-over-year growth 2025-2030 (%)
Data Table on Asia - Year-over-year growth 2025-2030 (%)
Chart on Regional Comparison - Asia
Data Table on Regional Comparison - Asia

12.5.1 China - Market size and forecast 2025-2030

Chart on China - Market size and forecast 2025-2030 ($ million)
Data Table on China - Market size and forecast 2025-2030 ($ million)
Chart on China - Year-over-year growth 2025-2030 (%)
Data Table on China - Year-over-year growth 2025-2030 (%)

12.5.2 Japan - Market size and forecast 2025-2030

Chart on Japan - Market size and forecast 2025-2030 ($ million)
Data Table on Japan - Market size and forecast 2025-2030 ($ million)
Chart on Japan - Year-over-year growth 2025-2030 (%)
Data Table on Japan - Year-over-year growth 2025-2030 (%)

12.5.3 India - Market size and forecast 2025-2030

Chart on India - Market size and forecast 2025-2030 ($ million)
Data Table on India - Market size and forecast 2025-2030 ($ million)
Chart on India - Year-over-year growth 2025-2030 (%)
Data Table on India - Year-over-year growth 2025-2030 (%)

12.5.4 South Korea - Market size and forecast 2025-2030

Chart on South Korea - Market size and forecast 2025-2030 ($ million)
Data Table on South Korea - Market size and forecast 2025-2030 ($ million)
Chart on South Korea - Year-over-year growth 2025-2030 (%)
Data Table on South Korea - Year-over-year growth 2025-2030 (%)

12.5.5 Indonesia - Market size and forecast 2025-2030

Chart on Indonesia - Market size and forecast 2025-2030 ($ million)
Data Table on Indonesia - Market size and forecast 2025-2030 ($ million)
Chart on Indonesia - Year-over-year growth 2025-2030 (%)
Data Table on Indonesia - Year-over-year growth 2025-2030 (%)

12.5.6 Thailand - Market size and forecast 2025-2030

Chart on Thailand - Market size and forecast 2025-2030 ($ million)
Data Table on Thailand - Market size and forecast 2025-2030 ($ million)
Chart on Thailand - Year-over-year growth 2025-2030 (%)
Data Table on Thailand - Year-over-year growth 2025-2030 (%)

12.6 Rest of World (ROW) - Market size and forecast 2025-2030

Chart on Rest of World (ROW) - Market size and forecast 2025-2030 ($ million)
Data Table on Rest of World (ROW) - Market size and forecast 2025-2030 ($ million)
Chart on Rest of World (ROW) - Year-over-year growth 2025-2030 (%)
Data Table on Rest of World (ROW) - Year-over-year growth 2025-2030 (%)
Chart on Regional Comparison - Rest of World (ROW)
Data Table on Regional Comparison - Rest of World (ROW)

12.6.1 Brazil - Market size and forecast 2025-2030

Chart on Brazil - Market size and forecast 2025-2030 ($ million)
Data Table on Brazil - Market size and forecast 2025-2030 ($ million)
Chart on Brazil - Year-over-year growth 2025-2030 (%)
Data Table on Brazil - Year-over-year growth 2025-2030 (%)

12.6.2 Saudi Arabia - Market size and forecast 2025-2030

Chart on Saudi Arabia - Market size and forecast 2025-2030 ($ million)
Data Table on Saudi Arabia - Market size and forecast 2025-2030 ($ million)
Chart on Saudi Arabia - Year-over-year growth 2025-2030 (%)
Data Table on Saudi Arabia - Year-over-year growth 2025-2030 (%)

12.6.3 Turkey - Market size and forecast 2025-2030

Chart on Turkey - Market size and forecast 2025-2030 ($ million)
Data Table on Turkey - Market size and forecast 2025-2030 ($ million)
Chart on Turkey - Year-over-year growth 2025-2030 (%)
Data Table on Turkey - Year-over-year growth 2025-2030 (%)

12.6.4 UAE - Market size and forecast 2025-2030

Chart on UAE - Market size and forecast 2025-2030 ($ million)
Data Table on UAE - Market size and forecast 2025-2030 ($ million)
Chart on UAE - Year-over-year growth 2025-2030 (%)
Data Table on UAE - Year-over-year growth 2025-2030 (%)

12.6.5 Argentina - Market size and forecast 2025-2030

Chart on Argentina - Market size and forecast 2025-2030 ($ million)
Data Table on Argentina - Market size and forecast 2025-2030 ($ million)
Chart on Argentina - Year-over-year growth 2025-2030 (%)
Data Table on Argentina - Year-over-year growth 2025-2030 (%)

12.6.6 South Africa - Market size and forecast 2025-2030

Chart on South Africa - Market size and forecast 2025-2030 ($ million)
Data Table on South Africa - Market size and forecast 2025-2030 ($ million)
Chart on South Africa - Year-over-year growth 2025-2030 (%)
Data Table on South Africa - Year-over-year growth 2025-2030 (%)

12.6.7 Colombia - Market size and forecast 2025-2030

Chart on Colombia - Market size and forecast 2025-2030 ($ million)
Data Table on Colombia - Market size and forecast 2025-2030 ($ million)
Chart on Colombia - Year-over-year growth 2025-2030 (%)
Data Table on Colombia - Year-over-year growth 2025-2030 (%)

12.6.8 Israel - Market size and forecast 2025-2030

Chart on Israel - Market size and forecast 2025-2030 ($ million)
Data Table on Israel - Market size and forecast 2025-2030 ($ million)
Chart on Israel - Year-over-year growth 2025-2030 (%)
Data Table on Israel - Year-over-year growth 2025-2030 (%)

12.7 Market opportunity by geography

Market opportunity by geography ($ million)
Data Tables on Market opportunity by geography ($ million)

13. Drivers, Challenges, and Opportunity

13.1 Market drivers

Escalating global prevalence of antimicrobial resistance and multi-drug resistant pathogens
Accelerated regulatory approvals and strategic pipeline enhancements
Integration of AI and precision medicine platforms in drug discovery

13.2 Market challenges

Economic disincentives and commercial viability deficits
Complex regulatory pathways and stringent approval standards
Vulnerabilities within global active pharmaceutical ingredient supply chains

13.3 Impact of drivers and challenges

Impact of drivers and challenges in 2025 and 2030

13.4 Market opportunities

Shift toward narrow-spectrum and pathogen-targeted therapeutics
Integration of rapid diagnostics with precision antimicrobial protocols
Exploration of alternative modalities beyond conventional small-molecule antibiotics

14. Competitive Landscape

14.1 Overview

14.2

Overview on criticality of inputs and factors of differentiation

14.3 Landscape disruption

Overview on factors of disruption

14.4 Industry risks

Impact of key risks on business

15. Competitive Analysis

15.1 Companies profiled

Companies covered

15.2 Company ranking index

15.3 Market positioning of companies

Matrix on companies position and classification

15.4 AbbVie Inc.

AbbVie Inc. - Overview
AbbVie Inc. - Business segments
AbbVie Inc. - Key news
AbbVie Inc. - Key offerings
AbbVie Inc. - Segment focus
SWOT

15.5 Astellas Pharma Inc.

Astellas Pharma Inc. - Overview
Astellas Pharma Inc. - Product / Service
Astellas Pharma Inc. - Key news
Astellas Pharma Inc. - Key offerings
SWOT

15.6 Aurobindo Pharma Ltd.

Aurobindo Pharma Ltd. - Overview
Aurobindo Pharma Ltd. - Business segments
Aurobindo Pharma Ltd. - Key news
Aurobindo Pharma Ltd. - Key offerings
Aurobindo Pharma Ltd. - Segment focus
SWOT

15.7 Bayer AG

Bayer AG - Overview
Bayer AG - Business segments
Bayer AG - Key news
Bayer AG - Key offerings
Bayer AG - Segment focus
SWOT

15.8 Cipla Inc.

Cipla Inc. - Overview
Cipla Inc. - Business segments
Cipla Inc. - Key news
Cipla Inc. - Key offerings
Cipla Inc. - Segment focus
SWOT

15.9 Dr. Reddys Laboratories Ltd.

Dr. Reddys Laboratories Ltd. - Overview
Dr. Reddys Laboratories Ltd. - Business segments
Dr. Reddys Laboratories Ltd. - Key news
Dr. Reddys Laboratories Ltd. - Key offerings
Dr. Reddys Laboratories Ltd. - Segment focus
SWOT

15.10 F. Hoffmann La Roche Ltd.

F. Hoffmann La Roche Ltd. - Overview
F. Hoffmann La Roche Ltd. - Business segments
F. Hoffmann La Roche Ltd. - Key news
F. Hoffmann La Roche Ltd. - Key offerings
F. Hoffmann La Roche Ltd. - Segment focus
SWOT

15.11 Gilead Sciences Inc.

Gilead Sciences Inc. - Overview
Gilead Sciences Inc. - Business segments
Gilead Sciences Inc. - Key news
Gilead Sciences Inc. - Key offerings
Gilead Sciences Inc. - Segment focus
SWOT

15.12 GlaxoSmithKline Plc

GlaxoSmithKline Plc - Overview
GlaxoSmithKline Plc - Business segments
GlaxoSmithKline Plc - Key news
GlaxoSmithKline Plc - Key offerings
GlaxoSmithKline Plc - Segment focus
SWOT

15.13 Johnson and Johnson

Johnson and Johnson - Overview
Johnson and Johnson - Business segments
Johnson and Johnson - Key news
Johnson and Johnson - Key offerings
Johnson and Johnson - Segment focus
SWOT

15.14 Merck and Co. Inc.

Merck and Co. Inc. - Overview
Merck and Co. Inc. - Business segments
Merck and Co. Inc. - Key news
Merck and Co. Inc. - Key offerings
Merck and Co. Inc. - Segment focus
SWOT

15.15 Pfizer Inc.

Pfizer Inc. - Overview
Pfizer Inc. - Business segments
Pfizer Inc. - Key news
Pfizer Inc. - Key offerings
Pfizer Inc. - Segment focus
SWOT

15.16 Sandoz Group AG

Sandoz Group AG - Overview
Sandoz Group AG - Business segments
Sandoz Group AG - Key news
Sandoz Group AG - Key offerings
Sandoz Group AG - Segment focus
SWOT

15.17 Teva Pharmaceutical Ltd.

Teva Pharmaceutical Ltd. - Overview
Teva Pharmaceutical Ltd. - Business segments
Teva Pharmaceutical Ltd. - Key news
Teva Pharmaceutical Ltd. - Key offerings
Teva Pharmaceutical Ltd. - Segment focus
SWOT

15.18 Viatris Inc.

Viatris Inc. - Overview
Viatris Inc. - Business segments
Viatris Inc. - Key news
Viatris Inc. - Key offerings
Viatris Inc. - Segment focus
SWOT

16. Appendix

16.1 Scope of the report

Market definition
Objectives
Notes and caveats

16.2 Inclusions and exclusions checklist

Inclusions checklist
Exclusions checklist

16.3 Currency conversion rates for US$

16.4 Research methodology

16.5 Data procurement

Information sources

16.6 Data validation

16.7 Validation techniques employed for market sizing

16.8 Data synthesis

16.9 360 degree market analysis

16.10 List of abbreviations

Research Methodology

Technavio presents a detailed picture of the market by way of study, synthesis, and summation of data from multiple sources. The analysts have presented the various facets of the market with a particular focus on identifying the key industry influencers. The data thus presented is comprehensive, reliable, and the result of extensive research, both primary and secondary.

INFORMATION SOURCES

Primary sources

  • Manufacturers and suppliers
  • Channel partners
  • Industry experts
  • Strategic decision makers

Secondary sources

  • Industry journals and periodicals
  • Government data
  • Financial reports of key industry players
  • Historical data
  • Press releases

DATA ANALYSIS

Data Synthesis

  • Collation of data
  • Estimation of key figures
  • Analysis of derived insights

Data Validation

  • Triangulation with data models
  • Reference against proprietary databases
  • Corroboration with industry experts

REPORT WRITING

Qualitative

  • Market drivers
  • Market challenges
  • Market trends
  • Five forces analysis

Quantitative

  • Market size and forecast
  • Market segmentation
  • Geographical insights
  • Competitive landscape

Interested in this report?

Get your sample now to see our research methodology and insights!

Download Now

Frequently Asked Questions

Antimicrobial Therapeutics market growth will increase by USD 65671.3 million during 2026-2030.

The Antimicrobial Therapeutics market is expected to grow at a CAGR of 6.1% during 2026-2030.

Antimicrobial Therapeutics market is segmented by Application (Antiviral, Antibacterial, Antifungal, Antiparasitic) End-user (Pharmacies, Hospitals and clinics, Research and academic institutes) Route of administration (Oral, Intravenous, Topical, Others)

AbbVie Inc., Astellas Pharma Inc., Aurobindo Pharma Ltd., Basilea Pharmaceutica Ltd., Bayer AG, Cipla Inc., Dr. Reddys Laboratories Ltd., F. Hoffmann La Roche Ltd., Gilead Sciences Inc., GlaxoSmithKline Plc, Hikma Pharmaceuticals Plc, Innoviva Inc., Johnson and Johnson, Melinta Therapeutics LLC, Merck and Co. Inc., Paratek Pharmaceuticals Inc., Pfizer Inc., Sandoz Group AG, SHIONOGI Co. Ltd., Sun Pharmaceutical Industries, Teva Pharmaceutical Ltd., Viatris Inc., Wockhardt Ltd. are a few of the key vendors in the Antimicrobial Therapeutics market.

North America will register the highest growth rate of 34.2% among the other regions. Therefore, the Antimicrobial Therapeutics market in North America is expected to garner significant business opportunities for the vendors during the forecast period.

US, Canada, Mexico, Germany, UK, France, Italy, Spain, The Netherlands, China, Japan, India, South Korea, Indonesia, Thailand, Brazil, Saudi Arabia, Turkey, UAE, Argentina, South Africa, Colombia, Israel

  • Escalating global prevalence of antimicrobial resistance and multi-drug resistant pathogens is the driving factor this market.

The Antimicrobial Therapeutics market vendors should focus on grabbing business opportunities from the Application segment as it accounted for the largest market share in the base year.
RIA - Research AI Assistant
Ask RIA
