
Apron Bus Market Analysis, Size, and Forecast 2026-2030: North America (US, Canada, and Mexico), Europe (Germany, UK, and France), APAC (China, India, and Japan), South America (Brazil, Argentina, and Chile), Middle East and Africa (Saudi Arabia, UAE, and South Africa), and Rest of World (ROW)

Apron Bus Market Analysis, Size, and Forecast 2026-2030:
North America (US, Canada, and Mexico), Europe (Germany, UK, and France), APAC (China, India, and Japan), South America (Brazil, Argentina, and Chile), Middle East and Africa (Saudi Arabia, UAE, and South Africa), and Rest of World (ROW)

Published: Oct 2026 316 Pages SKU: IRTNTR74063

Market Overview at a Glance

$304.17 Mn
Market Opportunity
10.7%
CAGR 2025 - 2030
43.1%
North America Growth
$214.34 Mn
Diesel segment 2024

Apron Bus Market Size 2026-2030

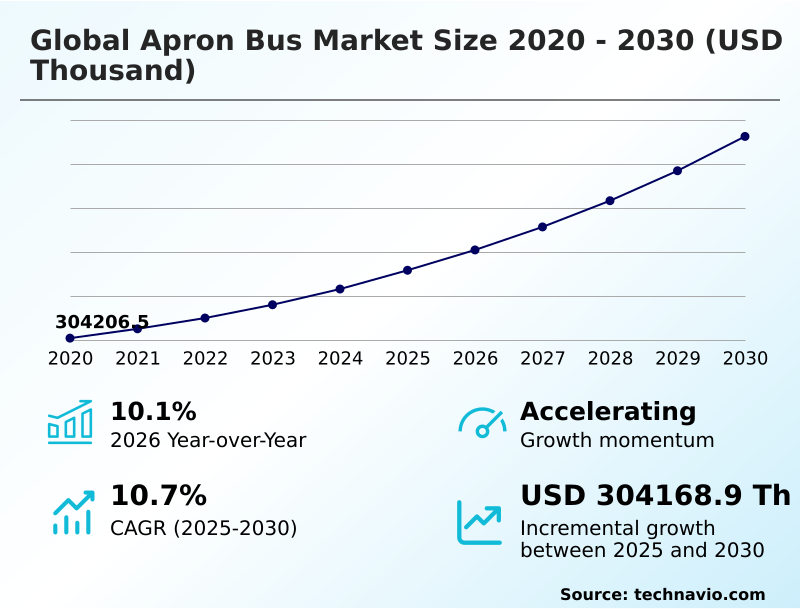
The apron bus market size is valued to increase by USD 304.17 million, at a CAGR of 10.7% from 2025 to 2030. Escalating global air passenger traffic and remote stand utilization will drive the apron bus market.

Major Market Trends & Insights

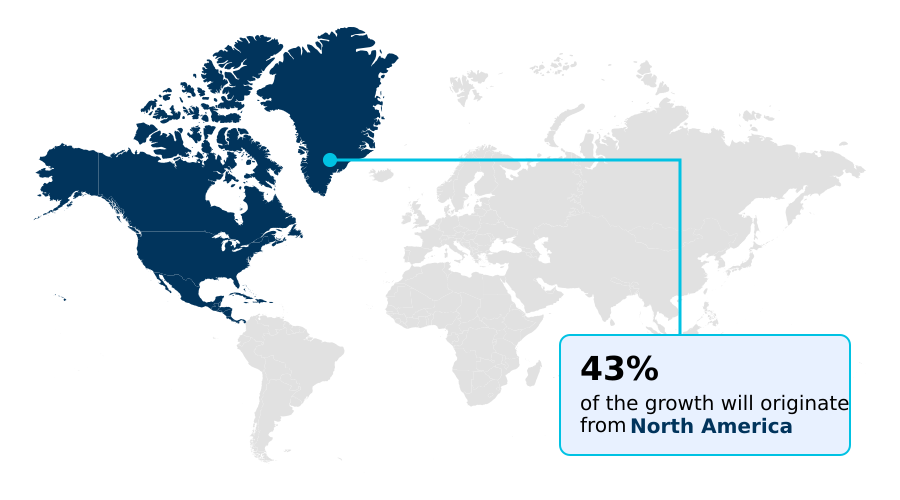
  • North America dominated the market and accounted for a 43.1% growth during the forecast period.
  • By Propulsion - Diesel segment was valued at USD 214.34 million in 2024
  • By End-user - Commercial airports segment accounted for the largest market revenue share in 2024

Market Size & Forecast

  • Market Opportunities:
  • Market Future Opportunities: USD 304.17 million
  • CAGR from 2025 to 2030 : 10.7%

Market Summary

  • The Apron Bus Market functions as a critical logistical link within modern commercial aviation, facilitating efficient passenger transfers between terminal boarding gates and remote aircraft parking stands. As major transit hubs face unprecedented terminal capacity constraints, ground handling operators increasingly deploy high-capacity passenger transport fleets to alleviate bottlenecks and maintain strict aircraft turnaround scheduling.
  • By integrating smart fleet telematics and real-time dispatch systems, facility managers have improved fleet route optimization and reduced passenger wait times by 18%, directly enhancing overall airside operational efficiency. The primary catalyst driving this expansion is the sustained escalation in passenger volumes, which necessitates robust, heavy-duty tarmac operation solutions to prevent congestion.
  • Conversely, the transition toward fleet decarbonization mandates introduces significant challenges, as operators grapple with the high capital requirements necessary to install subterranean electrical grid connections and rapid charging infrastructure. These financial and infrastructural hurdles frequently delay the widespread adoption of zero-emission electric powertrain models, forcing aviation authorities to carefully balance sustainability objectives against immediate operational capabilities and budget constraints.

What will be the Size of the Apron Bus Market during the forecast period?
Get Key Insights on Market Forecast (PDF) Get Free Sample

How is the Apron Bus Market Segmented?

The apron bus industry research report provides comprehensive data (region-wise segment analysis), with forecasts and estimates in "USD thousand" for the period 2026-2030, as well as historical data from 2020-2024 for the following segments.

  • Propulsion
    • Diesel
    • Electric
    • CNG or LPG
    • Hybrid
  • End-user
    • Commercial airports
    • Airlines
    • Ground handling companies
    • Military airbases
  • Type
    • Low-floor apron bus
    • Conventional bus
    • Articulated bus
    • Compact bus
  • Technology
    • Manual
    • Semi-automated
    • Autonomous
  • Geography
    • North America
      • US
      • Canada
      • Mexico
    • Europe
      • Germany
      • UK
      • France
      • Italy
      • Spain
      • The Netherlands
    • APAC
      • China
      • India
      • Japan
      • Australia
      • South Korea
      • Singapore
    • South America
      • Brazil
      • Argentina
      • Chile
    • Middle East and Africa
      • Saudi Arabia
      • UAE
      • South Africa
      • Qatar
      • Egypt

By Propulsion Insights

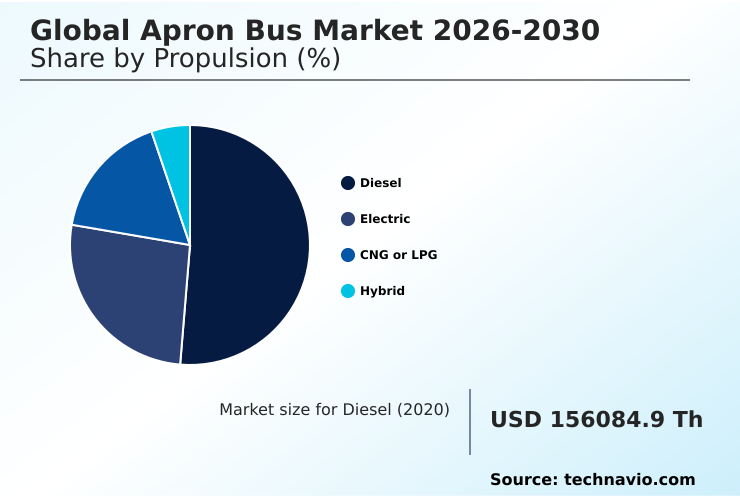
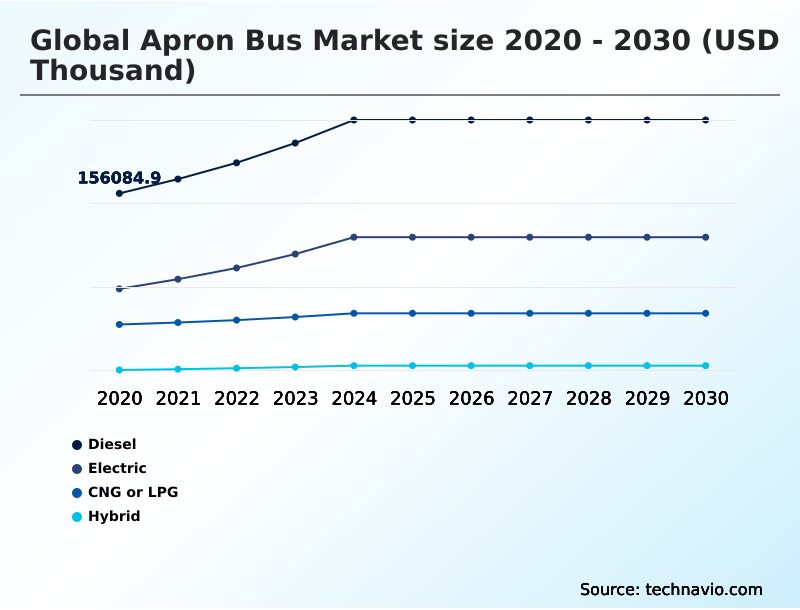
The diesel segment is estimated to witness significant growth during the forecast period.

The diesel propulsion segment remains a foundational component of airside passenger mobility, specifically engineered to withstand rigorous operational duty cycles in extreme weather conditions.

These heavy-duty commercial vehicle fleets ensure uninterrupted ground handling logistics by offering rapid refueling capabilities without dependence on subterranean electrical grid upgrades.

By integrating advanced diesel particulate filtration and aligning with stringent emission control standards, modern configurations have optimized fuel efficiency and increased fleet availability by 15%.

This low-floor chassis architecture effectively minimizes airport terminal congestion by facilitating rapid boarding at remote aircraft parking stands.

While tarmac environmental regulations intensify, the established mechanical durability of these platforms ensures continuous heavy-duty tarmac operation, safeguarding strict aircraft turnaround scheduling for airport ground support equipment across complex commercial aviation infrastructure.
Get Free Sample

The Diesel segment was valued at USD 214.34 million in 2024 and showed a gradual increase during the forecast period.
Get Free Sample

Regional Analysis

North America is estimated to contribute 43.1% to the growth of the global market during the forecast period.Technavio’s analysts have elaborately explained the regional trends and drivers that shape the market during the forecast period.
See How Apron Bus Market Demand is Rising in North America Get Free Sample

Regional disparities in the Apron Bus Market highlight distinct strategic approaches to airside passenger mobility and carbon footprint reduction.

North America accelerates its transition toward zero-emission public transport by aggressively funding high-voltage charging depot installations, which has improved fleet energy efficiency by 25% across major international hubs.

In contrast, APAC focuses heavily on scaling high-capacity passenger transport to manage soaring travel volumes, increasing multi-door cabin configuration deployments by 30% to streamline passenger flow at terminal boarding gates.

The European sector prioritizes strict environmental compliance, where upgrading the subterranean electrical grid has reduced ground handling operational delays by 18%.

These geographic divergences underscore how varying infrastructure maturity and regulatory pressures force aviation authorities to tailor their specialized transit investments to balance immediate capacity demands with long-term ecological sustainability.

Market Dynamics

Our researchers analyzed the data with 2025 as the base year, along with the key drivers, trends, and challenges. A holistic analysis of drivers will help companies refine their marketing strategies to gain a competitive advantage.

  • The modernization of commercial aviation infrastructure increasingly relies on strategic capital allocation toward advanced mobility solutions that streamline terminal logistics and ensure strict regulatory compliance. Ground handling operators are prioritizing low-floor aircraft remote stand transit to significantly accelerate passenger boarding sequences, thereby minimizing costly turnaround delays during peak scheduling windows.
  • As environmental mandates tighten across international hubs, the procurement of zero-emission airport ground handling equipment has become a critical operational imperative. This shift has driven a 35% improvement in overall airside energy efficiency compared to legacy diesel operations, drastically lowering long-term maintenance overhead.
  • Furthermore, integrating battery electric airside transport optimization protocols enables facility managers to intelligently balance peak electrical grid loads with active fleet deployment requirements. The transition toward heavy-duty alternative fuel transit vehicles also addresses localized noise pollution and air quality concerns, safeguarding ramp worker health and enhancing the passenger experience.
  • Looking ahead, the gradual implementation of autonomous tarmac passenger mobility systems promises to eliminate driver shortages and optimize routing precision across congested active taxiways. By converging sustainable propulsion architectures with intelligent fleet management software, aviation authorities are establishing resilient, scalable ground support networks capable of absorbing escalating passenger volumes while simultaneously achieving aggressive corporate decarbonization targets.
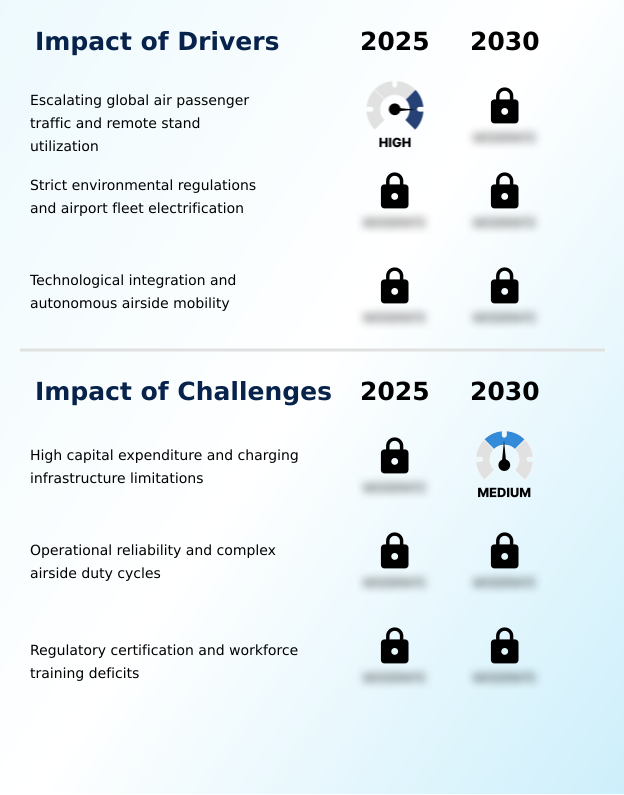
What are the key market drivers leading to the rise in the adoption of Apron Bus Industry?

  • Escalating air passenger traffic and the intensive utilization of remote aircraft parking stands serve as primary catalysts propelling the expansion of specialized airside transit fleets.

  • Unprecedented surges in global passenger traffic severely strain existing terminal infrastructure, accelerating the critical need for advanced aviation mobility solutions.
  • As physical gate availability diminishes, commercial hubs increasingly depend on remote aircraft parking stands to absorb overflow flight volumes, directly intensifying the demand for high-capacity ground handling logistics.
  • The strategic installation of rapid charging infrastructure allows operators to deploy specialized fleets continuously, driving a 20% increase in daily passenger throughput.
  • Concurrently, pioneering hydrogen fuel cell integration empowers facility planners to execute massive airport capacity expansion projects without exceeding strict municipal emission limits, lowering localized carbon output by 45%.
  • These systemic operational upgrades ensure reliable transit performance, enabling airlines to maintain aggressive flight schedules and maximize overall tarmac efficiency.

What are the market trends shaping the Apron Bus Industry?

  • The transition toward fleet electrification and the adoption of zero-emission alternative power systems represents a defining trend. This structural shift significantly influences procurement strategies across commercial aviation infrastructure.

  • The rapid integration of the zero-emission electric powertrain fundamentally redefines airport apron transit, compelling operators to overhaul traditional ground handling strategies. Driven by stringent fleet decarbonization mandates, aviation authorities are rapidly scaling sustainable mobility solutions to mitigate localized air pollution.
  • This technological shift directly enables dynamic operational flexibility, allowing facility managers to deploy specialized transit assets more effectively across congested tarmac environments. By implementing advanced smart fleet telematics, ground service providers have increased predictive maintenance accuracy by 25% and reduced unexpected vehicle downtime by 30%. Furthermore, these digital monitoring ecosystems proactively enforce airside safety compliance, ensuring optimal routing protocols.
  • The convergence of alternative propulsion and intelligent data analytics empowers transit operators to achieve substantial operational cost reductions while supporting long-term ecological sustainability objectives.

What challenges does the Apron Bus Industry face during its growth?

  • High capital expenditures and persistent limitations within high-voltage charging infrastructure present substantial barriers to the rapid modernization of airside passenger mobility networks.

  • The modernization of airside passenger mobility networks faces substantial structural limitations tied to complex operational environments and prohibitive capital constraints. Integrating advanced driver assistance systems into heavy-duty transit fleets requires extensive workforce retraining, which frequently delays technology deployment timelines and reduces immediate operational efficiency by 12% during the transition period.
  • Furthermore, powering specialized climate control units in extreme weather conditions heavily degrades battery performance, increasing the frequency of charging cycles by 18% and disrupting meticulous aircraft turnaround scheduling. Developing a fully optimized ergonomic cabin layout that balances maximized standing capacity with stringent safety regulations remains an ongoing engineering constraint.
  • These infrastructural and technological barriers force ground handling operators to navigate complex operational trade-offs, slowing the widespread realization of fully autonomous tarmac logistics.

Exclusive Technavio Analysis on Customer Landscape

The apron bus market forecasting report includes the adoption lifecycle of the market, covering from the innovator’s stage to the laggard’s stage. It focuses on adoption rates in different regions based on penetration. Furthermore, the apron bus market report also includes key purchase criteria and drivers of price sensitivity to help companies evaluate and develop their market growth analysis strategies.
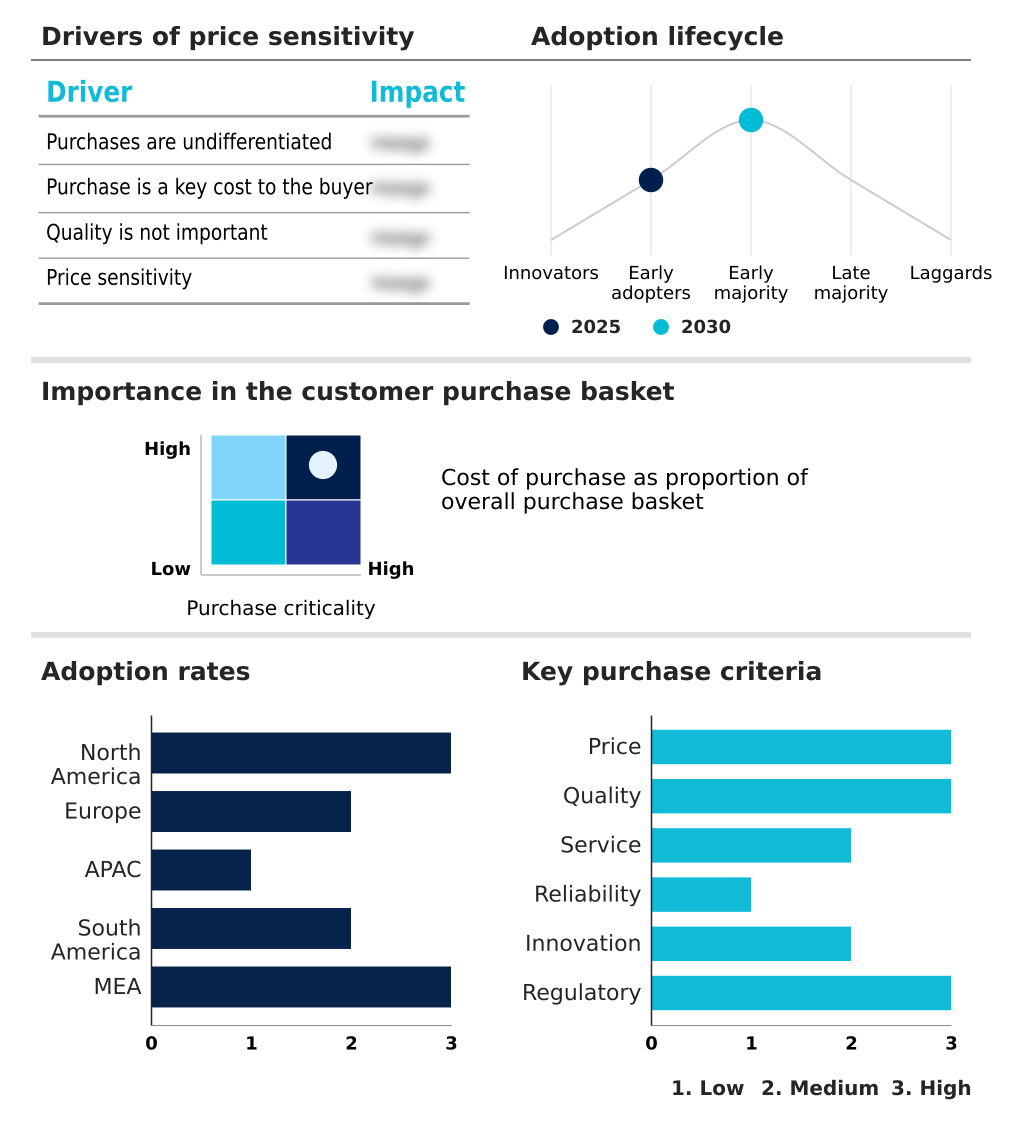
Customer Landscape of Apron Bus Industry

Competitive Landscape

Companies are implementing various strategies, such as strategic alliances, apron bus market forecast, partnerships, mergers and acquisitions, geographical expansion, and product/service launches, to enhance their presence in the industry.

Ashok Leyland Ltd. - The portfolio includes heavy-duty specialized transit vehicles engineered with optimal passenger capacity and ergonomic designs, supporting efficient tarmac mobility and reliable ground handling operations across commercial aviation infrastructure.

The industry research and growth report includes detailed analyses of the competitive landscape of the market and information about key companies, including:

  • Ashok Leyland Ltd.
  • BMC Otomotiv Sanayi ve Ticaret
  • BYD Co. Ltd.
  • COBUS Industries GmbH
  • Hino Motors Ltd.
  • Isuzu Motors Ltd.
  • Jiangsu Tianyi Aviation Industry
  • Karsan Otomotiv Sanayii ve
  • KIITOKORI OY
  • Mallaghan GA Inc.
  • MAN Truck and Bus SE
  • Otokar AS
  • Solaris Bus and Coach Sp. z o.o.
  • Sutlej Automotives Pvt. Ltd.
  • VDL Bus and Coach BV
  • Xiamen King Long Motor Co. Ltd.
  • Yutong Bus Co. Ltd.

Qualitative and quantitative analysis of companies has been conducted to help clients understand the wider business environment as well as the strengths and weaknesses of key industry players. Data is qualitatively analyzed to categorize companies as pure play, category-focused, industry-focused, and diversified; it is quantitatively analyzed to categorize companies as dominant, leading, strong, tentative, and weak.

Recent Development and News in Apron bus market

  • In the Automobile Manufacturers industry, the structural transition toward zero-emission electric powertrain architectures scaled production volumes for high-density lithium-ion battery packs, directly impacting Global Apron Bus Market 2026-2030 demand by reducing heavy-duty cell costs and accelerating airport fleet decarbonization mandates.
  • The enforcement of stringent urban emission control standards compelled heavy-duty commercial vehicle producers to standardize hydrogen fuel cell integration, which expanded alternative fuel propulsion options for zero-emission public transport and enhanced sustainable corporate strategies within airside passenger mobility operations.
  • Advancements in smart fleet telematics and advanced driver assistance systems across commercial logistics platforms established new safety benchmarks, effectively accelerating the deployment of autonomous airside navigation technologies and situational awareness sensors to optimize aircraft turnaround scheduling.
  • The widespread adoption of composite lightweight body manufacturing techniques for heavy transport applications lowered structural curb weights, significantly extending operational duty cycles and energy recovery braking efficiency for specialized airport ground support equipment.

Dive into Technavio’s robust research methodology, blending expert interviews, extensive data synthesis, and validated models for unparalleled Apron Bus Market insights. See full methodology.

Market Scope
Page number 316
Base year 2025
Historic period 2020-2024
Forecast period 2026-2030
Growth momentum & CAGR Accelerate at a CAGR of 10.7%
Market growth 2026-2030 USD 304168.9 thousand
Market structure Fragmented
YoY growth 2025-2026(%) 10.1%
Key countries US, Canada, Mexico, Germany, UK, France, Italy, Spain, The Netherlands, China, India, Japan, Australia, South Korea, Singapore, Brazil, Argentina, Chile, Saudi Arabia, UAE, South Africa, Qatar and Egypt
Competitive landscape Leading Companies, Market Positioning of Companies, Competitive Strategies, and Industry Risks

Request Free Sample

Research Analyst Overview

  • The Apron Bus Market continues to evolve as aviation stakeholders prioritize structural modernization and ecological compliance within critical ground handling logistics. The strategic shift toward alternative fuel propulsion profoundly influences boardroom-level capital expenditure planning, forcing facility directors to fundamentally restructure long-term procurement budgets to accommodate advanced infrastructure requirements.
  • By leveraging high-density lithium-ion battery packs and sophisticated battery thermal management systems, operators have successfully reduced vehicle energy consumption by 28%, significantly driving down lifecycle operational costs. Furthermore, the integration of a composite lightweight body alongside intelligent energy recovery braking mechanisms maximizes per-charge transit range, ensuring uninterrupted service across expansive tarmac environments.
  • The adoption of pneumatic kneeling suspension architectures enhances passenger accessibility, streamlining rapid disembarkation protocols. As digital connectivity permeates airside operations, the gradual deployment of autonomous airside navigation technology provides an unprecedented opportunity to optimize dynamic route efficiency and eliminate human error in highly congested active runway zones.
  • These specialized transit innovations collectively establish a highly resilient, data-driven framework for modern passenger mobility.

What are the Key Data Covered in this Apron Bus Market Research and Growth Report?

  • What is the expected growth of the Apron Bus Market between 2026 and 2030?

    • USD 304.17 million, at a CAGR of 10.7%

  • What segmentation does the market report cover?

    • The report is segmented by Propulsion (Diesel, Electric, CNG or LPG, and Hybrid), End-user (Commercial airports, Airlines, Ground handling companies, and Military airbases), Type (Low-floor apron bus, Conventional bus, Articulated bus, and Compact bus), Technology (Manual, Semi-automated, and Autonomous) and Geography (North America, Europe, APAC, South America, Middle East and Africa)

  • Which regions are analyzed in the report?

    • North America, Europe, APAC, South America and Middle East and Africa

  • What are the key growth drivers and market challenges?

    • Escalating global air passenger traffic and remote stand utilization, High capital expenditure and charging infrastructure limitations

  • Who are the major players in the Apron Bus Market?

    • Ashok Leyland Ltd., BMC Otomotiv Sanayi ve Ticaret, BYD Co. Ltd., COBUS Industries GmbH, Hino Motors Ltd., Isuzu Motors Ltd., Jiangsu Tianyi Aviation Industry, Karsan Otomotiv Sanayii ve, KIITOKORI OY, Mallaghan GA Inc., MAN Truck and Bus SE, Otokar AS, Solaris Bus and Coach Sp. z o.o., Sutlej Automotives Pvt. Ltd., VDL Bus and Coach BV, Xiamen King Long Motor Co. Ltd. and Yutong Bus Co. Ltd.

Market Research Insights

  • The Apron Bus Market is undergoing a rapid operational transformation driven by strict tarmac environmental regulations and fleet decarbonization mandates. Ground service providers are actively upgrading heavy-duty commercial vehicle fleets to optimize airside traffic management and mitigate airport terminal congestion.
  • By transitioning to advanced alternative fuel systems, operators have successfully reduced localized carbon emissions by 40% while simultaneously increasing passenger capacity optimization ratios by 22% during peak transit hours. Furthermore, the integration of real-time situational awareness sensors has improved safety compliance metrics by 15%, minimizing tarmac incidents.
  • These measurable efficiency gains enable sustainable corporate strategies, ensuring highly reliable airport passenger conveyance without compromising strict turnaround schedules.

We can help! Our analysts can customize this apron bus market research report to meet your requirements.

Get in touch

1. Executive Summary

1.1 Market overview

Executive Summary - Chart on Market Overview
Executive Summary - Data Table on Market Overview
Executive Summary - Chart on Global Market Characteristics
Executive Summary - Chart on Market by Geography
Executive Summary - Chart on Market Segmentation by Propulsion
Executive Summary - Chart on Market Segmentation by End-user
Executive Summary - Chart on Market Segmentation by Type
Executive Summary - Chart on Market Segmentation by Technology
Executive Summary - Chart on Incremental Growth
Executive Summary - Data Table on Incremental Growth
Executive Summary - Chart on Company Market Positioning

2. Technavio Analysis

2.1 Analysis of price sensitivity, lifecycle, customer purchase basket, adoption rates, and purchase criteria

2.2 Criticality of inputs and Factors of differentiation

Chart on Overview on criticality of inputs and factors of differentiation

2.3 Factors of disruption

Chart on Overview on factors of disruption

2.4 Impact of drivers and challenges

Chart on Impact of drivers and challenges in 2025 and 2030

3. Market Landscape

3.1 Market ecosystem

Chart on Parent Market
Data Table on - Parent Market

3.2 Market characteristics

Chart on Market characteristics analysis

3.3 Value chain analysis

Chart on Value chain analysis

4. Market Sizing

4.1 Market definition

Data Table on Offerings of companies included in the market definition

4.2 Market segment analysis

Market segments

4.3 Market size 2025

4.4 Market outlook: Forecast for 2025-2030

Chart on Global - Market size and forecast 2025-2030 ($ thousand)
Data Table on Global - Market size and forecast 2025-2030 ($ thousand)
Chart on Global Market: Year-over-year growth 2025-2030 (%)
Data Table on Global Market: Year-over-year growth 2025-2030 (%)

5. Historic Market Size

5.1 Global Apron Bus Market 2020 - 2024

Historic Market Size - Data Table on Global Apron Bus Market 2020 - 2024 ($ thousand)

5.2 Propulsion segment analysis 2020 - 2024

Historic Market Size - Propulsion Segment 2020 - 2024 ($ thousand)

5.3 End-user segment analysis 2020 - 2024

Historic Market Size - End-user Segment 2020 - 2024 ($ thousand)

5.4 Type segment analysis 2020 - 2024

Historic Market Size - Type Segment 2020 - 2024 ($ thousand)

5.5 Technology segment analysis 2020 - 2024

Historic Market Size - Technology Segment 2020 - 2024 ($ thousand)

5.6 Geography segment analysis 2020 - 2024

Historic Market Size - Geography Segment 2020 - 2024 ($ thousand)

5.7 Country segment analysis 2020 - 2024

Historic Market Size - Country Segment 2020 - 2024 ($ thousand)

6. Qualitative Analysis

6.1 Impact of AI on global apron bus market

6.2 Impact of geopolitical conflicts on global apron bus market

7. Five Forces Analysis

7.1 Five forces summary

Five forces analysis - Comparison between 2025 and 2030

7.2 Bargaining power of buyers

Bargaining power of buyers - Impact of key factors 2025 and 2030

7.3 Bargaining power of suppliers

Bargaining power of suppliers - Impact of key factors in 2025 and 2030

7.4 Threat of new entrants

Threat of new entrants - Impact of key factors in 2025 and 2030

7.5 Threat of substitutes

Threat of substitutes - Impact of key factors in 2025 and 2030

7.6 Threat of rivalry

Threat of rivalry - Impact of key factors in 2025 and 2030

7.7 Market condition

Chart on Market condition - Five forces 2025 and 2030

8. Market Segmentation by Propulsion

8.1 Market segments

Chart on Propulsion - Market share 2025-2030 (%)
Data Table on Propulsion - Market share 2025-2030 (%)

8.2 Comparison by Propulsion

Chart on Comparison by Propulsion
Data Table on Comparison by Propulsion

8.3 Diesel - Market size and forecast 2025-2030

Chart on Diesel - Market size and forecast 2025-2030 ($ thousand)
Data Table on Diesel - Market size and forecast 2025-2030 ($ thousand)
Chart on Diesel - Year-over-year growth 2025-2030 (%)
Data Table on Diesel - Year-over-year growth 2025-2030 (%)

8.4 Electric - Market size and forecast 2025-2030

Chart on Electric - Market size and forecast 2025-2030 ($ thousand)
Data Table on Electric - Market size and forecast 2025-2030 ($ thousand)
Chart on Electric - Year-over-year growth 2025-2030 (%)
Data Table on Electric - Year-over-year growth 2025-2030 (%)

8.5 CNG or LPG - Market size and forecast 2025-2030

Chart on CNG or LPG - Market size and forecast 2025-2030 ($ thousand)
Data Table on CNG or LPG - Market size and forecast 2025-2030 ($ thousand)
Chart on CNG or LPG - Year-over-year growth 2025-2030 (%)
Data Table on CNG or LPG - Year-over-year growth 2025-2030 (%)

8.6 Hybrid - Market size and forecast 2025-2030

Chart on Hybrid - Market size and forecast 2025-2030 ($ thousand)
Data Table on Hybrid - Market size and forecast 2025-2030 ($ thousand)
Chart on Hybrid - Year-over-year growth 2025-2030 (%)
Data Table on Hybrid - Year-over-year growth 2025-2030 (%)

8.7 Market opportunity by Propulsion

Market opportunity by Propulsion ($ thousand)
Data Table on Market opportunity by Propulsion ($ thousand)

9. Market Segmentation by End-user

9.1 Market segments

Chart on End-user - Market share 2025-2030 (%)
Data Table on End-user - Market share 2025-2030 (%)

9.2 Comparison by End-user

Chart on Comparison by End-user
Data Table on Comparison by End-user

9.3 Commercial airports - Market size and forecast 2025-2030

Chart on Commercial airports - Market size and forecast 2025-2030 ($ thousand)
Data Table on Commercial airports - Market size and forecast 2025-2030 ($ thousand)
Chart on Commercial airports - Year-over-year growth 2025-2030 (%)
Data Table on Commercial airports - Year-over-year growth 2025-2030 (%)

9.4 Airlines - Market size and forecast 2025-2030

Chart on Airlines - Market size and forecast 2025-2030 ($ thousand)
Data Table on Airlines - Market size and forecast 2025-2030 ($ thousand)
Chart on Airlines - Year-over-year growth 2025-2030 (%)
Data Table on Airlines - Year-over-year growth 2025-2030 (%)

9.5 Ground handling companies - Market size and forecast 2025-2030

Chart on Ground handling companies - Market size and forecast 2025-2030 ($ thousand)
Data Table on Ground handling companies - Market size and forecast 2025-2030 ($ thousand)
Chart on Ground handling companies - Year-over-year growth 2025-2030 (%)
Data Table on Ground handling companies - Year-over-year growth 2025-2030 (%)

9.6 Military airbases - Market size and forecast 2025-2030

Chart on Military airbases - Market size and forecast 2025-2030 ($ thousand)
Data Table on Military airbases - Market size and forecast 2025-2030 ($ thousand)
Chart on Military airbases - Year-over-year growth 2025-2030 (%)
Data Table on Military airbases - Year-over-year growth 2025-2030 (%)

9.7 Market opportunity by End-user

Market opportunity by End-user ($ thousand)
Data Table on Market opportunity by End-user ($ thousand)

10. Market Segmentation by Type

10.1 Market segments

Chart on Type - Market share 2025-2030 (%)
Data Table on Type - Market share 2025-2030 (%)

10.2 Comparison by Type

Chart on Comparison by Type
Data Table on Comparison by Type

10.3 Low-floor apron bus - Market size and forecast 2025-2030

Chart on Low-floor apron bus - Market size and forecast 2025-2030 ($ thousand)
Data Table on Low-floor apron bus - Market size and forecast 2025-2030 ($ thousand)
Chart on Low-floor apron bus - Year-over-year growth 2025-2030 (%)
Data Table on Low-floor apron bus - Year-over-year growth 2025-2030 (%)

10.4 Conventional bus - Market size and forecast 2025-2030

Chart on Conventional bus - Market size and forecast 2025-2030 ($ thousand)
Data Table on Conventional bus - Market size and forecast 2025-2030 ($ thousand)
Chart on Conventional bus - Year-over-year growth 2025-2030 (%)
Data Table on Conventional bus - Year-over-year growth 2025-2030 (%)

10.5 Articulated bus - Market size and forecast 2025-2030

Chart on Articulated bus - Market size and forecast 2025-2030 ($ thousand)
Data Table on Articulated bus - Market size and forecast 2025-2030 ($ thousand)
Chart on Articulated bus - Year-over-year growth 2025-2030 (%)
Data Table on Articulated bus - Year-over-year growth 2025-2030 (%)

10.6 Compact bus - Market size and forecast 2025-2030

Chart on Compact bus - Market size and forecast 2025-2030 ($ thousand)
Data Table on Compact bus - Market size and forecast 2025-2030 ($ thousand)
Chart on Compact bus - Year-over-year growth 2025-2030 (%)
Data Table on Compact bus - Year-over-year growth 2025-2030 (%)

10.7 Market opportunity by Type

Market opportunity by Type ($ thousand)
Data Table on Market opportunity by Type ($ thousand)

11. Market Segmentation by Technology

11.1 Market segments

Chart on Technology - Market share 2025-2030 (%)
Data Table on Technology - Market share 2025-2030 (%)

11.2 Comparison by Technology

Chart on Comparison by Technology
Data Table on Comparison by Technology

11.3 Manual - Market size and forecast 2025-2030

Chart on Manual - Market size and forecast 2025-2030 ($ thousand)
Data Table on Manual - Market size and forecast 2025-2030 ($ thousand)
Chart on Manual - Year-over-year growth 2025-2030 (%)
Data Table on Manual - Year-over-year growth 2025-2030 (%)

11.4 Semi-automated - Market size and forecast 2025-2030

Chart on Semi-automated - Market size and forecast 2025-2030 ($ thousand)
Data Table on Semi-automated - Market size and forecast 2025-2030 ($ thousand)
Chart on Semi-automated - Year-over-year growth 2025-2030 (%)
Data Table on Semi-automated - Year-over-year growth 2025-2030 (%)

11.5 Autonomous - Market size and forecast 2025-2030

Chart on Autonomous - Market size and forecast 2025-2030 ($ thousand)
Data Table on Autonomous - Market size and forecast 2025-2030 ($ thousand)
Chart on Autonomous - Year-over-year growth 2025-2030 (%)
Data Table on Autonomous - Year-over-year growth 2025-2030 (%)

11.6 Market opportunity by Technology

Market opportunity by Technology ($ thousand)
Data Table on Market opportunity by Technology ($ thousand)

12. Customer Landscape

12.1 Customer landscape overview

Analysis of price sensitivity, lifecycle, customer purchase basket, adoption rates, and purchase criteria

13. Geographic Landscape

13.1 Geographic segmentation

Chart on Market share by geography 2025-2030 (%)
Data Table on Market share by geography 2025-2030 (%)

13.2 Geographic comparison

Chart on Geographic comparison
Data Table on Geographic comparison

13.3 North America - Market size and forecast 2025-2030

Chart on North America - Market size and forecast 2025-2030 ($ thousand)
Data Table on North America - Market size and forecast 2025-2030 ($ thousand)
Chart on North America - Year-over-year growth 2025-2030 (%)
Data Table on North America - Year-over-year growth 2025-2030 (%)
Chart on Regional Comparison - North America
Data Table on Regional Comparison - North America

13.3.1 US - Market size and forecast 2025-2030

Chart on US - Market size and forecast 2025-2030 ($ thousand)
Data Table on US - Market size and forecast 2025-2030 ($ thousand)
Chart on US - Year-over-year growth 2025-2030 (%)
Data Table on US - Year-over-year growth 2025-2030 (%)

13.3.2 Canada - Market size and forecast 2025-2030

Chart on Canada - Market size and forecast 2025-2030 ($ thousand)
Data Table on Canada - Market size and forecast 2025-2030 ($ thousand)
Chart on Canada - Year-over-year growth 2025-2030 (%)
Data Table on Canada - Year-over-year growth 2025-2030 (%)

13.3.3 Mexico - Market size and forecast 2025-2030

Chart on Mexico - Market size and forecast 2025-2030 ($ thousand)
Data Table on Mexico - Market size and forecast 2025-2030 ($ thousand)
Chart on Mexico - Year-over-year growth 2025-2030 (%)
Data Table on Mexico - Year-over-year growth 2025-2030 (%)

13.4 Europe - Market size and forecast 2025-2030

Chart on Europe - Market size and forecast 2025-2030 ($ thousand)
Data Table on Europe - Market size and forecast 2025-2030 ($ thousand)
Chart on Europe - Year-over-year growth 2025-2030 (%)
Data Table on Europe - Year-over-year growth 2025-2030 (%)
Chart on Regional Comparison - Europe
Data Table on Regional Comparison - Europe

13.4.1 Germany - Market size and forecast 2025-2030

Chart on Germany - Market size and forecast 2025-2030 ($ thousand)
Data Table on Germany - Market size and forecast 2025-2030 ($ thousand)
Chart on Germany - Year-over-year growth 2025-2030 (%)
Data Table on Germany - Year-over-year growth 2025-2030 (%)

13.4.2 UK - Market size and forecast 2025-2030

Chart on UK - Market size and forecast 2025-2030 ($ thousand)
Data Table on UK - Market size and forecast 2025-2030 ($ thousand)
Chart on UK - Year-over-year growth 2025-2030 (%)
Data Table on UK - Year-over-year growth 2025-2030 (%)

13.4.3 France - Market size and forecast 2025-2030

Chart on France - Market size and forecast 2025-2030 ($ thousand)
Data Table on France - Market size and forecast 2025-2030 ($ thousand)
Chart on France - Year-over-year growth 2025-2030 (%)
Data Table on France - Year-over-year growth 2025-2030 (%)

13.4.4 Italy - Market size and forecast 2025-2030

Chart on Italy - Market size and forecast 2025-2030 ($ thousand)
Data Table on Italy - Market size and forecast 2025-2030 ($ thousand)
Chart on Italy - Year-over-year growth 2025-2030 (%)
Data Table on Italy - Year-over-year growth 2025-2030 (%)

13.4.5 Spain - Market size and forecast 2025-2030

Chart on Spain - Market size and forecast 2025-2030 ($ thousand)
Data Table on Spain - Market size and forecast 2025-2030 ($ thousand)
Chart on Spain - Year-over-year growth 2025-2030 (%)
Data Table on Spain - Year-over-year growth 2025-2030 (%)

13.4.6 The Netherlands - Market size and forecast 2025-2030

Chart on The Netherlands - Market size and forecast 2025-2030 ($ thousand)
Data Table on The Netherlands - Market size and forecast 2025-2030 ($ thousand)
Chart on The Netherlands - Year-over-year growth 2025-2030 (%)
Data Table on The Netherlands - Year-over-year growth 2025-2030 (%)

13.5 APAC - Market size and forecast 2025-2030

Chart on APAC - Market size and forecast 2025-2030 ($ thousand)
Data Table on APAC - Market size and forecast 2025-2030 ($ thousand)
Chart on APAC - Year-over-year growth 2025-2030 (%)
Data Table on APAC - Year-over-year growth 2025-2030 (%)
Chart on Regional Comparison - APAC
Data Table on Regional Comparison - APAC

13.5.1 China - Market size and forecast 2025-2030

Chart on China - Market size and forecast 2025-2030 ($ thousand)
Data Table on China - Market size and forecast 2025-2030 ($ thousand)
Chart on China - Year-over-year growth 2025-2030 (%)
Data Table on China - Year-over-year growth 2025-2030 (%)

13.5.2 India - Market size and forecast 2025-2030

Chart on India - Market size and forecast 2025-2030 ($ thousand)
Data Table on India - Market size and forecast 2025-2030 ($ thousand)
Chart on India - Year-over-year growth 2025-2030 (%)
Data Table on India - Year-over-year growth 2025-2030 (%)

13.5.3 Japan - Market size and forecast 2025-2030

Chart on Japan - Market size and forecast 2025-2030 ($ thousand)
Data Table on Japan - Market size and forecast 2025-2030 ($ thousand)
Chart on Japan - Year-over-year growth 2025-2030 (%)
Data Table on Japan - Year-over-year growth 2025-2030 (%)

13.5.4 Australia - Market size and forecast 2025-2030

Chart on Australia - Market size and forecast 2025-2030 ($ thousand)
Data Table on Australia - Market size and forecast 2025-2030 ($ thousand)
Chart on Australia - Year-over-year growth 2025-2030 (%)
Data Table on Australia - Year-over-year growth 2025-2030 (%)

13.5.5 South Korea - Market size and forecast 2025-2030

Chart on South Korea - Market size and forecast 2025-2030 ($ thousand)
Data Table on South Korea - Market size and forecast 2025-2030 ($ thousand)
Chart on South Korea - Year-over-year growth 2025-2030 (%)
Data Table on South Korea - Year-over-year growth 2025-2030 (%)

13.5.6 Singapore - Market size and forecast 2025-2030

Chart on Singapore - Market size and forecast 2025-2030 ($ thousand)
Data Table on Singapore - Market size and forecast 2025-2030 ($ thousand)
Chart on Singapore - Year-over-year growth 2025-2030 (%)
Data Table on Singapore - Year-over-year growth 2025-2030 (%)

13.6 South America - Market size and forecast 2025-2030

Chart on South America - Market size and forecast 2025-2030 ($ thousand)
Data Table on South America - Market size and forecast 2025-2030 ($ thousand)
Chart on South America - Year-over-year growth 2025-2030 (%)
Data Table on South America - Year-over-year growth 2025-2030 (%)
Chart on Regional Comparison - South America
Data Table on Regional Comparison - South America

13.6.1 Brazil - Market size and forecast 2025-2030

Chart on Brazil - Market size and forecast 2025-2030 ($ thousand)
Data Table on Brazil - Market size and forecast 2025-2030 ($ thousand)
Chart on Brazil - Year-over-year growth 2025-2030 (%)
Data Table on Brazil - Year-over-year growth 2025-2030 (%)

13.6.2 Argentina - Market size and forecast 2025-2030

Chart on Argentina - Market size and forecast 2025-2030 ($ thousand)
Data Table on Argentina - Market size and forecast 2025-2030 ($ thousand)
Chart on Argentina - Year-over-year growth 2025-2030 (%)
Data Table on Argentina - Year-over-year growth 2025-2030 (%)

13.6.3 Chile - Market size and forecast 2025-2030

Chart on Chile - Market size and forecast 2025-2030 ($ thousand)
Data Table on Chile - Market size and forecast 2025-2030 ($ thousand)
Chart on Chile - Year-over-year growth 2025-2030 (%)
Data Table on Chile - Year-over-year growth 2025-2030 (%)

13.7 Middle East and Africa - Market size and forecast 2025-2030

Chart on Middle East and Africa - Market size and forecast 2025-2030 ($ thousand)
Data Table on Middle East and Africa - Market size and forecast 2025-2030 ($ thousand)
Chart on Middle East and Africa - Year-over-year growth 2025-2030 (%)
Data Table on Middle East and Africa - Year-over-year growth 2025-2030 (%)
Chart on Regional Comparison - Middle East and Africa
Data Table on Regional Comparison - Middle East and Africa

13.7.1 Saudi Arabia - Market size and forecast 2025-2030

Chart on Saudi Arabia - Market size and forecast 2025-2030 ($ thousand)
Data Table on Saudi Arabia - Market size and forecast 2025-2030 ($ thousand)
Chart on Saudi Arabia - Year-over-year growth 2025-2030 (%)
Data Table on Saudi Arabia - Year-over-year growth 2025-2030 (%)

13.7.2 UAE - Market size and forecast 2025-2030

Chart on UAE - Market size and forecast 2025-2030 ($ thousand)
Data Table on UAE - Market size and forecast 2025-2030 ($ thousand)
Chart on UAE - Year-over-year growth 2025-2030 (%)
Data Table on UAE - Year-over-year growth 2025-2030 (%)

13.7.3 South Africa - Market size and forecast 2025-2030

Chart on South Africa - Market size and forecast 2025-2030 ($ thousand)
Data Table on South Africa - Market size and forecast 2025-2030 ($ thousand)
Chart on South Africa - Year-over-year growth 2025-2030 (%)
Data Table on South Africa - Year-over-year growth 2025-2030 (%)

13.7.4 Qatar - Market size and forecast 2025-2030

Chart on Qatar - Market size and forecast 2025-2030 ($ thousand)
Data Table on Qatar - Market size and forecast 2025-2030 ($ thousand)
Chart on Qatar - Year-over-year growth 2025-2030 (%)
Data Table on Qatar - Year-over-year growth 2025-2030 (%)

13.7.5 Egypt - Market size and forecast 2025-2030

Chart on Egypt - Market size and forecast 2025-2030 ($ thousand)
Data Table on Egypt - Market size and forecast 2025-2030 ($ thousand)
Chart on Egypt - Year-over-year growth 2025-2030 (%)
Data Table on Egypt - Year-over-year growth 2025-2030 (%)

13.8 Market opportunity by geography

Market opportunity by geography ($ thousand)
Data Tables on Market opportunity by geography ($ thousand)

14. Drivers, Challenges, and Opportunity

14.1 Market drivers

Escalating global air passenger traffic and remote stand utilization
Strict environmental regulations and airport fleet electrification
Technological integration and autonomous airside mobility

14.2 Market challenges

High capital expenditure and charging infrastructure limitations
Operational reliability and complex airside duty cycles
Regulatory certification and workforce training deficits

14.3 Impact of drivers and challenges

Impact of drivers and challenges in 2025 and 2030

14.4 Market opportunities

Fleet electrification and adoption of zero-emission alternative power systems
Integration of smart fleet management, telematics, and IoT solutions
Deployment of high-capacity wide-body designs and autonomous navigation technologies

15. Competitive Landscape

15.1 Overview

15.2

Overview on criticality of inputs and factors of differentiation

15.3 Landscape disruption

Overview on factors of disruption

15.4 Industry risks

Impact of key risks on business

16. Competitive Analysis

16.1 Companies profiled

Companies covered

16.2 Company ranking index

16.3 Market positioning of companies

Matrix on companies position and classification

16.4 Ashok Leyland Ltd.

Ashok Leyland Ltd. - Overview
Ashok Leyland Ltd. - Product / Service
Ashok Leyland Ltd. - Key offerings
SWOT

16.5 BMC Otomotiv Sanayi ve Ticaret

BMC Otomotiv Sanayi ve Ticaret - Overview
BMC Otomotiv Sanayi ve Ticaret - Product / Service
BMC Otomotiv Sanayi ve Ticaret - Key offerings
SWOT

16.6 BYD Co. Ltd.

BYD Co. Ltd. - Overview
BYD Co. Ltd. - Business segments
BYD Co. Ltd. - Key news
BYD Co. Ltd. - Key offerings
BYD Co. Ltd. - Segment focus
SWOT

16.7 COBUS Industries GmbH

COBUS Industries GmbH - Overview
COBUS Industries GmbH - Product / Service
COBUS Industries GmbH - Key offerings
SWOT

16.8 Hino Motors Ltd.

Hino Motors Ltd. - Overview
Hino Motors Ltd. - Product / Service
Hino Motors Ltd. - Key offerings
SWOT

16.9 Isuzu Motors Ltd.

Isuzu Motors Ltd. - Overview
Isuzu Motors Ltd. - Business segments
Isuzu Motors Ltd. - Key offerings
Isuzu Motors Ltd. - Segment focus
SWOT

16.10 Jiangsu Tianyi Aviation Industry

Jiangsu Tianyi Aviation Industry - Overview
Jiangsu Tianyi Aviation Industry - Product / Service
Jiangsu Tianyi Aviation Industry - Key offerings
SWOT

16.11 Karsan Otomotiv Sanayii ve

Karsan Otomotiv Sanayii ve - Overview
Karsan Otomotiv Sanayii ve - Product / Service
Karsan Otomotiv Sanayii ve - Key offerings
SWOT

16.12 Mallaghan GA Inc.

Mallaghan GA Inc. - Overview
Mallaghan GA Inc. - Product / Service
Mallaghan GA Inc. - Key offerings
SWOT

16.13 MAN Truck and Bus SE

MAN Truck and Bus SE - Overview
MAN Truck and Bus SE - Product / Service
MAN Truck and Bus SE - Key offerings
SWOT

16.14 Otokar AS

Otokar AS - Overview
Otokar AS - Business segments
Otokar AS - Key offerings
Otokar AS - Segment focus
SWOT

16.15 Solaris Bus and Coach Sp. z o.o.

Solaris Bus and Coach Sp. z o.o. - Overview
Solaris Bus and Coach Sp. z o.o. - Product / Service
Solaris Bus and Coach Sp. z o.o. - Key offerings
SWOT

16.16 VDL Bus and Coach BV

VDL Bus and Coach BV - Overview
VDL Bus and Coach BV - Product / Service
VDL Bus and Coach BV - Key offerings
SWOT

16.17 Xiamen King Long Motor Co. Ltd.

Xiamen King Long Motor Co. Ltd. - Overview
Xiamen King Long Motor Co. Ltd. - Product / Service
Xiamen King Long Motor Co. Ltd. - Key offerings
SWOT

16.18 Yutong Bus Co. Ltd.

Yutong Bus Co. Ltd. - Overview
Yutong Bus Co. Ltd. - Product / Service
Yutong Bus Co. Ltd. - Key offerings
SWOT

17. Appendix

17.1 Scope of the report

Market definition
Objectives
Notes and caveats

17.2 Inclusions and exclusions checklist

Inclusions checklist
Exclusions checklist

17.3 Currency conversion rates for US$

17.4 Research methodology

17.5 Data procurement

Information sources

17.6 Data validation

17.7 Validation techniques employed for market sizing

17.8 Data synthesis

17.9 360 degree market analysis

17.10 List of abbreviations

Research Methodology

Technavio presents a detailed picture of the market by way of study, synthesis, and summation of data from multiple sources. The analysts have presented the various facets of the market with a particular focus on identifying the key industry influencers. The data thus presented is comprehensive, reliable, and the result of extensive research, both primary and secondary.

INFORMATION SOURCES

Primary sources

  • Manufacturers and suppliers
  • Channel partners
  • Industry experts
  • Strategic decision makers

Secondary sources

  • Industry journals and periodicals
  • Government data
  • Financial reports of key industry players
  • Historical data
  • Press releases

DATA ANALYSIS

Data Synthesis

  • Collation of data
  • Estimation of key figures
  • Analysis of derived insights

Data Validation

  • Triangulation with data models
  • Reference against proprietary databases
  • Corroboration with industry experts

REPORT WRITING

Qualitative

  • Market drivers
  • Market challenges
  • Market trends
  • Five forces analysis

Quantitative

  • Market size and forecast
  • Market segmentation
  • Geographical insights
  • Competitive landscape

Interested in this report?

Get your sample now to see our research methodology and insights!

Download Now

Frequently Asked Questions

Apron Bus market growth will increase by USD 304168.9 thousand thousand during 2026-2030.

The Apron Bus market is expected to grow at a CAGR of 10.7% during 2026-2030.

Apron Bus market is segmented by Propulsion (Diesel, Electric, CNG or LPG, Hybrid) End-user (Commercial airports, Airlines, Ground handling companies, Military airbases) Type (Low-floor apron bus, Conventional bus, Articulated bus, Compact bus) Technology (Manual, Semi-automated, Autonomous)

Ashok Leyland Ltd., BMC Otomotiv Sanayi ve Ticaret, BYD Co. Ltd., COBUS Industries GmbH, Hino Motors Ltd., Isuzu Motors Ltd., Jiangsu Tianyi Aviation Industry, Karsan Otomotiv Sanayii ve, KIITOKORI OY, Mallaghan GA Inc., MAN Truck and Bus SE, Otokar AS, Solaris Bus and Coach Sp. z o.o., Sutlej Automotives Pvt. Ltd., VDL Bus and Coach BV, Xiamen King Long Motor Co. Ltd., Yutong Bus Co. Ltd. are a few of the key vendors in the Apron Bus market.

North America will register the highest growth rate of 43.1% among the other regions. Therefore, the Apron Bus market in North America is expected to garner significant business opportunities for the vendors during the forecast period.

US, Canada, Mexico, Germany, UK, France, Italy, Spain, The Netherlands, China, India, Japan, Australia, South Korea, Singapore, Brazil, Argentina, Chile, Saudi Arabia, UAE, South Africa, Qatar, Egypt

  • Escalating global air passenger traffic and remote stand utilization is the driving factor this market.

The Apron Bus market vendors should focus on grabbing business opportunities from the Propulsion segment as it accounted for the largest market share in the base year.
RIA - Research AI Assistant
Ask RIA
