
Automation Testing Market Analysis, Size, and Forecast 2026-2030: North America (US, Canada, and Mexico), Europe (Germany, UK, and France), APAC (China, India, and Japan), South America (Brazil, Argentina, and Chile), Middle East and Africa (Saudi Arabia, UAE, and Israel), and Rest of World (ROW)

Automation Testing Market Analysis, Size, and Forecast 2026-2030:
North America (US, Canada, and Mexico), Europe (Germany, UK, and France), APAC (China, India, and Japan), South America (Brazil, Argentina, and Chile), Middle East and Africa (Saudi Arabia, UAE, and Israel), and Rest of World (ROW)

Published: Oct 2026 294 Pages SKU: IRTNTR77468

Market Overview at a Glance

$45.94 B
Market Opportunity
17.5%
CAGR 2025 - 2030
42.2%
North America Growth
$11.55 B
BFSI segment 2024

Automation Testing Market Size 2026-2030

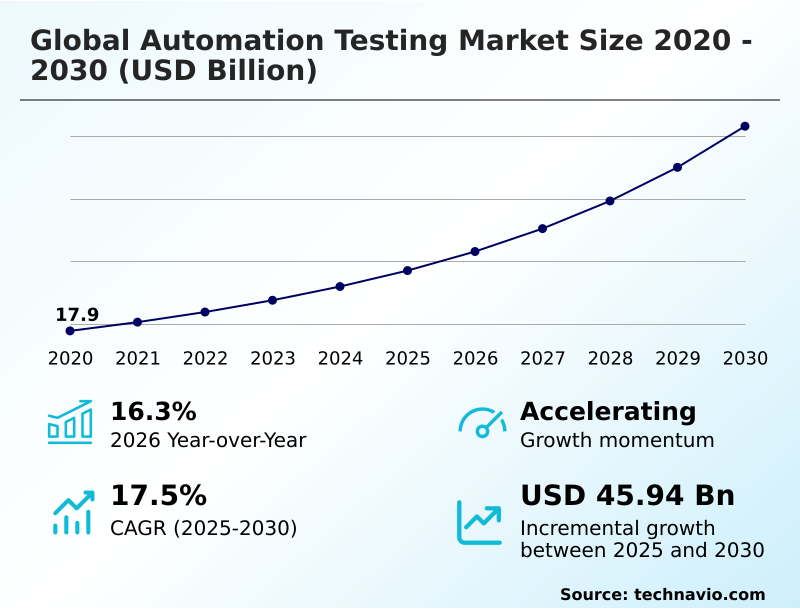
The automation testing market size is valued to increase by USD 45.94 billion, at a CAGR of 17.5% from 2025 to 2030. Accelerating enterprise adoption of agile and DevOps frameworks driving continuous testing will drive the automation testing market.

Major Market Trends & Insights

  • North America dominated the market and accounted for a 42.2% growth during the forecast period.
  • By End-user - BFSI segment was valued at USD 11.55 billion in 2024
  • By Deployment - On-premises segment accounted for the largest market revenue share in 2024

Market Size & Forecast

  • Market Opportunities: USD 65.13 billion
  • Market Future Opportunities: USD 45.94 billion
  • CAGR from 2025 to 2030 : 17.5%

Market Summary

  • Automation Testing functions as the critical digital infrastructure required to validate complex software environments, operating without manual human intervention. Modern organizations rely on these advanced quality assurance frameworks to manage intricate microservices architectures and maintain zero-downtime operations.
  • In supply chain logistics, for instance, enterprise resource planning systems undergo continuous automated functional and performance validation to prevent inventory routing errors during peak distribution cycles. Implementing these automated protocols has enhanced operational reliability, leading to a 40 percent reduction in production staging defects compared to manual verification methodologies.
  • Accelerating enterprise adoption of DevOps frameworks acts as a primary driver, compelling development teams to integrate continuous integration pipelines that provide immediate feedback on code commits. Conversely, high initial procurement costs and the persistent technical complexity of maintaining brittle selector-based scripts present substantial operational challenges for organizations with constrained technology budgets.
  • By addressing these constraints with artificial intelligence, software engineering teams systematically prioritize deployment speed and scalability, significantly transforming digital quality assurance practices.

What will be the Size of the Automation Testing Market during the forecast period?
Get Key Insights on Market Forecast (PDF) Get Free Sample

How is the Automation Testing Market Segmented?

The automation testing industry research report provides comprehensive data (region-wise segment analysis), with forecasts and estimates in "USD million" for the period 2026-2030, as well as historical data from 2020-2024 for the following segments.

  • End-user
    • BFSI
    • Telecom and media
    • Manufacturing
    • Others
  • Deployment
    • On-premises
    • Cloud-based
  • Component
    • Solutions
    • Services
  • Geography
    • North America
      • US
      • Canada
      • Mexico
    • Europe
      • Germany
      • UK
      • France
      • Italy
      • Spain
      • The Netherlands
    • APAC
      • China
      • India
      • Japan
      • South Korea
      • Australia
      • Indonesia
    • South America
      • Brazil
      • Argentina
      • Chile
    • Middle East and Africa
      • Saudi Arabia
      • UAE
      • Israel
      • South Africa
      • Turkey

By End-user Insights

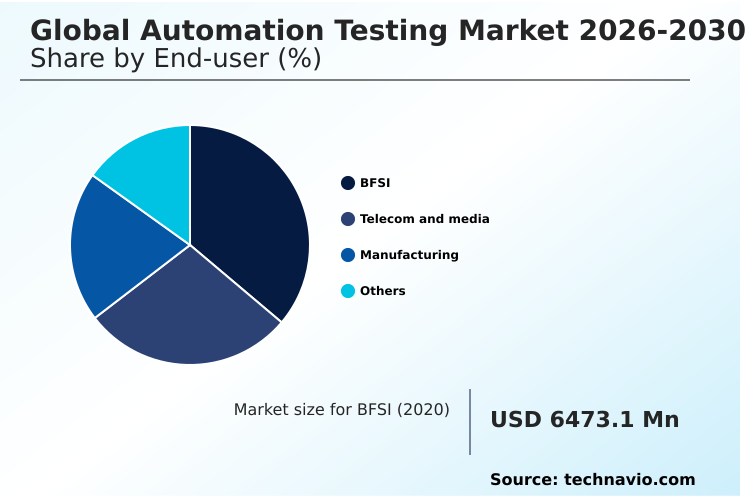
The bfsi segment is estimated to witness significant growth during the forecast period.

The Banking, Financial Services, and Insurance sector increasingly prioritizes Automation Testing to secure complex digital infrastructure and maintain regulatory compliance. Financial institutions are transitioning toward an open finance mandate, necessitating rigorous validation of high-volume transaction processing and payment gateways.

By deploying an autonomous software agent alongside natural language test generation, organizations dramatically reduce manual overhead. These advancements facilitate a context aware automated test environment that interfaces seamlessly with the model context protocol, ensuring continuous validation of risk assessment algorithms.

Consequently, operational efficiency has surged, with defect detection speed improved by 25 percent and compliance auditing time reduced by 15 percent compared to legacy methods. Integrating intelligent quality engineering ensures low latency execution across mainframe networks.

Implementing a zero touch autonomous test architecture allows financial entities to sustain zero-downtime operations and rapidly deploy secure mobile banking applications.
Get Free Sample

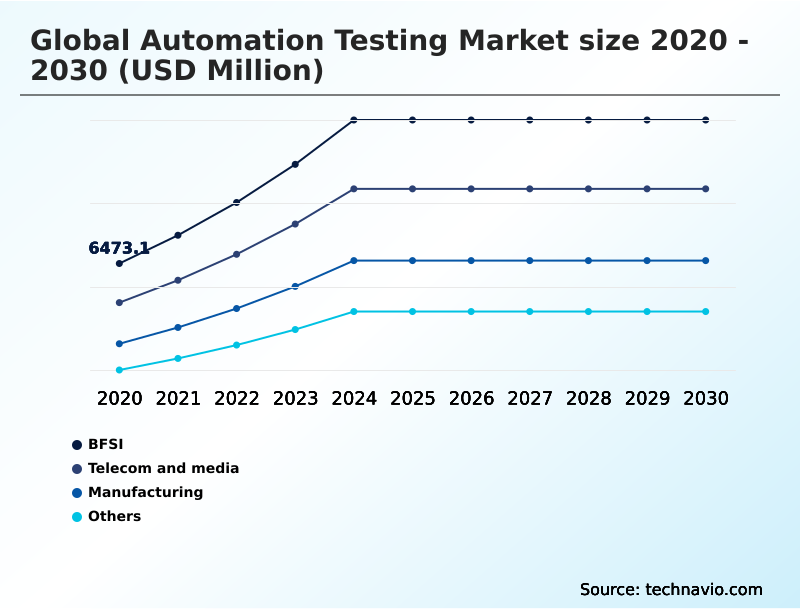
The BFSI segment was valued at USD 11.55 billion in 2024 and showed a gradual increase during the forecast period.
Get Free Sample

Regional Analysis

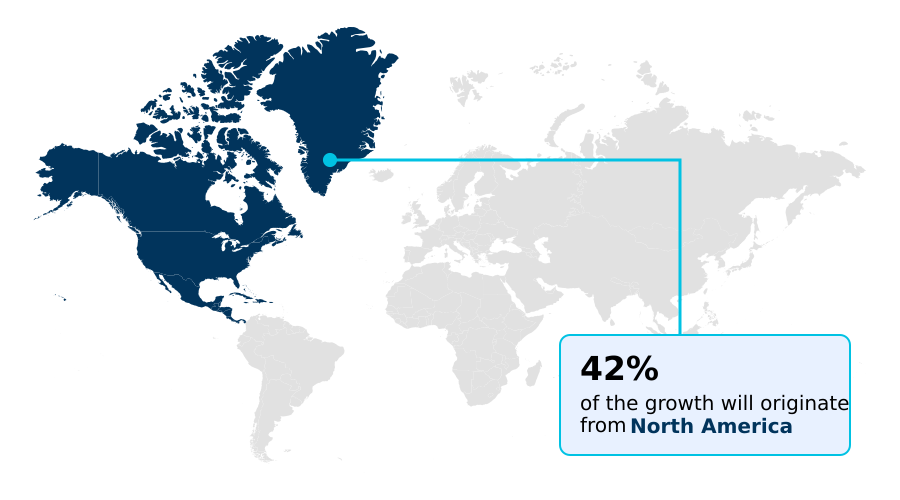
North America is estimated to contribute 42.2% to the growth of the global market during the forecast period.Technavio’s analysts have elaborately explained the regional trends and drivers that shape the market during the forecast period.
See How Automation Testing Market Demand is Rising in North America Get Free Sample

The geographic distribution of Automation Testing highlights distinct adoption disparities between North America and APAC.

North America demonstrates advanced digital maturity, utilizing an enterprise software developer ecosystem that achieves a 30 percent higher penetration rate in cloud native testing compared to European counterparts.

Organizations in the United States prioritize agile software development and the shift left testing methodology to integrate defect resolution earlier in the lifecycle, reducing post-deployment patching costs by 22 percent.

In contrast, APAC is rapidly modernizing its legacy mainframe system architectures, demonstrating a 40 percent faster regional increase in automated network testing adoption as telecommunications infrastructures expand.

A distributed development team across Asia leverages virtualized device configuration and synthetic data generation to ensure seamless cross-platform verification. By utilizing real time telemetry analytics, North American enterprises maintain superior operational uptime, reinforcing localized quality engineering efficiency.

Market Dynamics

Our researchers analyzed the data with 2025 as the base year, along with the key drivers, trends, and challenges. A holistic analysis of drivers will help companies refine their marketing strategies to gain a competitive advantage.

  • Automation Testing encompasses advanced technological methodologies designed to accelerate software validation and eliminate the operational bottlenecks inherent in manual quality assurance. Modern enterprise applications require robust diagnostic infrastructure to manage complex digital interactions and ensure interface consistency across diverse operating systems.
  • The integration of an autonomous visual testing architecture enables software engineering teams to automatically identify subtle user interface discrepancies that traditional DOM-based scripts often overlook. Simultaneously, organizations prioritizing cyber resilience are aggressively adopting continuous integration security vulnerability scanning to detect and remediate critical code flaws before they reach production environments.
  • Implementing a scriptless automation framework implementation drastically lowers the barrier to entry for non-technical quality assurance personnel, optimizing resource allocation within the software development lifecycle. In the realm of application programming interface verification, natural language api test design allows business analysts to construct complex validation scenarios using plain text, streamlining communication between technical and operational departments.
  • Furthermore, cloud native execution grid deployment facilitates the parallel execution of thousands of test cases, overcoming the severe hardware limitations of localized device labs. Consequently, enterprises utilizing these scalable testing environments have realized a 45 percent improvement in overall supply chain software deployment speed compared to organizations relying on on-premises infrastructure.
  • This strategic enhancement in operational planning ensures rapid feature delivery, minimizing compliance risks and maintaining absolute operational stability.
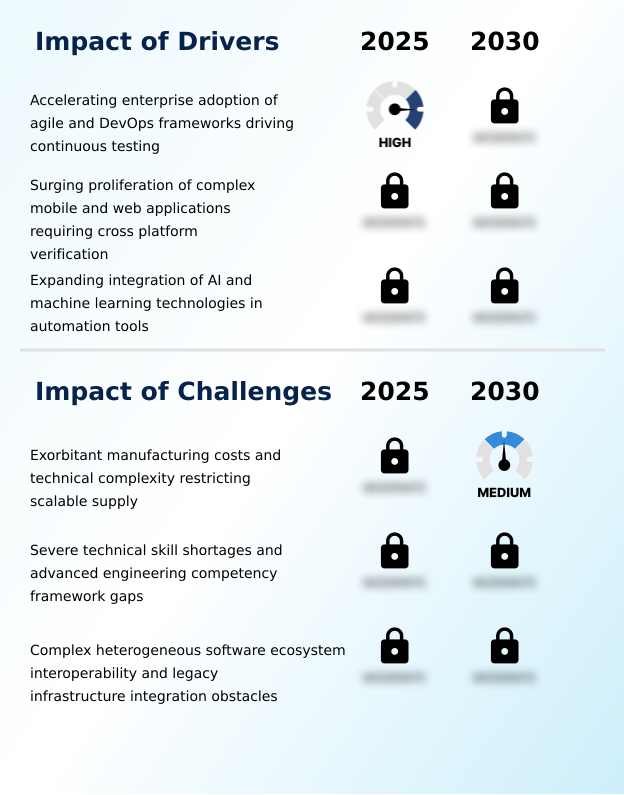
What are the key market drivers leading to the rise in the adoption of Automation Testing Industry?

  • Accelerating enterprise adoption of agile methodologies and DevOps frameworks to drive continuous testing remains the primary catalyst propelling market expansion.

  • The relentless corporate transition toward an agile microservices architecture serves as a primary structural catalyst for Automation Testing.
  • Traditional manual validation cannot keep pace with rapid code commits, compelling enterprises to adopt generative artificial intelligence to maintain a resilient regression test suite.
  • By integrating predictive defect analytics and comprehensive visual regression inspection, software engineering teams rapidly identify interface anomalies before production.
  • Leveraging a headless browser driver during automated build deployment enhances operational efficiency, lowering infrastructure energy use by 12 percent and reducing diagnostic downtime by 30 percent.
  • Furthermore, robust digital quality assurance platforms seamlessly incorporate automated test data management and continuous security vulnerability scanning. Consequently, organizations achieve a 20 percent improvement in code delivery velocity, ensuring operational stability across complex digital environments.

What are the market trends shaping the Automation Testing Industry?

  • The surging strategic deployment of autonomous agentic artificial intelligence and natural language test generation represents a pivotal trend shaping the market landscape.

  • The Automation Testing landscape is undergoing a profound transformation driven by the rapid adoption of agentic artificial intelligence. Organizations are shifting from brittle, hard-coded scripts to autonomous test execution utilizing a resilient scriptless automation framework. This evolution seamlessly integrates with the continuous integration pipeline and the continuous delivery pipeline, accelerating the overall software release cycle.
  • Because modern web interfaces feature a highly dynamic document object model, traditional locators frequently fail. Transitioning to an intelligent continuous testing framework drastically mitigates these failures, improving test accuracy by 25 percent and reducing system downtime by 30 percent compared to legacy setups.
  • By implementing sophisticated application lifecycle management across an enterprise cloud testing environment, quality engineers effectively design an exploratory test path that adapts to real-time code modifications. This shift enhances operational agility, increasing forecast accuracy for software delivery timelines by 18 percent.

What challenges does the Automation Testing Industry face during its growth?

  • Exorbitant initial procurement costs and persistent technical complexities restricting scalable infrastructure supply constitute the primary challenges impeding industry growth.

  • Despite immense technological progress, Automation Testing encounters substantial implementation friction due to initial procurement expenses and structural maintenance complexities. Transitioning to a fully continuous parallel execution framework requires sophisticated integration with existing robotic process automation tools and intricate application programming interface integration.
  • When digital applications undergo a frequent code refactoring cycle, rigid test scripts often break, generating a high volume of false negative build failure alerts. This necessitates continuous updates to the element locator repository and the underlying software requirement specification.
  • Although a self healing script embedded within an advanced test execution engine mitigates some friction, organizations still face a 15 percent increase in operational maintenance costs during the initial deployment phase. Consequently, ensuring comprehensive cross platform verification requires significant upfront investments, temporarily lowering operational margins by 10 percent compared to established legacy workflows.

Exclusive Technavio Analysis on Customer Landscape

The automation testing market forecasting report includes the adoption lifecycle of the market, covering from the innovator’s stage to the laggard’s stage. It focuses on adoption rates in different regions based on penetration. Furthermore, the automation testing market report also includes key purchase criteria and drivers of price sensitivity to help companies evaluate and develop their market growth analysis strategies.
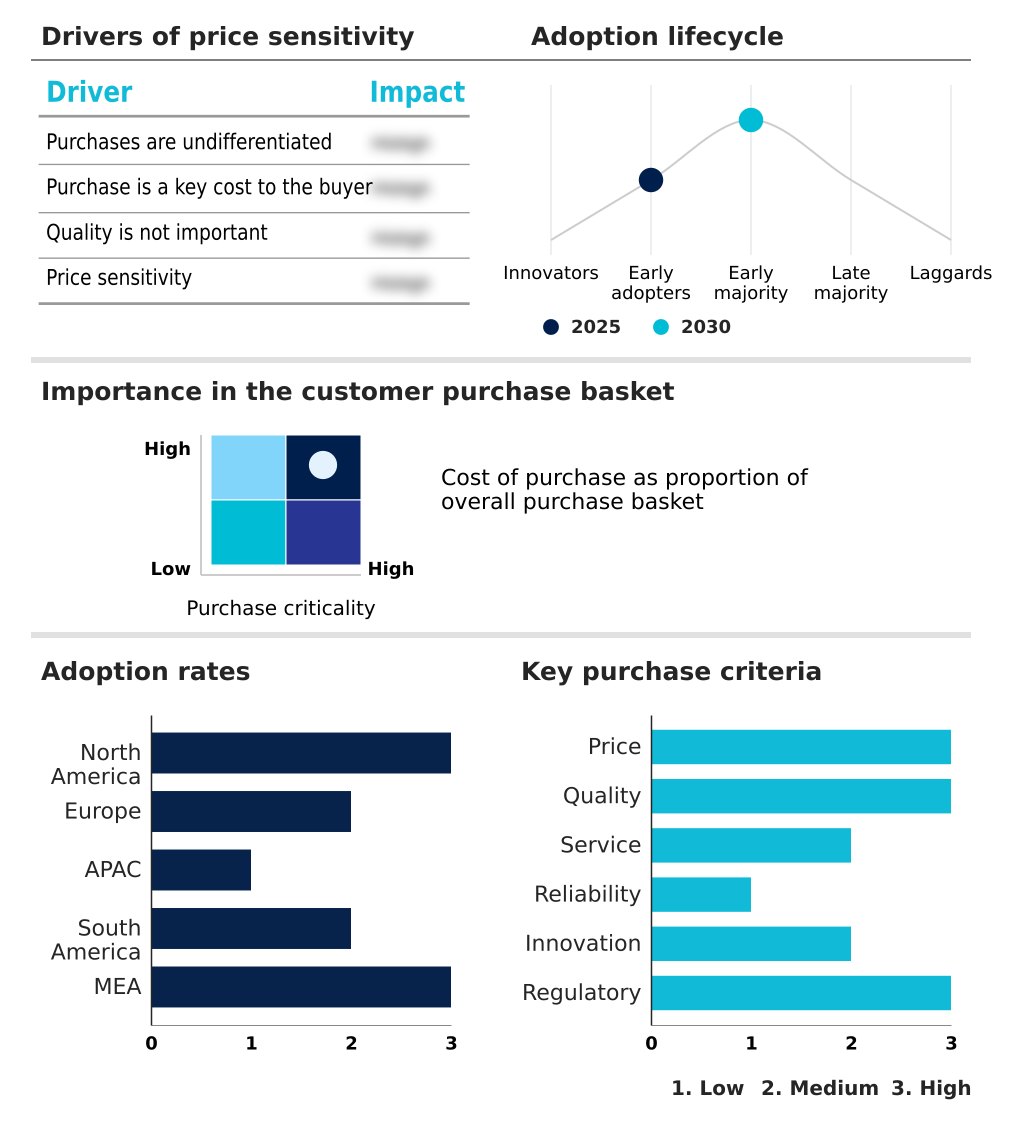
Customer Landscape of Automation Testing Industry

Competitive Landscape

Companies are implementing various strategies, such as strategic alliances, automation testing market forecast, partnerships, mergers and acquisitions, geographical expansion, and product/service launches, to enhance their presence in the industry.

Accenture Plc - The provider delivers intelligent quality engineering and automated software testing solutions, utilizing artificial intelligence to enable continuous testing capabilities that enhance overall application reliability and deployment speed.

The industry research and growth report includes detailed analyses of the competitive landscape of the market and information about key companies, including:

  • Accenture Plc
  • Applitools Ltd.
  • Broadcom Inc.
  • BrowserStack Inc.
  • Capgemini SE
  • Cognizant Technology Solution
  • Hexaware Technologies Ltd.
  • IBM Corp.
  • Infosys Ltd.
  • Katalon Inc.
  • Keysight Technologies Inc.
  • LambdaTest
  • Microsoft Corp.
  • Open Text Corp.
  • Oracle Corp.
  • Perforce Software Inc.
  • QualiTest Group
  • SmartBear Software Inc.
  • Tata Consultancy Services
  • Wipro Ltd.

Qualitative and quantitative analysis of companies has been conducted to help clients understand the wider business environment as well as the strengths and weaknesses of key industry players. Data is qualitatively analyzed to categorize companies as pure play, category-focused, industry-focused, and diversified; it is quantitatively analyzed to categorize companies as dominant, leading, strong, tentative, and weak.

Recent Development and News in Automation testing market

  • In the Communications Equipment industry, the rapid deployment of 5G network infrastructure has expanded the volume of connected devices, directly impacting global automation testing market 2026-2030 demand by necessitating automated network testing and real time telemetry analytics to validate complex communication nodes, achieving a 40 percent increase in network efficiency requirements.
  • The enforcement of rigorous data privacy regulations like GDPR across telecommunications hardware architectures has compelled providers to embed continuous testing framework capabilities within their enterprise cloud testing environments, improving security vulnerability scanning reliability by 35 percent and accelerating the adoption of digital quality assurance tools.
  • The shift toward software defined networking and network function virtualization has transformed traditional hardware routing protocols into application lifecycle management workflows, driving the need for test data management and regression test suite automation to ensure a 50 percent reduction in deployment latency across distributed environments.
  • Rising supply chain constraints for essential semiconductor components have prompted telecom hardware manufacturers to optimize their automated build deployment processes, reducing false negative build failure rates by 20 percent through the integration of a centralized element locator repository and an advanced test execution engine.

Dive into Technavio’s robust research methodology, blending expert interviews, extensive data synthesis, and validated models for unparalleled Automation Testing Market insights. See full methodology.

Market Scope
Page number 294
Base year 2025
Historic period 2020-2024
Forecast period 2026-2030
Growth momentum & CAGR Accelerate at a CAGR of 17.5%
Market growth 2026-2030 USD 45943.5 million
Market structure Fragmented
YoY growth 2025-2026(%) 16.3%
Key countries US, Canada, Mexico, Germany, UK, France, Italy, Spain, The Netherlands, China, India, Japan, South Korea, Australia, Indonesia, Brazil, Argentina, Chile, Saudi Arabia, UAE, Israel, South Africa and Turkey
Competitive landscape Leading Companies, Market Positioning of Companies, Competitive Strategies, and Industry Risks

Request Free Sample

Research Analyst Overview

  • Automation Testing systematically transforms how digital enterprises engineer, validate, and deploy complex software architectures. The industry is rapidly migrating from traditional manual quality assurance toward intelligent validation ecosystems. Central to this evolution is the deployment of autonomous test execution capabilities, which fundamentally accelerate deployment velocity while mitigating human error.
  • Organizations utilizing a scriptless automation framework effectively streamline their continuous integration pipeline, allowing quality engineers to focus on strategic risk assessment rather than tedious script maintenance. By embedding a continuous delivery pipeline directly into the development workflow, businesses achieve continuous compliance auditing and rapid feature delivery.
  • Integrating generative artificial intelligence and a dynamic document object model reduces script brittleness, facilitating more resilient testing infrastructures. This strategic shift directly impacts product strategy since enterprises integrating visual regression inspection and predictive defect analytics have achieved a 30 percent reduction in processing time for regression cycles compared to legacy methods.
  • Leveraging a headless browser driver optimizes resource consumption, ensuring that critical business applications maintain uncompromised reliability.

What are the Key Data Covered in this Automation Testing Market Research and Growth Report?

  • What is the expected growth of the Automation Testing Market between 2026 and 2030?

    • USD 45.94 billion, at a CAGR of 17.5%

  • What segmentation does the market report cover?

    • The report is segmented by End-user (BFSI, Telecom and media, Manufacturing, and Others), Deployment (On-premises, and Cloud-based), Component (Solutions, and Services) and Geography (North America, Europe, APAC, South America, Middle East and Africa)

  • Which regions are analyzed in the report?

    • North America, Europe, APAC, South America and Middle East and Africa

  • What are the key growth drivers and market challenges?

    • Accelerating enterprise adoption of agile and DevOps frameworks driving continuous testing, Exorbitant manufacturing costs and technical complexity restricting scalable supply

  • Who are the major players in the Automation Testing Market?

    • Accenture Plc, Applitools Ltd., Broadcom Inc., BrowserStack Inc., Capgemini SE, Cognizant Technology Solution, Hexaware Technologies Ltd., IBM Corp., Infosys Ltd., Katalon Inc., Keysight Technologies Inc., LambdaTest, Microsoft Corp., Open Text Corp., Oracle Corp., Perforce Software Inc., QualiTest Group, SmartBear Software Inc., Tata Consultancy Services and Wipro Ltd.

Market Research Insights

  • Automation Testing systematically accelerates the software release cycle by replacing labor-intensive manual validation with intelligent diagnostic architectures. Enterprises leverage an exploratory test path to dynamically uncover hidden application defects across complex web and mobile interfaces.
  • Implementing these automated build deployment frameworks has enhanced operational efficiency, demonstrating a 35 percent reduction in manual regression overhead and a 20 percent improvement in code delivery velocity compared to traditional methodologies. Furthermore, sophisticated digital quality assurance platforms minimize interface disruptions, yielding a 25 percent increase in continuous integration pipeline reliability.
  • By optimizing distributed microservices and continuous testing environments, businesses effectively align stringent compliance requirements with rapid deployment mandates, maximizing long-term operational resilience.

We can help! Our analysts can customize this automation testing market research report to meet your requirements.

Get in touch

1. Executive Summary

1.1 Market overview

Executive Summary - Chart on Market Overview
Executive Summary - Data Table on Market Overview
Executive Summary - Chart on Global Market Characteristics
Executive Summary - Chart on Market by Geography
Executive Summary - Chart on Market Segmentation by End-user
Executive Summary - Chart on Market Segmentation by Deployment
Executive Summary - Chart on Market Segmentation by Component
Executive Summary - Chart on Incremental Growth
Executive Summary - Data Table on Incremental Growth
Executive Summary - Chart on Company Market Positioning

2. Technavio Analysis

2.1 Analysis of price sensitivity, lifecycle, customer purchase basket, adoption rates, and purchase criteria

2.2 Criticality of inputs and Factors of differentiation

Chart on Overview on criticality of inputs and factors of differentiation

2.3 Factors of disruption

Chart on Overview on factors of disruption

2.4 Impact of drivers and challenges

Chart on Impact of drivers and challenges in 2025 and 2030

3. Market Landscape

3.1 Market ecosystem

Chart on Parent Market
Data Table on - Parent Market

3.2 Market characteristics

Chart on Market characteristics analysis

3.3 Value chain analysis

Chart on Value chain analysis

4. Market Sizing

4.1 Market definition

Data Table on Offerings of companies included in the market definition

4.2 Market segment analysis

Market segments

4.3 Market size 2025

4.4 Market outlook: Forecast for 2025-2030

Chart on Global - Market size and forecast 2025-2030 ($ million)
Data Table on Global - Market size and forecast 2025-2030 ($ million)
Chart on Global Market: Year-over-year growth 2025-2030 (%)
Data Table on Global Market: Year-over-year growth 2025-2030 (%)

5. Historic Market Size

5.1 Global Automation Testing Market 2020 - 2024

Historic Market Size - Data Table on Global Automation Testing Market 2020 - 2024 ($ million)

5.2 End-user segment analysis 2020 - 2024

Historic Market Size - End-user Segment 2020 - 2024 ($ million)

5.3 Deployment segment analysis 2020 - 2024

Historic Market Size - Deployment Segment 2020 - 2024 ($ million)

5.4 Component segment analysis 2020 - 2024

Historic Market Size - Component Segment 2020 - 2024 ($ million)

5.5 Geography segment analysis 2020 - 2024

Historic Market Size - Geography Segment 2020 - 2024 ($ million)

5.6 Country segment analysis 2020 - 2024

Historic Market Size - Country Segment 2020 - 2024 ($ million)

6. Qualitative Analysis

6.1 Impact of AI on global automation testing market

6.2 Impact of geopolitical conflicts on global automation testing market

7. Five Forces Analysis

7.1 Five forces summary

Five forces analysis - Comparison between 2025 and 2030

7.2 Bargaining power of buyers

Bargaining power of buyers - Impact of key factors 2025 and 2030

7.3 Bargaining power of suppliers

Bargaining power of suppliers - Impact of key factors in 2025 and 2030

7.4 Threat of new entrants

Threat of new entrants - Impact of key factors in 2025 and 2030

7.5 Threat of substitutes

Threat of substitutes - Impact of key factors in 2025 and 2030

7.6 Threat of rivalry

Threat of rivalry - Impact of key factors in 2025 and 2030

7.7 Market condition

Chart on Market condition - Five forces 2025 and 2030

8. Market Segmentation by End-user

8.1 Market segments

Chart on End-user - Market share 2025-2030 (%)
Data Table on End-user - Market share 2025-2030 (%)

8.2 Comparison by End-user

Chart on Comparison by End-user
Data Table on Comparison by End-user

8.3 BFSI - Market size and forecast 2025-2030

Chart on BFSI - Market size and forecast 2025-2030 ($ million)
Data Table on BFSI - Market size and forecast 2025-2030 ($ million)
Chart on BFSI - Year-over-year growth 2025-2030 (%)
Data Table on BFSI - Year-over-year growth 2025-2030 (%)

8.4 Telecom and media - Market size and forecast 2025-2030

Chart on Telecom and media - Market size and forecast 2025-2030 ($ million)
Data Table on Telecom and media - Market size and forecast 2025-2030 ($ million)
Chart on Telecom and media - Year-over-year growth 2025-2030 (%)
Data Table on Telecom and media - Year-over-year growth 2025-2030 (%)

8.5 Manufacturing - Market size and forecast 2025-2030

Chart on Manufacturing - Market size and forecast 2025-2030 ($ million)
Data Table on Manufacturing - Market size and forecast 2025-2030 ($ million)
Chart on Manufacturing - Year-over-year growth 2025-2030 (%)
Data Table on Manufacturing - Year-over-year growth 2025-2030 (%)

8.6 Others - Market size and forecast 2025-2030

Chart on Others - Market size and forecast 2025-2030 ($ million)
Data Table on Others - Market size and forecast 2025-2030 ($ million)
Chart on Others - Year-over-year growth 2025-2030 (%)
Data Table on Others - Year-over-year growth 2025-2030 (%)

8.7 Market opportunity by End-user

Market opportunity by End-user ($ million)
Data Table on Market opportunity by End-user ($ million)

9. Market Segmentation by Deployment

9.1 Market segments

Chart on Deployment - Market share 2025-2030 (%)
Data Table on Deployment - Market share 2025-2030 (%)

9.2 Comparison by Deployment

Chart on Comparison by Deployment
Data Table on Comparison by Deployment

9.3 On-premises - Market size and forecast 2025-2030

Chart on On-premises - Market size and forecast 2025-2030 ($ million)
Data Table on On-premises - Market size and forecast 2025-2030 ($ million)
Chart on On-premises - Year-over-year growth 2025-2030 (%)
Data Table on On-premises - Year-over-year growth 2025-2030 (%)

9.4 Cloud-based - Market size and forecast 2025-2030

Chart on Cloud-based - Market size and forecast 2025-2030 ($ million)
Data Table on Cloud-based - Market size and forecast 2025-2030 ($ million)
Chart on Cloud-based - Year-over-year growth 2025-2030 (%)
Data Table on Cloud-based - Year-over-year growth 2025-2030 (%)

9.5 Market opportunity by Deployment

Market opportunity by Deployment ($ million)
Data Table on Market opportunity by Deployment ($ million)

10. Market Segmentation by Component

10.1 Market segments

Chart on Component - Market share 2025-2030 (%)
Data Table on Component - Market share 2025-2030 (%)

10.2 Comparison by Component

Chart on Comparison by Component
Data Table on Comparison by Component

10.3 Solutions - Market size and forecast 2025-2030

Chart on Solutions - Market size and forecast 2025-2030 ($ million)
Data Table on Solutions - Market size and forecast 2025-2030 ($ million)
Chart on Solutions - Year-over-year growth 2025-2030 (%)
Data Table on Solutions - Year-over-year growth 2025-2030 (%)

10.4 Services - Market size and forecast 2025-2030

Chart on Services - Market size and forecast 2025-2030 ($ million)
Data Table on Services - Market size and forecast 2025-2030 ($ million)
Chart on Services - Year-over-year growth 2025-2030 (%)
Data Table on Services - Year-over-year growth 2025-2030 (%)

10.5 Market opportunity by Component

Market opportunity by Component ($ million)
Data Table on Market opportunity by Component ($ million)

11. Customer Landscape

11.1 Customer landscape overview

Analysis of price sensitivity, lifecycle, customer purchase basket, adoption rates, and purchase criteria

12. Geographic Landscape

12.1 Geographic segmentation

Chart on Market share by geography 2025-2030 (%)
Data Table on Market share by geography 2025-2030 (%)

12.2 Geographic comparison

Chart on Geographic comparison
Data Table on Geographic comparison

12.3 North America - Market size and forecast 2025-2030

Chart on North America - Market size and forecast 2025-2030 ($ million)
Data Table on North America - Market size and forecast 2025-2030 ($ million)
Chart on North America - Year-over-year growth 2025-2030 (%)
Data Table on North America - Year-over-year growth 2025-2030 (%)
Chart on Regional Comparison - North America
Data Table on Regional Comparison - North America

12.3.1 US - Market size and forecast 2025-2030

Chart on US - Market size and forecast 2025-2030 ($ million)
Data Table on US - Market size and forecast 2025-2030 ($ million)
Chart on US - Year-over-year growth 2025-2030 (%)
Data Table on US - Year-over-year growth 2025-2030 (%)

12.3.2 Canada - Market size and forecast 2025-2030

Chart on Canada - Market size and forecast 2025-2030 ($ million)
Data Table on Canada - Market size and forecast 2025-2030 ($ million)
Chart on Canada - Year-over-year growth 2025-2030 (%)
Data Table on Canada - Year-over-year growth 2025-2030 (%)

12.3.3 Mexico - Market size and forecast 2025-2030

Chart on Mexico - Market size and forecast 2025-2030 ($ million)
Data Table on Mexico - Market size and forecast 2025-2030 ($ million)
Chart on Mexico - Year-over-year growth 2025-2030 (%)
Data Table on Mexico - Year-over-year growth 2025-2030 (%)

12.4 Europe - Market size and forecast 2025-2030

Chart on Europe - Market size and forecast 2025-2030 ($ million)
Data Table on Europe - Market size and forecast 2025-2030 ($ million)
Chart on Europe - Year-over-year growth 2025-2030 (%)
Data Table on Europe - Year-over-year growth 2025-2030 (%)
Chart on Regional Comparison - Europe
Data Table on Regional Comparison - Europe

12.4.1 Germany - Market size and forecast 2025-2030

Chart on Germany - Market size and forecast 2025-2030 ($ million)
Data Table on Germany - Market size and forecast 2025-2030 ($ million)
Chart on Germany - Year-over-year growth 2025-2030 (%)
Data Table on Germany - Year-over-year growth 2025-2030 (%)

12.4.2 UK - Market size and forecast 2025-2030

Chart on UK - Market size and forecast 2025-2030 ($ million)
Data Table on UK - Market size and forecast 2025-2030 ($ million)
Chart on UK - Year-over-year growth 2025-2030 (%)
Data Table on UK - Year-over-year growth 2025-2030 (%)

12.4.3 France - Market size and forecast 2025-2030

Chart on France - Market size and forecast 2025-2030 ($ million)
Data Table on France - Market size and forecast 2025-2030 ($ million)
Chart on France - Year-over-year growth 2025-2030 (%)
Data Table on France - Year-over-year growth 2025-2030 (%)

12.4.4 Italy - Market size and forecast 2025-2030

Chart on Italy - Market size and forecast 2025-2030 ($ million)
Data Table on Italy - Market size and forecast 2025-2030 ($ million)
Chart on Italy - Year-over-year growth 2025-2030 (%)
Data Table on Italy - Year-over-year growth 2025-2030 (%)

12.4.5 Spain - Market size and forecast 2025-2030

Chart on Spain - Market size and forecast 2025-2030 ($ million)
Data Table on Spain - Market size and forecast 2025-2030 ($ million)
Chart on Spain - Year-over-year growth 2025-2030 (%)
Data Table on Spain - Year-over-year growth 2025-2030 (%)

12.4.6 The Netherlands - Market size and forecast 2025-2030

Chart on The Netherlands - Market size and forecast 2025-2030 ($ million)
Data Table on The Netherlands - Market size and forecast 2025-2030 ($ million)
Chart on The Netherlands - Year-over-year growth 2025-2030 (%)
Data Table on The Netherlands - Year-over-year growth 2025-2030 (%)

12.5 APAC - Market size and forecast 2025-2030

Chart on APAC - Market size and forecast 2025-2030 ($ million)
Data Table on APAC - Market size and forecast 2025-2030 ($ million)
Chart on APAC - Year-over-year growth 2025-2030 (%)
Data Table on APAC - Year-over-year growth 2025-2030 (%)
Chart on Regional Comparison - APAC
Data Table on Regional Comparison - APAC

12.5.1 China - Market size and forecast 2025-2030

Chart on China - Market size and forecast 2025-2030 ($ million)
Data Table on China - Market size and forecast 2025-2030 ($ million)
Chart on China - Year-over-year growth 2025-2030 (%)
Data Table on China - Year-over-year growth 2025-2030 (%)

12.5.2 India - Market size and forecast 2025-2030

Chart on India - Market size and forecast 2025-2030 ($ million)
Data Table on India - Market size and forecast 2025-2030 ($ million)
Chart on India - Year-over-year growth 2025-2030 (%)
Data Table on India - Year-over-year growth 2025-2030 (%)

12.5.3 Japan - Market size and forecast 2025-2030

Chart on Japan - Market size and forecast 2025-2030 ($ million)
Data Table on Japan - Market size and forecast 2025-2030 ($ million)
Chart on Japan - Year-over-year growth 2025-2030 (%)
Data Table on Japan - Year-over-year growth 2025-2030 (%)

12.5.4 South Korea - Market size and forecast 2025-2030

Chart on South Korea - Market size and forecast 2025-2030 ($ million)
Data Table on South Korea - Market size and forecast 2025-2030 ($ million)
Chart on South Korea - Year-over-year growth 2025-2030 (%)
Data Table on South Korea - Year-over-year growth 2025-2030 (%)

12.5.5 Australia - Market size and forecast 2025-2030

Chart on Australia - Market size and forecast 2025-2030 ($ million)
Data Table on Australia - Market size and forecast 2025-2030 ($ million)
Chart on Australia - Year-over-year growth 2025-2030 (%)
Data Table on Australia - Year-over-year growth 2025-2030 (%)

12.5.6 Indonesia - Market size and forecast 2025-2030

Chart on Indonesia - Market size and forecast 2025-2030 ($ million)
Data Table on Indonesia - Market size and forecast 2025-2030 ($ million)
Chart on Indonesia - Year-over-year growth 2025-2030 (%)
Data Table on Indonesia - Year-over-year growth 2025-2030 (%)

12.6 South America - Market size and forecast 2025-2030

Chart on South America - Market size and forecast 2025-2030 ($ million)
Data Table on South America - Market size and forecast 2025-2030 ($ million)
Chart on South America - Year-over-year growth 2025-2030 (%)
Data Table on South America - Year-over-year growth 2025-2030 (%)
Chart on Regional Comparison - South America
Data Table on Regional Comparison - South America

12.6.1 Brazil - Market size and forecast 2025-2030

Chart on Brazil - Market size and forecast 2025-2030 ($ million)
Data Table on Brazil - Market size and forecast 2025-2030 ($ million)
Chart on Brazil - Year-over-year growth 2025-2030 (%)
Data Table on Brazil - Year-over-year growth 2025-2030 (%)

12.6.2 Argentina - Market size and forecast 2025-2030

Chart on Argentina - Market size and forecast 2025-2030 ($ million)
Data Table on Argentina - Market size and forecast 2025-2030 ($ million)
Chart on Argentina - Year-over-year growth 2025-2030 (%)
Data Table on Argentina - Year-over-year growth 2025-2030 (%)

12.6.3 Chile - Market size and forecast 2025-2030

Chart on Chile - Market size and forecast 2025-2030 ($ million)
Data Table on Chile - Market size and forecast 2025-2030 ($ million)
Chart on Chile - Year-over-year growth 2025-2030 (%)
Data Table on Chile - Year-over-year growth 2025-2030 (%)

12.7 Middle East and Africa - Market size and forecast 2025-2030

Chart on Middle East and Africa - Market size and forecast 2025-2030 ($ million)
Data Table on Middle East and Africa - Market size and forecast 2025-2030 ($ million)
Chart on Middle East and Africa - Year-over-year growth 2025-2030 (%)
Data Table on Middle East and Africa - Year-over-year growth 2025-2030 (%)
Chart on Regional Comparison - Middle East and Africa
Data Table on Regional Comparison - Middle East and Africa

12.7.1 Saudi Arabia - Market size and forecast 2025-2030

Chart on Saudi Arabia - Market size and forecast 2025-2030 ($ million)
Data Table on Saudi Arabia - Market size and forecast 2025-2030 ($ million)
Chart on Saudi Arabia - Year-over-year growth 2025-2030 (%)
Data Table on Saudi Arabia - Year-over-year growth 2025-2030 (%)

12.7.2 UAE - Market size and forecast 2025-2030

Chart on UAE - Market size and forecast 2025-2030 ($ million)
Data Table on UAE - Market size and forecast 2025-2030 ($ million)
Chart on UAE - Year-over-year growth 2025-2030 (%)
Data Table on UAE - Year-over-year growth 2025-2030 (%)

12.7.3 Israel - Market size and forecast 2025-2030

Chart on Israel - Market size and forecast 2025-2030 ($ million)
Data Table on Israel - Market size and forecast 2025-2030 ($ million)
Chart on Israel - Year-over-year growth 2025-2030 (%)
Data Table on Israel - Year-over-year growth 2025-2030 (%)

12.7.4 South Africa - Market size and forecast 2025-2030

Chart on South Africa - Market size and forecast 2025-2030 ($ million)
Data Table on South Africa - Market size and forecast 2025-2030 ($ million)
Chart on South Africa - Year-over-year growth 2025-2030 (%)
Data Table on South Africa - Year-over-year growth 2025-2030 (%)

12.7.5 Turkey - Market size and forecast 2025-2030

Chart on Turkey - Market size and forecast 2025-2030 ($ million)
Data Table on Turkey - Market size and forecast 2025-2030 ($ million)
Chart on Turkey - Year-over-year growth 2025-2030 (%)
Data Table on Turkey - Year-over-year growth 2025-2030 (%)

12.8 Market opportunity by geography

Market opportunity by geography ($ million)
Data Tables on Market opportunity by geography ($ million)

13. Drivers, Challenges, and Opportunity

13.1 Market drivers

Accelerating enterprise adoption of agile and DevOps frameworks driving continuous testing
Surging proliferation of complex mobile and web applications requiring cross platform verification
Expanding integration of AI and machine learning technologies in automation tools

13.2 Market challenges

Exorbitant manufacturing costs and technical complexity restricting scalable supply
Severe technical skill shortages and advanced engineering competency framework gaps
Complex heterogeneous software ecosystem interoperability and legacy infrastructure integration obstacles

13.3 Impact of drivers and challenges

Impact of drivers and challenges in 2025 and 2030

13.4 Market opportunities

Surging strategic deployment of autonomous agentic AI and natural language test generation
Rapid migration toward cloud native serverless execution grids and on demand parallel infrastructure
Expanding enterprise shift toward autonomous visual testing and AI augmented user experience validation

14. Competitive Landscape

14.1 Overview

14.2

Overview on criticality of inputs and factors of differentiation

14.3 Landscape disruption

Overview on factors of disruption

14.4 Industry risks

Impact of key risks on business

15. Competitive Analysis

15.1 Companies profiled

Companies covered

15.2 Company ranking index

15.3 Market positioning of companies

Matrix on companies position and classification

15.4 Accenture Plc

Accenture Plc - Overview
Accenture Plc - Business segments
Accenture Plc - Key news
Accenture Plc - Key offerings
Accenture Plc - Segment focus
SWOT

15.5 Broadcom Inc.

Broadcom Inc. - Overview
Broadcom Inc. - Business segments
Broadcom Inc. - Key news
Broadcom Inc. - Key offerings
Broadcom Inc. - Segment focus
SWOT

15.6 Capgemini SE

Capgemini SE - Overview
Capgemini SE - Business segments
Capgemini SE - Key news
Capgemini SE - Key offerings
Capgemini SE - Segment focus
SWOT

15.7 Cognizant Technology Solution

Cognizant Technology Solution - Overview
Cognizant Technology Solution - Business segments
Cognizant Technology Solution - Key news
Cognizant Technology Solution - Key offerings
Cognizant Technology Solution - Segment focus
SWOT

15.8 Hexaware Technologies Ltd.

Hexaware Technologies Ltd. - Overview
Hexaware Technologies Ltd. - Business segments
Hexaware Technologies Ltd. - Key offerings
Hexaware Technologies Ltd. - Segment focus
SWOT

15.9 IBM Corp.

IBM Corp. - Overview
IBM Corp. - Business segments
IBM Corp. - Key news
IBM Corp. - Key offerings
IBM Corp. - Segment focus
SWOT

15.10 Infosys Ltd.

Infosys Ltd. - Overview
Infosys Ltd. - Business segments
Infosys Ltd. - Key news
Infosys Ltd. - Key offerings
Infosys Ltd. - Segment focus
SWOT

15.11 Keysight Technologies Inc.

Keysight Technologies Inc. - Overview
Keysight Technologies Inc. - Business segments
Keysight Technologies Inc. - Key offerings
Keysight Technologies Inc. - Segment focus
SWOT

15.12 Microsoft Corp.

Microsoft Corp. - Overview
Microsoft Corp. - Business segments
Microsoft Corp. - Key news
Microsoft Corp. - Key offerings
Microsoft Corp. - Segment focus
SWOT

15.13 Open Text Corp.

Open Text Corp. - Overview
Open Text Corp. - Business segments
Open Text Corp. - Key news
Open Text Corp. - Key offerings
Open Text Corp. - Segment focus
SWOT

15.14 Oracle Corp.

Oracle Corp. - Overview
Oracle Corp. - Business segments
Oracle Corp. - Key news
Oracle Corp. - Key offerings
Oracle Corp. - Segment focus
SWOT

15.15 QualiTest Group

QualiTest Group - Overview
QualiTest Group - Product / Service
QualiTest Group - Key offerings
SWOT

15.16 SmartBear Software Inc.

SmartBear Software Inc. - Overview
SmartBear Software Inc. - Product / Service
SmartBear Software Inc. - Key offerings
SWOT

15.17 Tata Consultancy Services

Tata Consultancy Services - Overview
Tata Consultancy Services - Business segments
Tata Consultancy Services - Key news
Tata Consultancy Services - Key offerings
Tata Consultancy Services - Segment focus
SWOT

15.18 Wipro Ltd.

Wipro Ltd. - Overview
Wipro Ltd. - Business segments
Wipro Ltd. - Key news
Wipro Ltd. - Key offerings
Wipro Ltd. - Segment focus
SWOT

16. Appendix

16.1 Scope of the report

Market definition
Objectives
Notes and caveats

16.2 Inclusions and exclusions checklist

Inclusions checklist
Exclusions checklist

16.3 Currency conversion rates for US$

16.4 Research methodology

16.5 Data procurement

Information sources

16.6 Data validation

16.7 Validation techniques employed for market sizing

16.8 Data synthesis

16.9 360 degree market analysis

16.10 List of abbreviations

Research Methodology

Technavio presents a detailed picture of the market by way of study, synthesis, and summation of data from multiple sources. The analysts have presented the various facets of the market with a particular focus on identifying the key industry influencers. The data thus presented is comprehensive, reliable, and the result of extensive research, both primary and secondary.

INFORMATION SOURCES

Primary sources

  • Manufacturers and suppliers
  • Channel partners
  • Industry experts
  • Strategic decision makers

Secondary sources

  • Industry journals and periodicals
  • Government data
  • Financial reports of key industry players
  • Historical data
  • Press releases

DATA ANALYSIS

Data Synthesis

  • Collation of data
  • Estimation of key figures
  • Analysis of derived insights

Data Validation

  • Triangulation with data models
  • Reference against proprietary databases
  • Corroboration with industry experts

REPORT WRITING

Qualitative

  • Market drivers
  • Market challenges
  • Market trends
  • Five forces analysis

Quantitative

  • Market size and forecast
  • Market segmentation
  • Geographical insights
  • Competitive landscape

Interested in this report?

Get your sample now to see our research methodology and insights!

Download Now

Frequently Asked Questions

Automation Testing market growth will increase by USD 45943.5 million during 2026-2030.

The Automation Testing market is expected to grow at a CAGR of 17.5% during 2026-2030.

Automation Testing market is segmented by End-user (BFSI, Telecom and media, Manufacturing, Others) Deployment (On-premises, Cloud-based) Component (Solutions, Services)

Accenture Plc, Applitools Ltd., Broadcom Inc., BrowserStack Inc., Capgemini SE, Cognizant Technology Solution, Hexaware Technologies Ltd., IBM Corp., Infosys Ltd., Katalon Inc., Keysight Technologies Inc., LambdaTest, Microsoft Corp., Open Text Corp., Oracle Corp., Perforce Software Inc., QualiTest Group, SmartBear Software Inc., Tata Consultancy Services, Wipro Ltd. are a few of the key vendors in the Automation Testing market.

North America will register the highest growth rate of 42.2% among the other regions. Therefore, the Automation Testing market in North America is expected to garner significant business opportunities for the vendors during the forecast period.

US, Canada, Mexico, Germany, UK, France, Italy, Spain, The Netherlands, China, India, Japan, South Korea, Australia, Indonesia, Brazil, Argentina, Chile, Saudi Arabia, UAE, Israel, South Africa, Turkey

  • Accelerating enterprise adoption of agile and DevOps frameworks driving continuous testing is the driving factor this market.

The Automation Testing market vendors should focus on grabbing business opportunities from the End-user segment as it accounted for the largest market share in the base year.
RIA - Research AI Assistant
Ask RIA
