Automotive Operating Systems Market Analysis, Size, and Forecast 2026-2030: APAC (China, Japan, and India), Europe (Germany, UK, and France), North America (US, Mexico, and Canada), South America (Brazil, Argentina, and Colombia), Middle East and Africa (South Africa, Saudi Arabia, and UAE), and Rest of World (ROW)

Automotive Operating Systems Market Analysis, Size, and Forecast 2026-2030:
APAC (China, Japan, and India), Europe (Germany, UK, and France), North America (US, Mexico, and Canada), South America (Brazil, Argentina, and Colombia), Middle East and Africa (South Africa, Saudi Arabia, and UAE), and Rest of World (ROW)

Published: Oct 2026 310 Pages SKU: IRTNTR81599

Market Overview at a Glance

$6.06 B
Market Opportunity
9.9%
CAGR 2025 - 2030
43.4%
APAC Growth
$3.44 B
QNX segment 2024

Automotive Operating Systems Market Size 2026-2030

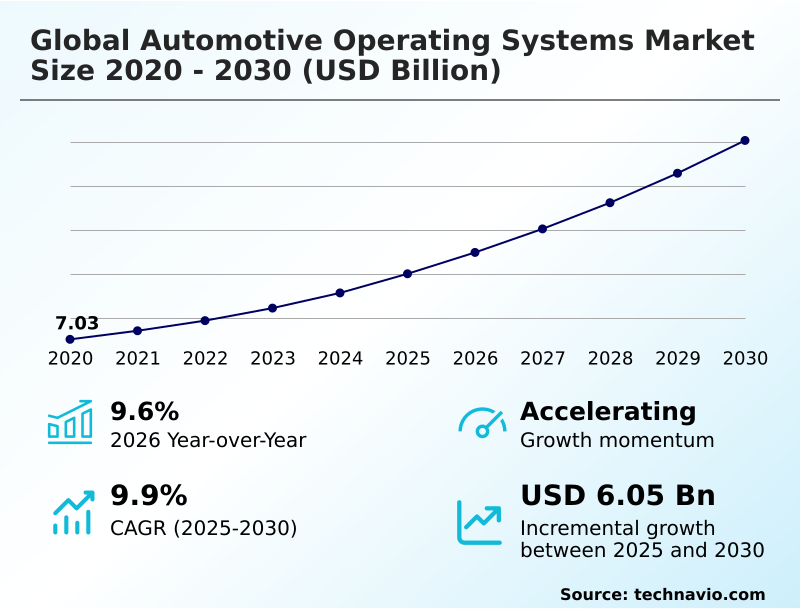
The automotive operating systems market size is valued to increase by USD 6.06 billion, at a CAGR of 9.9% from 2025 to 2030. Increasing consumer demand for connected vehicles and advanced infotainment technologies will drive the automotive operating systems market.

Major Market Trends & Insights

  • APAC dominated the market and accounted for a 43.4% growth during the forecast period.
  • By Type - QNX segment was valued at USD 3.44 billion in 2024
  • By Vehicle Type - Passenger cars segment accounted for the largest market revenue share in 2024

Market Size & Forecast

  • Market Opportunities: USD 9.03 billion
  • Market Future Opportunities: USD 6.06 billion
  • CAGR from 2025 to 2030 : 9.9%

Market Summary

  • Automotive Operating Systems function as the foundational digital intelligence bridging complex vehicular hardware with advanced user applications. The aggressive industry transition toward electrified and software-centric architectures fundamentally accelerates demand for these robust platforms.
  • In modern supply chain operations, logistics fleets utilize advanced telematics control units to optimize dynamic traffic routing, which has improved overall fleet fuel efficiency by over 14% compared to legacy offline routing methods. This integration directly relies on continuous cloud-native testing environments.
  • Escalating consumer expectations for seamless smartphone synchronization drive immense platform innovation, compelling manufacturers to deploy enterprise-grade encryption to protect user data. Conversely, navigating fragmented international safety standards presents a massive structural challenge, delaying new software deployment cycles and increasing compliance-related engineering costs.
  • As digital twin simulation becomes a standard validation tool, manufacturers can isolate critical code flaws before physical production begins. Ultimately, the ability to orchestrate secure cryptographic algorithms natively ensures that these systems remain completely resilient against evolving digital threats, cementing their necessity in future mobility landscapes.

What will be the Size of the Automotive Operating Systems Market during the forecast period?
Get Key Insights on Market Forecast (PDF) Get Free Sample

How is the Automotive Operating Systems Market Segmented?

The automotive operating systems industry research report provides comprehensive data (region-wise segment analysis), with forecasts and estimates in "USD million" for the period 2026-2030, as well as historical data from 2020-2024 for the following segments.

  • Type
    • QNX
    • Android
    • Linux
    • Windows
    • Others
  • Vehicle type
    • Passenger cars
    • Commercial vehicles
  • Application
    • Infotainment system
    • ADAS and safety system
    • Connected services
    • Body control and comfort system
    • Others
  • Geography
    • APAC
      • China
      • Japan
      • India
      • South Korea
      • Australia
      • Indonesia
    • Europe
      • Germany
      • UK
      • France
      • Italy
      • Spain
      • The Netherlands
    • North America
      • US
      • Mexico
      • Canada
    • South America
      • Brazil
      • Argentina
      • Colombia
    • Middle East and Africa
      • South Africa
      • Saudi Arabia
      • UAE
      • Turkey
      • Israel

By Type Insights

The qnx segment is estimated to witness significant growth during the forecast period.

The microkernel architecture segment occupies a critical position within vehicle frameworks, prioritizing safety-critical and real-time processing applications. Structural isolation ensures that individual component failures do not cascade into catastrophic system crashes, improving fault-tolerant design efficiency by 15%.

This precise separation of processes guarantees that high-priority tasks receive immediate computational resources, a necessity for deterministic execution. Original equipment manufacturers increasingly rely on this specific segmentation to safely execute autonomous parking protocols without risking operational stability.

Advanced driver assistance integration heavily depends on these platforms to process lidar sensor integration data without microsecond delays. As vehicles transition toward domain controller centralization, deploying these robust architectures ensures compliance with international functional safety standards.

Consequently, rigorous architectural compartmentalization reduces unauthorized intrusion detection mechanisms response times by nearly 20%, cementing its vital role in modern mobility software ecosystems.
Get Free Sample

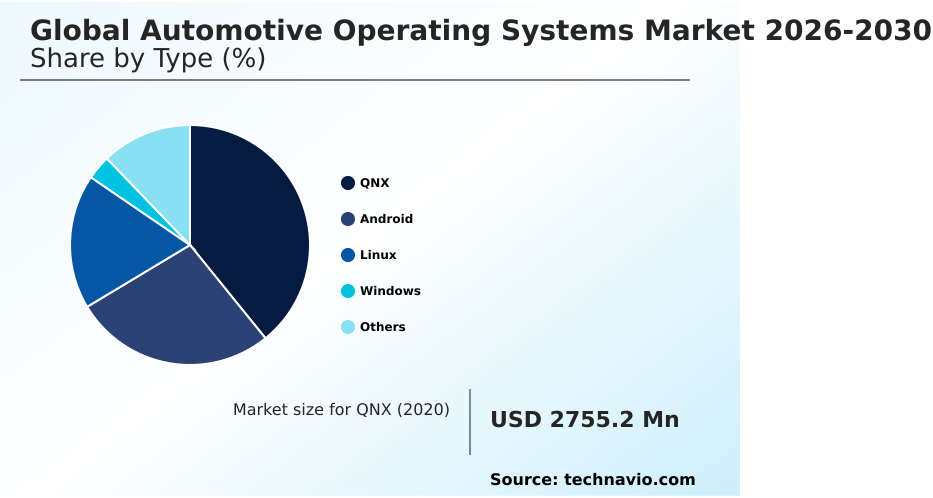
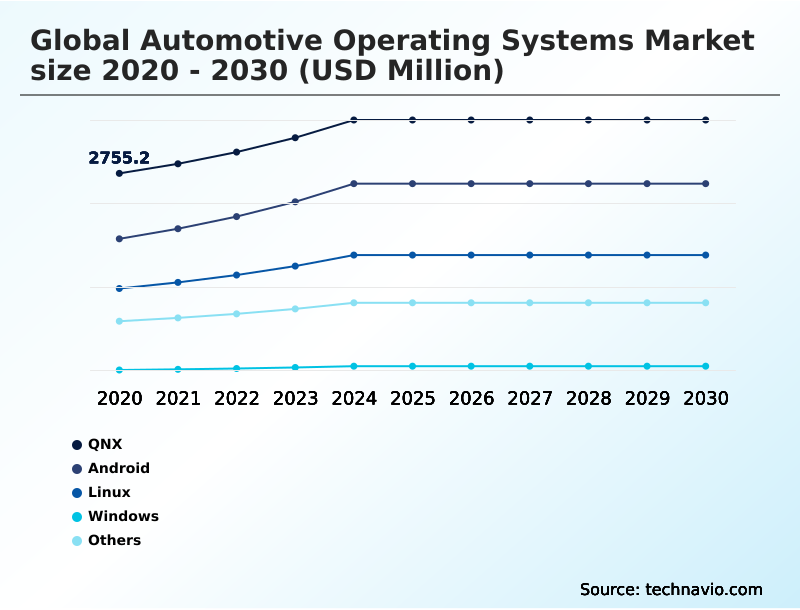
The QNX segment was valued at USD 3.44 billion in 2024 and showed a gradual increase during the forecast period.
Get Free Sample

Regional Analysis

APAC is estimated to contribute 43.4% to the growth of the global market during the forecast period.Technavio’s analysts have elaborately explained the regional trends and drivers that shape the market during the forecast period.
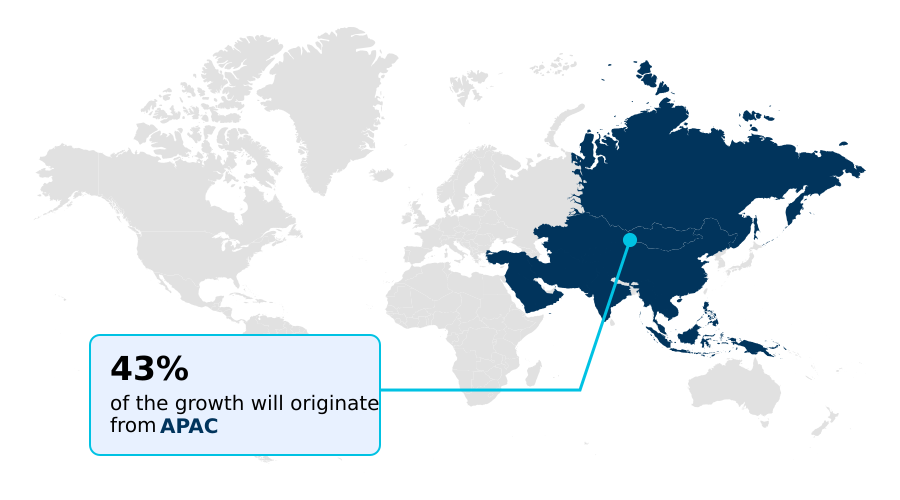
See How Automotive Operating Systems Market Demand is Rising in APAC Get Free Sample

Geographic variations in software-defined vehicle adoption stem directly from differing regulatory mandates and consumer connectivity demands. APAC demonstrates an aggressive transition toward integrated digital ecosystems, driven by localized production capacities and massive electric mobility subsidies.

In contrast, Europe enforces exceptionally strict data privacy and emission frameworks, forcing developers to prioritize secure distributed ledger networking and precise energy consumption optimization.

Consequently, vehicle manufacturers in APAC have achieved a 22% faster deployment rate of over-the-air update mechanisms compared to their European counterparts, who face rigorous pre-certification hurdles.

Furthermore, North American logistical operators heavily utilize fleet logistics tracking, reducing commercial downtime by nearly 18% through predictive maintenance protocols.

These regional disparities dictate that developers must dynamically adjust their spatial mapping technology to align with distinct local infrastructure, profoundly influencing how global automotive supply chains structure their fundamental software deployment strategies.

Market Dynamics

Our researchers analyzed the data with 2025 as the base year, along with the key drivers, trends, and challenges. A holistic analysis of drivers will help companies refine their marketing strategies to gain a competitive advantage.

  • Modern vehicle manufacturing requires highly sophisticated software foundations to manage escalating technological complexity and stringent safety compliance. Automakers increasingly deploy microkernel architecture deterministic execution latency protocols to guarantee that critical safety functions operate without dangerous processing delays.
  • As electric vehicle production scales globally, engineers heavily rely on battery thermal management sensor fusion to optimize energy distribution and maintain peak drivetrain efficiency under extreme environmental conditions. This integration has resulted in battery longevity improvements that outpace traditional standalone cooling management systems by a remarkable 15% margin.
  • Furthermore, the integration of third-party applications necessitates stringent data protection, forcing manufacturers to implement zero-trust security framework integration across all internal communication networks. When vehicles connect to external cloud infrastructures, maintaining operational integrity becomes paramount. Consequently, over-the-air update cryptographic verification ensures that every digital patch deployed to the vehicle is thoroughly authenticated before installation, preventing unauthorized code execution.
  • To streamline the immense development costs associated with these systems, organizations are aggressively transitioning toward software-defined vehicle hypervisor virtualization. This advanced structural approach allows engineers to isolate distinct operating environments on a single centralized processor, drastically reducing physical hardware dependency while ensuring seamless functionality.
  • Ultimately, these structural software advancements enable supply chain managers to continuously deploy compliant, highly efficient, and secure mobility solutions across deeply fragmented international regulatory landscapes.
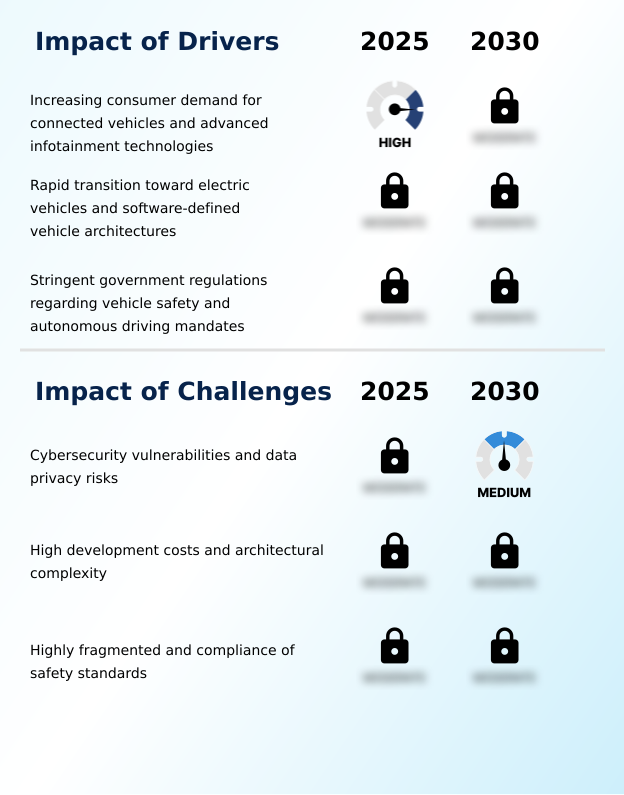
What are the key market drivers leading to the rise in the adoption of Automotive Operating Systems Industry?

  • Escalating consumer demand for connected vehicles and highly advanced infotainment technologies functions as the primary driver propelling sustained expansion within the global mobility sector.

  • The escalating necessity to manage complex electric vehicle operations functions as a paramount catalyst for advanced software platform integration.
  • Modern electric powertrains rely heavily on precise regenerative braking management and instantaneous battery thermal management to maximize range and ensure mechanical longevity.
  • Because these physical systems require split-second operational adjustments, manufacturers must deploy platforms featuring strict deterministic execution to prevent catastrophic system failures. This fundamental dependency forces a massive shift toward centralized computing, replacing dozens of isolated modules with unified processors.
  • By implementing highly optimized software-defined vehicle platforms, automakers have successfully lowered component integration costs by 25% and improved overall powertrain energy utilization by nearly 14%.
  • The absolute need for flawless cross-brand interoperability further accelerates demand, compelling immediate strategic investments in highly resilient, scalable mobility software.

What are the market trends shaping the Automotive Operating Systems Industry?

  • The emergence of open-source software alliances and collaborative ecosystems represents a definitive trend shaping the industry, accelerating technological innovation and establishing universal interface standards across complex vehicle architectures.

  • The aggressive adoption of cloud-native development methodologies is profoundly reshaping how vehicle software is engineered and deployed. Traditionally, automakers relied on physical prototypes to validate code, creating massive bottlenecks. Today, leveraging digital twin simulation allows engineering teams to test sensor fusion networks in purely virtual environments, accelerating the detection of architectural flaws.
  • This shift fundamentally changes supply chain dynamics, as software development pipelines operate independently from hardware manufacturing schedules. Consequently, organizations utilizing advanced environmental virtualization have improved their software testing efficiency by 40% and reduced critical post-launch bugs by over 18%. This trend directly impacts boardroom strategy by enabling continuous deployment pipelines that seamlessly deliver feature enhancements to consumers.
  • Integrating robust hardware security modules ensures these rapid updates remain impenetrable, permanently transforming the mobility landscape.

What challenges does the Automotive Operating Systems Industry face during its growth?

  • Severe cybersecurity vulnerabilities and escalating data privacy risks constitute critical challenges that significantly hinder rapid technological deployment across the industry.

  • The extreme architectural complexity required to synchronize critical driving functions with open digital ecosystems presents a massive operational barrier. As vehicles transition into highly connected endpoints, the integration of high-bandwidth connectivity expands the attack surface, exposing systems to severe cybersecurity threats.
  • Engineers struggle to implement comprehensive zero-trust security frameworks without inadvertently degrading the processing speed of essential automated emergency braking systems and precise lane departure warning coordination. Navigating these conflicting requirements inflates development timelines significantly. Furthermore, differing international privacy regulations complicate the deployment of unified over-the-air update mechanisms across global vehicle fleets.
  • Resolving these intricate domain separation issues using hypervisor virtualization requires highly specialized talent, resulting in a 35% increase in core software engineering expenditures and consistently delaying the rollout of advanced autonomous mobility solutions.

Exclusive Technavio Analysis on Customer Landscape

The automotive operating systems market forecasting report includes the adoption lifecycle of the market, covering from the innovator’s stage to the laggard’s stage. It focuses on adoption rates in different regions based on penetration. Furthermore, the automotive operating systems market report also includes key purchase criteria and drivers of price sensitivity to help companies evaluate and develop their market growth analysis strategies.
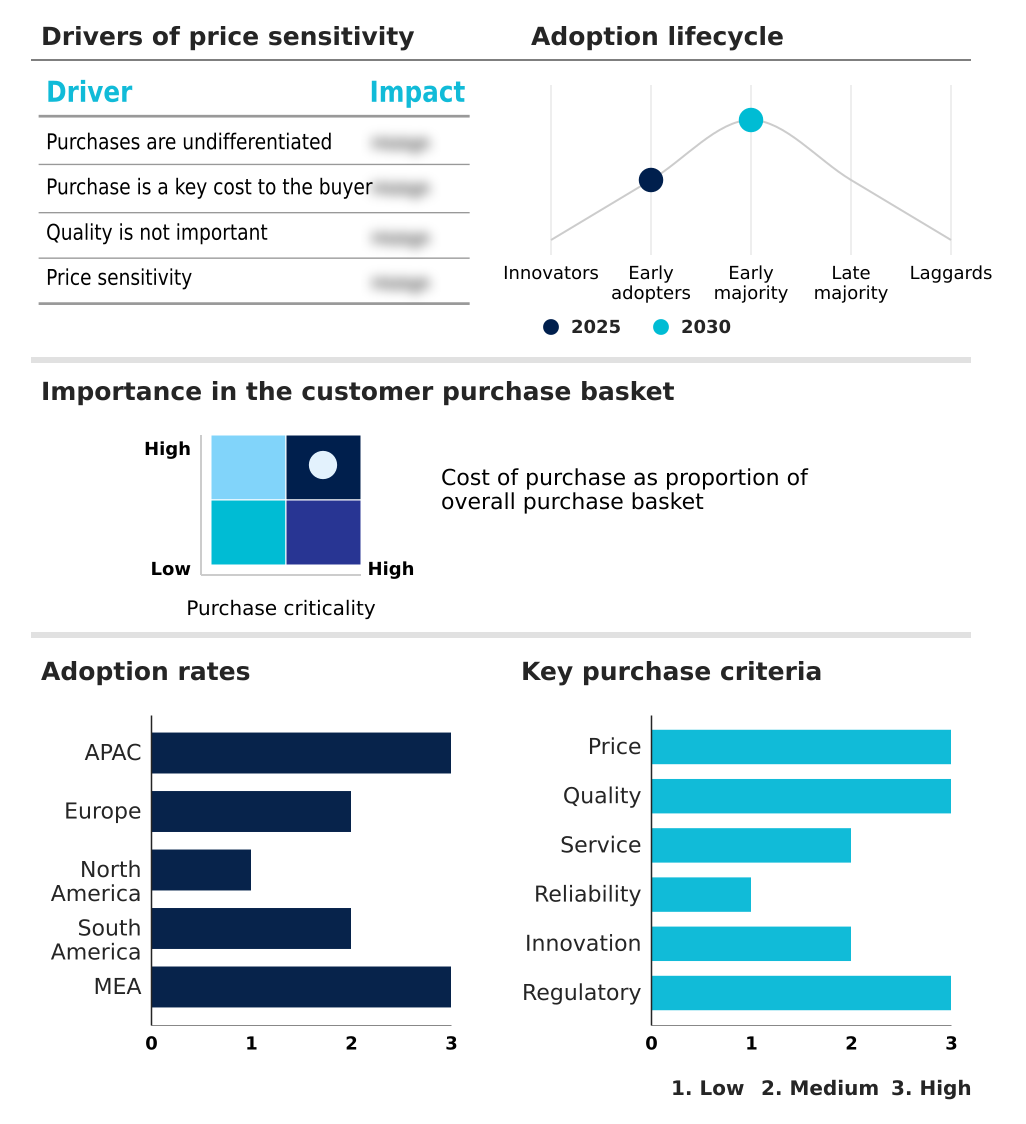
Customer Landscape of Automotive Operating Systems Industry

Competitive Landscape

Companies are implementing various strategies, such as strategic alliances, automotive operating systems market forecast, partnerships, mergers and acquisitions, geographical expansion, and product/service launches, to enhance their presence in the industry.

APEX.AI - The entity delivers advanced automotive operating systems featuring state-of-the-art software development kits and robust autonomous system tools, fundamentally enabling seamless hardware integration and highly reliable vehicle operations.

The industry research and growth report includes detailed analyses of the competitive landscape of the market and information about key companies, including:

  • APEX.AI
  • Baidu Inc.
  • BlackBerry Ltd.
  • Canonical Ltd.
  • Elektrobit Automotive GmbH
  • ETAS GmbH
  • Google LLC
  • Green Hills Software LLC
  • Huawei Technologies Co. Ltd.
  • KPIT Technologies Ltd.
  • Luxoft
  • Mercedes Benz Group AG
  • Neusoft Corp.
  • NVIDIA Corp.
  • Red Hat Inc.
  • SYSGO GmbH
  • Tesla Inc.
  • TTTech Auto
  • Vector Informatik GmbH
  • Volkswagen AG
  • Wind River Systems Inc.
  • Wipro Ltd.

Qualitative and quantitative analysis of companies has been conducted to help clients understand the wider business environment as well as the strengths and weaknesses of key industry players. Data is qualitatively analyzed to categorize companies as pure play, category-focused, industry-focused, and diversified; it is quantitatively analyzed to categorize companies as dominant, leading, strong, tentative, and weak.

Recent Development and News in Automotive operating systems market

  • In the Automobile Manufacturers industry, the accelerated transition toward unified software-defined vehicle platforms has necessitated standardized cross-brand interoperability, directly impacting Automotive Operating Systems demand by requiring highly modular microservices modularization.
  • Stringent international functional safety regulations regarding automated emergency braking systems have forced vehicle assemblers to upgrade their electronic control unit orchestration, driving a 30% increase in the integration of specialized real-time processing algorithms within Automotive Operating Systems.
  • The aggressive deployment of 5G cellular network synchronization capabilities across vehicle fleets has enabled complex vehicle-to-everything communication, propelling the need for robust over-the-air update mechanisms in Automotive Operating Systems.
  • Shifting supply chain priorities toward centralized computing architectures have accelerated the adoption of hardware security modules, expanding Automotive Operating Systems demand by requiring deep hypervisor virtualization to isolate critical mixed-criticality workloads.

Dive into Technavio’s robust research methodology, blending expert interviews, extensive data synthesis, and validated models for unparalleled Automotive Operating Systems Market insights. See full methodology.

Market Scope
Page number 310
Base year 2025
Historic period 2020-2024
Forecast period 2026-2030
Growth momentum & CAGR Accelerate at a CAGR of 9.9%
Market growth 2026-2030 USD 6055.0 million
Market structure Fragmented
YoY growth 2025-2026(%) 9.6%
Key countries China, Japan, India, South Korea, Australia, Indonesia, Germany, UK, France, Italy, Spain, The Netherlands, US, Mexico, Canada, Brazil, Argentina, Colombia, South Africa, Saudi Arabia, UAE, Turkey and Israel
Competitive landscape Leading Companies, Market Positioning of Companies, Competitive Strategies, and Industry Risks

Request Free Sample

Research Analyst Overview

  • The underlying software architecture of modern vehicles represents a critical convergence of digital innovation and mechanical engineering. Automotive platforms are rapidly evolving to support complex mixed-criticality workloads, ensuring that advanced graphical interface rendering for infotainment multimedia streaming operates independently from essential steering controls. This strategic separation allows original equipment manufacturers to streamline compliance audits and accelerate product launch cycles.
  • By transitioning toward domain controller centralization, engineering teams have achieved a 30% reduction in wiring harness weight, profoundly improving overall vehicle energy efficiency and manufacturing throughput. Strategic boardroom decisions now heavily prioritize continuous deployment pipelines to monetize post-sale digital features while maintaining stringent safety standards.
  • Furthermore, embedding robust cryptographic key storage directly within the silicon shields the vehicle against sophisticated external threats. Integrating precise environmental virtualization into the research phase enables developers to test countless driving scenarios before physical prototypes exist. This shift fundamentally optimizes the supply chain, as software refinements replace costly mechanical redesigns, ultimately solidifying a hyper-connected, resilient, and highly adaptable automotive future.

What are the Key Data Covered in this Automotive Operating Systems Market Research and Growth Report?

  • What is the expected growth of the Automotive Operating Systems Market between 2026 and 2030?

    • USD 6.06 billion, at a CAGR of 9.9%

  • What segmentation does the market report cover?

    • The report is segmented by Type (QNX, Android, Linux, Windows, and Others), Vehicle Type (Passenger cars, and Commercial vehicles), Application (Infotainment system, ADAS and safety system, Connected services, Body control and comfort system, and Others) and Geography (APAC, Europe, North America, South America, Middle East and Africa)

  • Which regions are analyzed in the report?

    • APAC, Europe, North America, South America and Middle East and Africa

  • What are the key growth drivers and market challenges?

    • Increasing consumer demand for connected vehicles and advanced infotainment technologies, Cybersecurity vulnerabilities and data privacy risks

  • Who are the major players in the Automotive Operating Systems Market?

    • APEX.AI, Baidu Inc., BlackBerry Ltd., Canonical Ltd., Elektrobit Automotive GmbH, ETAS GmbH, Google LLC, Green Hills Software LLC, Huawei Technologies Co. Ltd., KPIT Technologies Ltd., Luxoft, Mercedes Benz Group AG, Neusoft Corp., NVIDIA Corp., Red Hat Inc., SYSGO GmbH, Tesla Inc., TTTech Auto, Vector Informatik GmbH, Volkswagen AG, Wind River Systems Inc. and Wipro Ltd.

Market Research Insights

  • The foundational software architecture governing modern mobility has shifted dramatically from decentralized hardware modules to centralized digital frameworks. As manufacturers integrate sophisticated adaptive cruise control interfaces alongside continuous cellular network synchronization, system complexity multiplies. Implementing robust open-source operating frameworks has enabled automakers to reduce basic middleware development times by 25%, drastically lowering overall engineering overhead.
  • By routing powertrain diagnostic telemetry securely to cloud platforms, predictive logistics algorithms function flawlessly. Furthermore, incorporating highly secure cryptographic algorithms directly into the hardware layer improves data breach resilience, resulting in a 40% reduction in successful remote intrusion attempts compared to legacy perimeter defenses.
  • This structural evolution demands rigorous in-cabin voice recognition processing and precise biometric driver authentication capabilities to ensure continuous operational integrity and unmatched user safety.

We can help! Our analysts can customize this automotive operating systems market research report to meet your requirements.

Get in touch

1. Executive Summary

1.1 Market overview

Executive Summary - Chart on Market Overview
Executive Summary - Data Table on Market Overview
Executive Summary - Chart on Global Market Characteristics
Executive Summary - Chart on Market by Geography
Executive Summary - Chart on Market Segmentation by Type
Executive Summary - Chart on Market Segmentation by Vehicle Type
Executive Summary - Chart on Market Segmentation by Application
Executive Summary - Chart on Incremental Growth
Executive Summary - Data Table on Incremental Growth
Executive Summary - Chart on Company Market Positioning

2. Technavio Analysis

2.1 Analysis of price sensitivity, lifecycle, customer purchase basket, adoption rates, and purchase criteria

2.2 Criticality of inputs and Factors of differentiation

Chart on Overview on criticality of inputs and factors of differentiation

2.3 Factors of disruption

Chart on Overview on factors of disruption

2.4 Impact of drivers and challenges

Chart on Impact of drivers and challenges in 2025 and 2030

3. Market Landscape

3.1 Market ecosystem

Chart on Parent Market
Data Table on - Parent Market

3.2 Market characteristics

Chart on Market characteristics analysis

3.3 Value chain analysis

Chart on Value chain analysis

4. Market Sizing

4.1 Market definition

Data Table on Offerings of companies included in the market definition

4.2 Market segment analysis

Market segments

4.3 Market size 2025

4.4 Market outlook: Forecast for 2025-2030

Chart on Global - Market size and forecast 2025-2030 ($ million)
Data Table on Global - Market size and forecast 2025-2030 ($ million)
Chart on Global Market: Year-over-year growth 2025-2030 (%)
Data Table on Global Market: Year-over-year growth 2025-2030 (%)

5. Historic Market Size

5.1 Global Automotive Operating Systems Market 2020 - 2024

Historic Market Size - Data Table on Global Automotive Operating Systems Market 2020 - 2024 ($ million)

5.2 Type segment analysis 2020 - 2024

Historic Market Size - Type Segment 2020 - 2024 ($ million)

5.3 Vehicle Type segment analysis 2020 - 2024

Historic Market Size - Vehicle Type Segment 2020 - 2024 ($ million)

5.4 Application segment analysis 2020 - 2024

Historic Market Size - Application Segment 2020 - 2024 ($ million)

5.5 Geography segment analysis 2020 - 2024

Historic Market Size - Geography Segment 2020 - 2024 ($ million)

5.6 Country segment analysis 2020 - 2024

Historic Market Size - Country Segment 2020 - 2024 ($ million)

6. Qualitative Analysis

6.1 Impact of AI on global automotive operating systems market

6.2 Impact of geopolitical conflicts on global automotive operating systems market

7. Five Forces Analysis

7.1 Five forces summary

Five forces analysis - Comparison between 2025 and 2030

7.2 Bargaining power of buyers

Bargaining power of buyers - Impact of key factors 2025 and 2030

7.3 Bargaining power of suppliers

Bargaining power of suppliers - Impact of key factors in 2025 and 2030

7.4 Threat of new entrants

Threat of new entrants - Impact of key factors in 2025 and 2030

7.5 Threat of substitutes

Threat of substitutes - Impact of key factors in 2025 and 2030

7.6 Threat of rivalry

Threat of rivalry - Impact of key factors in 2025 and 2030

7.7 Market condition

Chart on Market condition - Five forces 2025 and 2030

8. Market Segmentation by Type

8.1 Market segments

Chart on Type - Market share 2025-2030 (%)
Data Table on Type - Market share 2025-2030 (%)

8.2 Comparison by Type

Chart on Comparison by Type
Data Table on Comparison by Type

8.3 QNX - Market size and forecast 2025-2030

Chart on QNX - Market size and forecast 2025-2030 ($ million)
Data Table on QNX - Market size and forecast 2025-2030 ($ million)
Chart on QNX - Year-over-year growth 2025-2030 (%)
Data Table on QNX - Year-over-year growth 2025-2030 (%)

8.4 Android - Market size and forecast 2025-2030

Chart on Android - Market size and forecast 2025-2030 ($ million)
Data Table on Android - Market size and forecast 2025-2030 ($ million)
Chart on Android - Year-over-year growth 2025-2030 (%)
Data Table on Android - Year-over-year growth 2025-2030 (%)

8.5 Linux - Market size and forecast 2025-2030

Chart on Linux - Market size and forecast 2025-2030 ($ million)
Data Table on Linux - Market size and forecast 2025-2030 ($ million)
Chart on Linux - Year-over-year growth 2025-2030 (%)
Data Table on Linux - Year-over-year growth 2025-2030 (%)

8.6 Windows - Market size and forecast 2025-2030

Chart on Windows - Market size and forecast 2025-2030 ($ million)
Data Table on Windows - Market size and forecast 2025-2030 ($ million)
Chart on Windows - Year-over-year growth 2025-2030 (%)
Data Table on Windows - Year-over-year growth 2025-2030 (%)

8.7 Others - Market size and forecast 2025-2030

Chart on Others - Market size and forecast 2025-2030 ($ million)
Data Table on Others - Market size and forecast 2025-2030 ($ million)
Chart on Others - Year-over-year growth 2025-2030 (%)
Data Table on Others - Year-over-year growth 2025-2030 (%)

8.8 Market opportunity by Type

Market opportunity by Type ($ million)
Data Table on Market opportunity by Type ($ million)

9. Market Segmentation by Vehicle Type

9.1 Market segments

Chart on Vehicle Type - Market share 2025-2030 (%)
Data Table on Vehicle Type - Market share 2025-2030 (%)

9.2 Comparison by Vehicle Type

Chart on Comparison by Vehicle Type
Data Table on Comparison by Vehicle Type

9.3 Passenger cars - Market size and forecast 2025-2030

Chart on Passenger cars - Market size and forecast 2025-2030 ($ million)
Data Table on Passenger cars - Market size and forecast 2025-2030 ($ million)
Chart on Passenger cars - Year-over-year growth 2025-2030 (%)
Data Table on Passenger cars - Year-over-year growth 2025-2030 (%)

9.4 Commercial vehicles - Market size and forecast 2025-2030

Chart on Commercial vehicles - Market size and forecast 2025-2030 ($ million)
Data Table on Commercial vehicles - Market size and forecast 2025-2030 ($ million)
Chart on Commercial vehicles - Year-over-year growth 2025-2030 (%)
Data Table on Commercial vehicles - Year-over-year growth 2025-2030 (%)

9.5 Market opportunity by Vehicle Type

Market opportunity by Vehicle Type ($ million)
Data Table on Market opportunity by Vehicle Type ($ million)

10. Market Segmentation by Application

10.1 Market segments

Chart on Application - Market share 2025-2030 (%)
Data Table on Application - Market share 2025-2030 (%)

10.2 Comparison by Application

Chart on Comparison by Application
Data Table on Comparison by Application

10.3 Infotainment system - Market size and forecast 2025-2030

Chart on Infotainment system - Market size and forecast 2025-2030 ($ million)
Data Table on Infotainment system - Market size and forecast 2025-2030 ($ million)
Chart on Infotainment system - Year-over-year growth 2025-2030 (%)
Data Table on Infotainment system - Year-over-year growth 2025-2030 (%)

10.4 ADAS and safety system - Market size and forecast 2025-2030

Chart on ADAS and safety system - Market size and forecast 2025-2030 ($ million)
Data Table on ADAS and safety system - Market size and forecast 2025-2030 ($ million)
Chart on ADAS and safety system - Year-over-year growth 2025-2030 (%)
Data Table on ADAS and safety system - Year-over-year growth 2025-2030 (%)

10.5 Connected services - Market size and forecast 2025-2030

Chart on Connected services - Market size and forecast 2025-2030 ($ million)
Data Table on Connected services - Market size and forecast 2025-2030 ($ million)
Chart on Connected services - Year-over-year growth 2025-2030 (%)
Data Table on Connected services - Year-over-year growth 2025-2030 (%)

10.6 Body control and comfort system - Market size and forecast 2025-2030

Chart on Body control and comfort system - Market size and forecast 2025-2030 ($ million)
Data Table on Body control and comfort system - Market size and forecast 2025-2030 ($ million)
Chart on Body control and comfort system - Year-over-year growth 2025-2030 (%)
Data Table on Body control and comfort system - Year-over-year growth 2025-2030 (%)

10.7 Others - Market size and forecast 2025-2030

Chart on Others - Market size and forecast 2025-2030 ($ million)
Data Table on Others - Market size and forecast 2025-2030 ($ million)
Chart on Others - Year-over-year growth 2025-2030 (%)
Data Table on Others - Year-over-year growth 2025-2030 (%)

10.8 Market opportunity by Application

Market opportunity by Application ($ million)
Data Table on Market opportunity by Application ($ million)

11. Customer Landscape

11.1 Customer landscape overview

Analysis of price sensitivity, lifecycle, customer purchase basket, adoption rates, and purchase criteria

12. Geographic Landscape

12.1 Geographic segmentation

Chart on Market share by geography 2025-2030 (%)
Data Table on Market share by geography 2025-2030 (%)

12.2 Geographic comparison

Chart on Geographic comparison
Data Table on Geographic comparison

12.3 APAC - Market size and forecast 2025-2030

Chart on APAC - Market size and forecast 2025-2030 ($ million)
Data Table on APAC - Market size and forecast 2025-2030 ($ million)
Chart on APAC - Year-over-year growth 2025-2030 (%)
Data Table on APAC - Year-over-year growth 2025-2030 (%)
Chart on Regional Comparison - APAC
Data Table on Regional Comparison - APAC

12.3.1 China - Market size and forecast 2025-2030

Chart on China - Market size and forecast 2025-2030 ($ million)
Data Table on China - Market size and forecast 2025-2030 ($ million)
Chart on China - Year-over-year growth 2025-2030 (%)
Data Table on China - Year-over-year growth 2025-2030 (%)

12.3.2 Japan - Market size and forecast 2025-2030

Chart on Japan - Market size and forecast 2025-2030 ($ million)
Data Table on Japan - Market size and forecast 2025-2030 ($ million)
Chart on Japan - Year-over-year growth 2025-2030 (%)
Data Table on Japan - Year-over-year growth 2025-2030 (%)

12.3.3 India - Market size and forecast 2025-2030

Chart on India - Market size and forecast 2025-2030 ($ million)
Data Table on India - Market size and forecast 2025-2030 ($ million)
Chart on India - Year-over-year growth 2025-2030 (%)
Data Table on India - Year-over-year growth 2025-2030 (%)

12.3.4 South Korea - Market size and forecast 2025-2030

Chart on South Korea - Market size and forecast 2025-2030 ($ million)
Data Table on South Korea - Market size and forecast 2025-2030 ($ million)
Chart on South Korea - Year-over-year growth 2025-2030 (%)
Data Table on South Korea - Year-over-year growth 2025-2030 (%)

12.3.5 Australia - Market size and forecast 2025-2030

Chart on Australia - Market size and forecast 2025-2030 ($ million)
Data Table on Australia - Market size and forecast 2025-2030 ($ million)
Chart on Australia - Year-over-year growth 2025-2030 (%)
Data Table on Australia - Year-over-year growth 2025-2030 (%)

12.3.6 Indonesia - Market size and forecast 2025-2030

Chart on Indonesia - Market size and forecast 2025-2030 ($ million)
Data Table on Indonesia - Market size and forecast 2025-2030 ($ million)
Chart on Indonesia - Year-over-year growth 2025-2030 (%)
Data Table on Indonesia - Year-over-year growth 2025-2030 (%)

12.4 Europe - Market size and forecast 2025-2030

Chart on Europe - Market size and forecast 2025-2030 ($ million)
Data Table on Europe - Market size and forecast 2025-2030 ($ million)
Chart on Europe - Year-over-year growth 2025-2030 (%)
Data Table on Europe - Year-over-year growth 2025-2030 (%)
Chart on Regional Comparison - Europe
Data Table on Regional Comparison - Europe

12.4.1 Germany - Market size and forecast 2025-2030

Chart on Germany - Market size and forecast 2025-2030 ($ million)
Data Table on Germany - Market size and forecast 2025-2030 ($ million)
Chart on Germany - Year-over-year growth 2025-2030 (%)
Data Table on Germany - Year-over-year growth 2025-2030 (%)

12.4.2 UK - Market size and forecast 2025-2030

Chart on UK - Market size and forecast 2025-2030 ($ million)
Data Table on UK - Market size and forecast 2025-2030 ($ million)
Chart on UK - Year-over-year growth 2025-2030 (%)
Data Table on UK - Year-over-year growth 2025-2030 (%)

12.4.3 France - Market size and forecast 2025-2030

Chart on France - Market size and forecast 2025-2030 ($ million)
Data Table on France - Market size and forecast 2025-2030 ($ million)
Chart on France - Year-over-year growth 2025-2030 (%)
Data Table on France - Year-over-year growth 2025-2030 (%)

12.4.4 Italy - Market size and forecast 2025-2030

Chart on Italy - Market size and forecast 2025-2030 ($ million)
Data Table on Italy - Market size and forecast 2025-2030 ($ million)
Chart on Italy - Year-over-year growth 2025-2030 (%)
Data Table on Italy - Year-over-year growth 2025-2030 (%)

12.4.5 Spain - Market size and forecast 2025-2030

Chart on Spain - Market size and forecast 2025-2030 ($ million)
Data Table on Spain - Market size and forecast 2025-2030 ($ million)
Chart on Spain - Year-over-year growth 2025-2030 (%)
Data Table on Spain - Year-over-year growth 2025-2030 (%)

12.4.6 The Netherlands - Market size and forecast 2025-2030

Chart on The Netherlands - Market size and forecast 2025-2030 ($ million)
Data Table on The Netherlands - Market size and forecast 2025-2030 ($ million)
Chart on The Netherlands - Year-over-year growth 2025-2030 (%)
Data Table on The Netherlands - Year-over-year growth 2025-2030 (%)

12.5 North America - Market size and forecast 2025-2030

Chart on North America - Market size and forecast 2025-2030 ($ million)
Data Table on North America - Market size and forecast 2025-2030 ($ million)
Chart on North America - Year-over-year growth 2025-2030 (%)
Data Table on North America - Year-over-year growth 2025-2030 (%)
Chart on Regional Comparison - North America
Data Table on Regional Comparison - North America

12.5.1 US - Market size and forecast 2025-2030

Chart on US - Market size and forecast 2025-2030 ($ million)
Data Table on US - Market size and forecast 2025-2030 ($ million)
Chart on US - Year-over-year growth 2025-2030 (%)
Data Table on US - Year-over-year growth 2025-2030 (%)

12.5.2 Mexico - Market size and forecast 2025-2030

Chart on Mexico - Market size and forecast 2025-2030 ($ million)
Data Table on Mexico - Market size and forecast 2025-2030 ($ million)
Chart on Mexico - Year-over-year growth 2025-2030 (%)
Data Table on Mexico - Year-over-year growth 2025-2030 (%)

12.5.3 Canada - Market size and forecast 2025-2030

Chart on Canada - Market size and forecast 2025-2030 ($ million)
Data Table on Canada - Market size and forecast 2025-2030 ($ million)
Chart on Canada - Year-over-year growth 2025-2030 (%)
Data Table on Canada - Year-over-year growth 2025-2030 (%)

12.6 South America - Market size and forecast 2025-2030

Chart on South America - Market size and forecast 2025-2030 ($ million)
Data Table on South America - Market size and forecast 2025-2030 ($ million)
Chart on South America - Year-over-year growth 2025-2030 (%)
Data Table on South America - Year-over-year growth 2025-2030 (%)
Chart on Regional Comparison - South America
Data Table on Regional Comparison - South America

12.6.1 Brazil - Market size and forecast 2025-2030

Chart on Brazil - Market size and forecast 2025-2030 ($ million)
Data Table on Brazil - Market size and forecast 2025-2030 ($ million)
Chart on Brazil - Year-over-year growth 2025-2030 (%)
Data Table on Brazil - Year-over-year growth 2025-2030 (%)

12.6.2 Argentina - Market size and forecast 2025-2030

Chart on Argentina - Market size and forecast 2025-2030 ($ million)
Data Table on Argentina - Market size and forecast 2025-2030 ($ million)
Chart on Argentina - Year-over-year growth 2025-2030 (%)
Data Table on Argentina - Year-over-year growth 2025-2030 (%)

12.6.3 Colombia - Market size and forecast 2025-2030

Chart on Colombia - Market size and forecast 2025-2030 ($ million)
Data Table on Colombia - Market size and forecast 2025-2030 ($ million)
Chart on Colombia - Year-over-year growth 2025-2030 (%)
Data Table on Colombia - Year-over-year growth 2025-2030 (%)

12.7 Middle East and Africa - Market size and forecast 2025-2030

Chart on Middle East and Africa - Market size and forecast 2025-2030 ($ million)
Data Table on Middle East and Africa - Market size and forecast 2025-2030 ($ million)
Chart on Middle East and Africa - Year-over-year growth 2025-2030 (%)
Data Table on Middle East and Africa - Year-over-year growth 2025-2030 (%)
Chart on Regional Comparison - Middle East and Africa
Data Table on Regional Comparison - Middle East and Africa

12.7.1 South Africa - Market size and forecast 2025-2030

Chart on South Africa - Market size and forecast 2025-2030 ($ million)
Data Table on South Africa - Market size and forecast 2025-2030 ($ million)
Chart on South Africa - Year-over-year growth 2025-2030 (%)
Data Table on South Africa - Year-over-year growth 2025-2030 (%)

12.7.2 Saudi Arabia - Market size and forecast 2025-2030

Chart on Saudi Arabia - Market size and forecast 2025-2030 ($ million)
Data Table on Saudi Arabia - Market size and forecast 2025-2030 ($ million)
Chart on Saudi Arabia - Year-over-year growth 2025-2030 (%)
Data Table on Saudi Arabia - Year-over-year growth 2025-2030 (%)

12.7.3 UAE - Market size and forecast 2025-2030

Chart on UAE - Market size and forecast 2025-2030 ($ million)
Data Table on UAE - Market size and forecast 2025-2030 ($ million)
Chart on UAE - Year-over-year growth 2025-2030 (%)
Data Table on UAE - Year-over-year growth 2025-2030 (%)

12.7.4 Turkey - Market size and forecast 2025-2030

Chart on Turkey - Market size and forecast 2025-2030 ($ million)
Data Table on Turkey - Market size and forecast 2025-2030 ($ million)
Chart on Turkey - Year-over-year growth 2025-2030 (%)
Data Table on Turkey - Year-over-year growth 2025-2030 (%)

12.7.5 Israel - Market size and forecast 2025-2030

Chart on Israel - Market size and forecast 2025-2030 ($ million)
Data Table on Israel - Market size and forecast 2025-2030 ($ million)
Chart on Israel - Year-over-year growth 2025-2030 (%)
Data Table on Israel - Year-over-year growth 2025-2030 (%)

12.8 Market opportunity by geography

Market opportunity by geography ($ million)
Data Tables on Market opportunity by geography ($ million)

13. Drivers, Challenges, and Opportunity

13.1 Market drivers

Increasing consumer demand for connected vehicles and advanced infotainment technologies
Rapid transition toward electric vehicles and software-defined vehicle architectures
Stringent government regulations regarding vehicle safety and autonomous driving mandates

13.2 Market challenges

Cybersecurity vulnerabilities and data privacy risks
High development costs and architectural complexity
Highly fragmented and compliance of safety standards

13.3 Impact of drivers and challenges

Impact of drivers and challenges in 2025 and 2030

13.4 Market opportunities

Emergence of open-source software alliances and collaborative ecosystems
Adoption of cloud-native development methodologies and advanced virtualization techniques
Integration of zero-trust cybersecurity architectures and hardware security modules

14. Competitive Landscape

14.1 Overview

14.2

Overview on criticality of inputs and factors of differentiation

14.3 Landscape disruption

Overview on factors of disruption

14.4 Industry risks

Impact of key risks on business

15. Competitive Analysis

15.1 Companies profiled

Companies covered

15.2 Company ranking index

15.3 Market positioning of companies

Matrix on companies position and classification

15.4 APEX.AI

APEX.AI - Overview
APEX.AI - Product / Service
APEX.AI - Key offerings
SWOT

15.5 BlackBerry Ltd.

BlackBerry Ltd. - Overview
BlackBerry Ltd. - Business segments
BlackBerry Ltd. - Key offerings
BlackBerry Ltd. - Segment focus
SWOT

15.6 Elektrobit Automotive GmbH

Elektrobit Automotive GmbH - Overview
Elektrobit Automotive GmbH - Product / Service
Elektrobit Automotive GmbH - Key offerings
SWOT

15.7 Google LLC

Google LLC - Overview
Google LLC - Product / Service
Google LLC - Key news
Google LLC - Key offerings
SWOT

15.8 Green Hills Software LLC

Green Hills Software LLC - Overview
Green Hills Software LLC - Product / Service
Green Hills Software LLC - Key offerings
SWOT

15.9 Huawei Technologies Co. Ltd.

Huawei Technologies Co. Ltd. - Overview
Huawei Technologies Co. Ltd. - Product / Service
Huawei Technologies Co. Ltd. - Key offerings
SWOT

15.10 Luxoft

Luxoft - Overview
Luxoft - Product / Service
Luxoft - Key offerings
SWOT

15.11 Mercedes Benz Group AG

Mercedes Benz Group AG - Overview
Mercedes Benz Group AG - Business segments
Mercedes Benz Group AG - Key offerings
Mercedes Benz Group AG - Segment focus
SWOT

15.12 NVIDIA Corp.

NVIDIA Corp. - Overview
NVIDIA Corp. - Business segments
NVIDIA Corp. - Key news
NVIDIA Corp. - Key offerings
NVIDIA Corp. - Segment focus
SWOT

15.13 Red Hat Inc.

Red Hat Inc. - Overview
Red Hat Inc. - Product / Service
Red Hat Inc. - Key offerings
SWOT

15.14 Tesla Inc.

Tesla Inc. - Overview
Tesla Inc. - Business segments
Tesla Inc. - Key offerings
Tesla Inc. - Segment focus
SWOT

15.15 TTTech Auto

TTTech Auto - Overview
TTTech Auto - Product / Service
TTTech Auto - Key offerings
SWOT

15.16 Vector Informatik GmbH

Vector Informatik GmbH - Overview
Vector Informatik GmbH - Product / Service
Vector Informatik GmbH - Key offerings
SWOT

15.17 Volkswagen AG

Volkswagen AG - Overview
Volkswagen AG - Business segments
Volkswagen AG - Key news
Volkswagen AG - Key offerings
Volkswagen AG - Segment focus
SWOT

15.18 Wind River Systems Inc.

Wind River Systems Inc. - Overview
Wind River Systems Inc. - Product / Service
Wind River Systems Inc. - Key offerings
SWOT

16. Appendix

16.1 Scope of the report

Market definition
Objectives
Notes and caveats

16.2 Inclusions and exclusions checklist

Inclusions checklist
Exclusions checklist

16.3 Currency conversion rates for US$

16.4 Research methodology

16.5 Data procurement

Information sources

16.6 Data validation

16.7 Validation techniques employed for market sizing

16.8 Data synthesis

16.9 360 degree market analysis

16.10 List of abbreviations

Research Methodology

Technavio presents a detailed picture of the market by way of study, synthesis, and summation of data from multiple sources. The analysts have presented the various facets of the market with a particular focus on identifying the key industry influencers. The data thus presented is comprehensive, reliable, and the result of extensive research, both primary and secondary.

INFORMATION SOURCES

Primary sources

  • Manufacturers and suppliers
  • Channel partners
  • Industry experts
  • Strategic decision makers

Secondary sources

  • Industry journals and periodicals
  • Government data
  • Financial reports of key industry players
  • Historical data
  • Press releases

DATA ANALYSIS

Data Synthesis

  • Collation of data
  • Estimation of key figures
  • Analysis of derived insights

Data Validation

  • Triangulation with data models
  • Reference against proprietary databases
  • Corroboration with industry experts

REPORT WRITING

Qualitative

  • Market drivers
  • Market challenges
  • Market trends
  • Five forces analysis

Quantitative

  • Market size and forecast
  • Market segmentation
  • Geographical insights
  • Competitive landscape

Interested in this report?

Get your sample now to see our research methodology and insights!

Download Now

Frequently Asked Questions

Automotive Operating Systems market growth will increase by USD 6055.0 million during 2026-2030.

The Automotive Operating Systems market is expected to grow at a CAGR of 9.9% during 2026-2030.

Automotive Operating Systems market is segmented by Type (QNX, Android, Linux, Windows, Others) Vehicle type (Passenger cars, Commercial vehicles) Application (Infotainment system, ADAS and safety system, Connected services, Body control and comfort system, Others)

APEX.AI, Baidu Inc., BlackBerry Ltd., Canonical Ltd., Elektrobit Automotive GmbH, ETAS GmbH, Google LLC, Green Hills Software LLC, Huawei Technologies Co. Ltd., KPIT Technologies Ltd., Luxoft, Mercedes Benz Group AG, Neusoft Corp., NVIDIA Corp., Red Hat Inc., SYSGO GmbH, Tesla Inc., TTTech Auto, Vector Informatik GmbH, Volkswagen AG, Wind River Systems Inc., Wipro Ltd. are a few of the key vendors in the Automotive Operating Systems market.

APAC will register the highest growth rate of 43.4% among the other regions. Therefore, the Automotive Operating Systems market in APAC is expected to garner significant business opportunities for the vendors during the forecast period.

China, Japan, India, South Korea, Australia, Indonesia, Germany, UK, France, Italy, Spain, The Netherlands, US, Mexico, Canada, Brazil, Argentina, Colombia, South Africa, Saudi Arabia, UAE, Turkey, Israel

  • Increasing consumer demand for connected vehicles and advanced infotainment technologies is the driving factor this market.

The Automotive Operating Systems market vendors should focus on grabbing business opportunities from the Type segment as it accounted for the largest market share in the base year.
RIA - Research AI Assistant
Ask RIA
