
Automotive Trailer Market Analysis, Size, and Forecast 2026-2030: APAC (China, India, and Japan), Europe (Germany, France, and UK), North America (US, Canada, and Mexico), South America (Brazil, Argentina, and Chile), Middle East and Africa (Saudi Arabia, UAE, and Turkey), and Rest of World (ROW)

Automotive Trailer Market Analysis, Size, and Forecast 2026-2030:
APAC (China, India, and Japan), Europe (Germany, France, and UK), North America (US, Canada, and Mexico), South America (Brazil, Argentina, and Chile), Middle East and Africa (Saudi Arabia, UAE, and Turkey), and Rest of World (ROW)

Published: Oct 2026 302 Pages SKU: IRTNTR71297

Market Overview at a Glance

$8.37 B
Market Opportunity
4.6%
CAGR 2025 - 2030
47.2%
APAC Growth
$11.08 B
Dry trailers segment 2024

Automotive Trailer Market Size 2026-2030

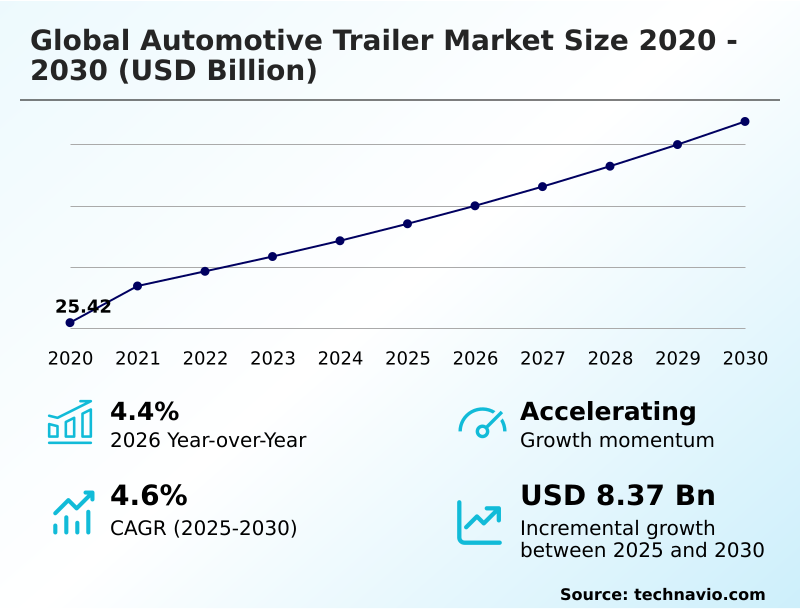
The automotive trailer market size is valued to increase by USD 8.37 billion, at a CAGR of 4.6% from 2025 to 2030. Expansion of electronic commerce and retail logistics will drive the automotive trailer market.

Major Market Trends & Insights

  • APAC dominated the market and accounted for a 47.2% growth during the forecast period.
  • By Type - Dry trailers segment was valued at USD 11.08 billion in 2024
  • By Vehicle Type - Commercial vehicle segment accounted for the largest market revenue share in 2024

Market Size & Forecast

  • Market Opportunities: USD 16.46 billion
  • Market Future Opportunities: USD 8.37 billion
  • CAGR from 2025 to 2030 : 4.6%

Market Summary

  • The Automotive Trailer Market demonstrates robust expansion driven by continuous structural enhancements in international freight mobility and specialized commercial transport infrastructure. The rapid expansion of e-commerce fulfillment networks serves as a primary market driver, compelling fleet operators to acquire advanced enclosed transport units capable of executing high-volume distribution seamlessly.
  • Consequently, logistics providers have increased the integration of aerodynamic modifications, resulting in aerodynamic drag reduction improving fuel efficiency by 18% across long-haul highway routes. A major challenge restricting operational capacity involves the severe volatility in raw material procurement, particularly the fluctuating costs of high-strength aluminum alloys and carbon fiber polymers, which significantly delays manufacturing cycles and compresses profit margins.
  • Supply chain coordinators frequently pivot toward alternative composite materials to maintain uninterrupted production schedules. Furthermore, the rising necessity for temperature-controlled distribution ensures a sustained demand for highly insulated transport solutions. The implementation of strict emission policies pushes manufacturers to integrate kinetic energy recovery systems directly into heavy-duty chassis designs.
  • Fleet modernizations continuously elevate the baseline standards for payload optimization and asset durability.

What will be the Size of the Automotive Trailer Market during the forecast period?
Get Key Insights on Market Forecast (PDF) Get Free Sample

How is the Automotive Trailer Market Segmented?

The automotive trailer industry research report provides comprehensive data (region-wise segment analysis), with forecasts and estimates in "USD million" for the period 2026-2030, as well as historical data from 2020-2024 for the following segments.

  • Type
    • Dry trailers
    • Refrigerated trailer
    • Tank trailer
    • Flatbed trailers
    • Others
  • Vehicle type
    • Commercial vehicle
    • Passenger car
    • Two-wheeler and bicycle
  • Channel
    • OEM
    • Aftermarket
  • Geography
    • APAC
      • China
      • India
      • Japan
      • South Korea
      • Australia
      • Indonesia
    • Europe
      • Germany
      • France
      • UK
      • Italy
      • Spain
      • The Netherlands
    • North America
      • US
      • Canada
      • Mexico
    • South America
      • Brazil
      • Argentina
      • Chile
    • Middle East and Africa
      • Saudi Arabia
      • UAE
      • Turkey
      • South Africa
      • Israel

By Type Insights

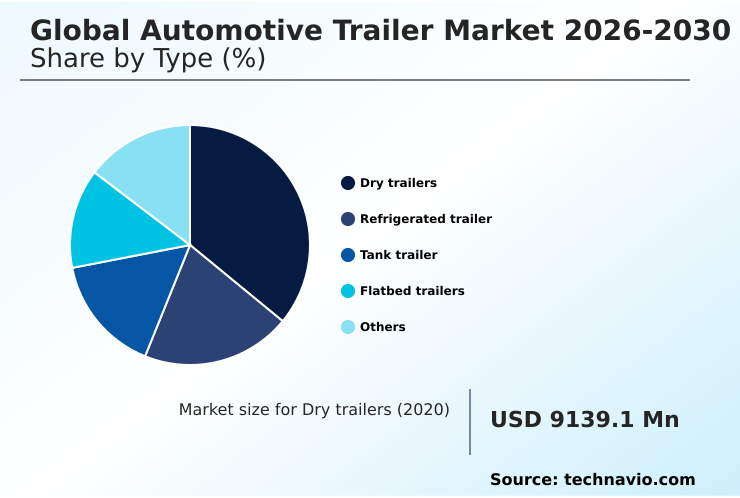
The dry trailers segment is estimated to witness significant growth during the forecast period.

The enclosed freight transport sector forms a critical foundation for modern retail logistics and advanced temperature-controlled distribution. By shielding non-perishable goods from environmental exposure, these units ensure absolute structural integrity and cargo protection during extensive transit operations.

Advanced engineering focuses on unladen weight reduction utilizing advanced carbon fiber polymers, enabling fleet operators to increase maximum allowable payloads without violating strict highway weight limit compliance.

Recent integrations of aerodynamic fairings have optimized operational profiles, resulting in fuel consumption decreasing by up to 14% for towing vehicles during continuous long-haul commercial transit.

Furthermore, the adoption of automated vapor recovery systems inside specialized variants mitigates environmental hazards efficiently. These continuous architectural refinements significantly enhance route efficiency, making enclosed transport indispensable for facilitating seamless mobility across expansive global distribution networks.
Get Free Sample

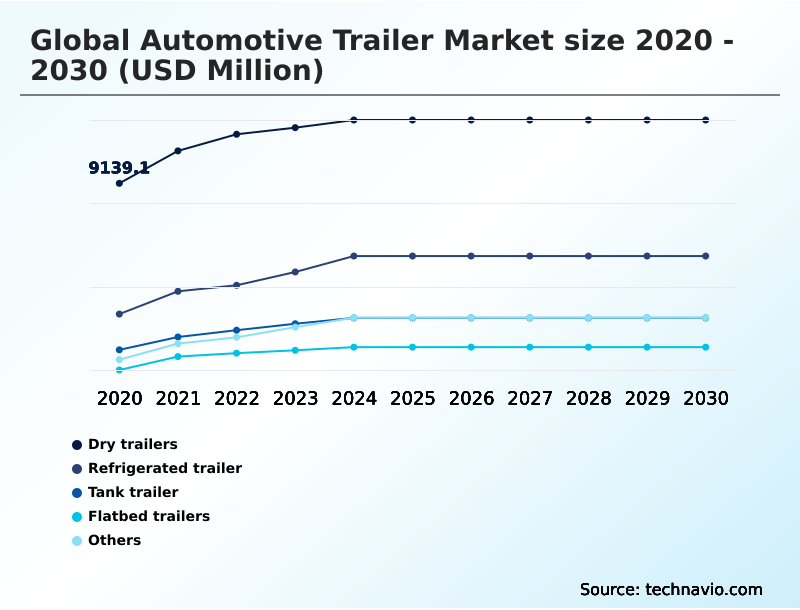
The Dry trailers segment was valued at USD 11.08 billion in 2024 and showed a gradual increase during the forecast period.
Get Free Sample

Regional Analysis

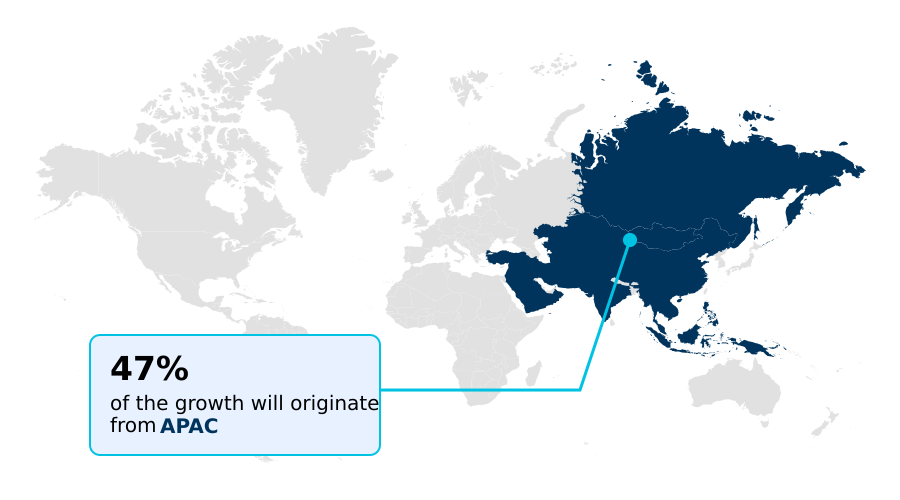
APAC is estimated to contribute 47.2% to the growth of the global market during the forecast period.Technavio’s analysts have elaborately explained the regional trends and drivers that shape the market during the forecast period.
See How Automotive Trailer Market Demand is Rising in APAC Get Free Sample

The geographic distribution of transport equipment manufacturing reveals distinct adoption variations driven by regional infrastructure complexities and regulatory frameworks.

North America maintains a sophisticated network for heavy freight transportation, where fleet operators have reduced operational downtime by 24% through the aggressive deployment of predictive maintenance sensors.

Conversely, Europe prioritizes strict safety compliance, leading to a 35% higher adoption rate of advanced roll stability control mechanisms compared to American counterparts.

Meanwhile, rapid industrialization across Asia Pacific demands specialized logistics solutions, where the deployment of high-capacity bulk carriers has improved cross-border haulage efficiency by over 20%.

Businesses in these distinct regions continually adapt their structural investments by utilizing high-strength aluminum alloys, balancing the immediate need for durability against the long-term necessity of maintaining secure and efficient supply chain operations.

Market Dynamics

Our researchers analyzed the data with 2025 as the base year, along with the key drivers, trends, and challenges. A holistic analysis of drivers will help companies refine their marketing strategies to gain a competitive advantage.

  • The continuous evolution of heavy commercial logistics heavily relies on structural engineering innovations and digital integration. Fleet operators prioritize reducing unladen weight in dry vans to offset strict infrastructure limitations, often achieving a 12% improvement in overall fleet utilization compared to legacy steel architectures.
  • By maximizing payload capacity with composite materials, transport companies significantly enhance their profit margins on long-distance routes. In the cold chain sector, engineers focus on optimizing thermal efficiency in refrigerated units to protect sensitive pharmaceutical shipments.
  • Furthermore, chemical logistics providers concentrate on preventing cargo contamination in tank vessels and ensuring safety in hazardous liquid transport through the deployment of specialized interior coatings. Operations are actively integrating smart telematics for predictive maintenance, which dramatically reduces unexpected roadside breakdowns and streamlines maintenance scheduling.
  • The industry is also mitigating drag resistance on highway routes to align with stringent environmental regulations. Advancements in kinetic energy management involve electrifying trailer axles for energy recovery, significantly lowering reliance on diesel power. Construction logistics require adapting flatbeds for oversized infrastructure components.
  • Ultimately, maintaining profitability demands complying with strict regional axle regulations to meet surging global supply chain demands securely.
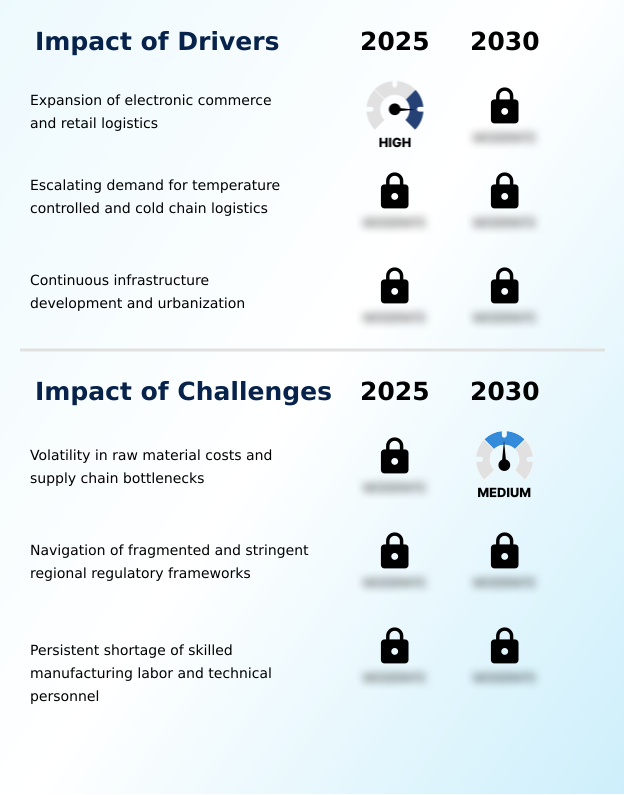
What are the key market drivers leading to the rise in the adoption of Automotive Trailer Industry?

  • The rapid expansion of electronic commerce platforms and comprehensive retail logistics networks serves as a primary catalyst driving market growth and structural modernization.

  • The relentless globalization of perishable food markets acts as a massive driver propelling the continuous expansion of specialized cold chain logistics infrastructure.
  • This behavioral shift happens because international consumers increasingly demand year-round access to fresh produce, requiring highly reliable units that guarantee refrigerated cargo integrity.
  • To prevent catastrophic spoilage during transit, logistics firms are rapidly acquiring insulated units equipped with precise multi-temperature zones.
  • This operational upgrade directly impacts business performance, with thermal deviation incidents plummeting by 24% and overall cargo rejection rates decreasing by nearly 18%.
  • The subsequent integration of real-time telematics ensures complete environmental transparency from the initial loading dock to the final retail destination. Ultimately, utilizing lightweight composite materials achieves superior commercial vehicle payload optimization, mandating massive capital investments in advanced transport technology.

What are the market trends shaping the Automotive Trailer Industry?

  • The integration of smart telematics and Internet of Things infrastructure has emerged as a prominent market trend. This digital advancement enables real-time asset monitoring and significantly enhances fleet operational efficiency.

  • The widespread adoption of kinetic energy recovery fundamentally redefines commercial transport capabilities across intermodal freight mobility. This technological shift occurs because stringent environmental mandates require logistics providers to drastically lower their carbon emissions to achieve zero-emission fleet operations. By deploying electrified axles, operators capture deceleration energy to power auxiliary equipment, completely eliminating the reliance on independent diesel generators.
  • Consequently, transport companies have reduced auxiliary fuel consumption by up to 28% and decreased acoustic pollution in urban delivery zones by 15%. The strategic implementation of solar-assisted refrigeration further enhances this efficiency, allowing thermal units to maintain precise temperatures independently.
  • These sustainable innovations enable advanced smart fleet management systems to optimize route planning seamlessly, ensuring that structural weight remains incredibly low while preserving maximum payload capacities throughout the transit lifecycle.

What challenges does the Automotive Trailer Industry face during its growth?

  • The inherent volatility in essential raw material pricing, coupled with persistent supply chain bottlenecks, presents a formidable operational challenge that consistently impacts industry profit margins.

  • Navigating fiercely fragmented regional regulatory frameworks constitutes a severe operational challenge that continuously restricts seamless freight distribution. This structural limitation exists because distinct international transport authorities enforce wildly disparate mandates regarding dynamic axle configurations and maximum vehicle dimensions. Consequently, manufacturers cannot utilize universally uniform production lines for specialized units like heavy-duty tippers.
  • This intense localization drives up localized engineering expenses by approximately 22% and extends new product development lifecycles by over 15%. When operators attempt to transport oversized goods, the lack of standardized over-dimension load handling protocols frequently results in localized border delays. Furthermore, the mandatory inclusion of customized electronic braking systems to meet specific provincial safety codes disrupts supply chain fluidity.
  • These disparities actively limit the seamless globalization of pneumatic tank trailers and complicate the logistics surrounding critical hazardous chemical haulage.

Exclusive Technavio Analysis on Customer Landscape

The automotive trailer market forecasting report includes the adoption lifecycle of the market, covering from the innovator’s stage to the laggard’s stage. It focuses on adoption rates in different regions based on penetration. Furthermore, the automotive trailer market report also includes key purchase criteria and drivers of price sensitivity to help companies evaluate and develop their market growth analysis strategies.
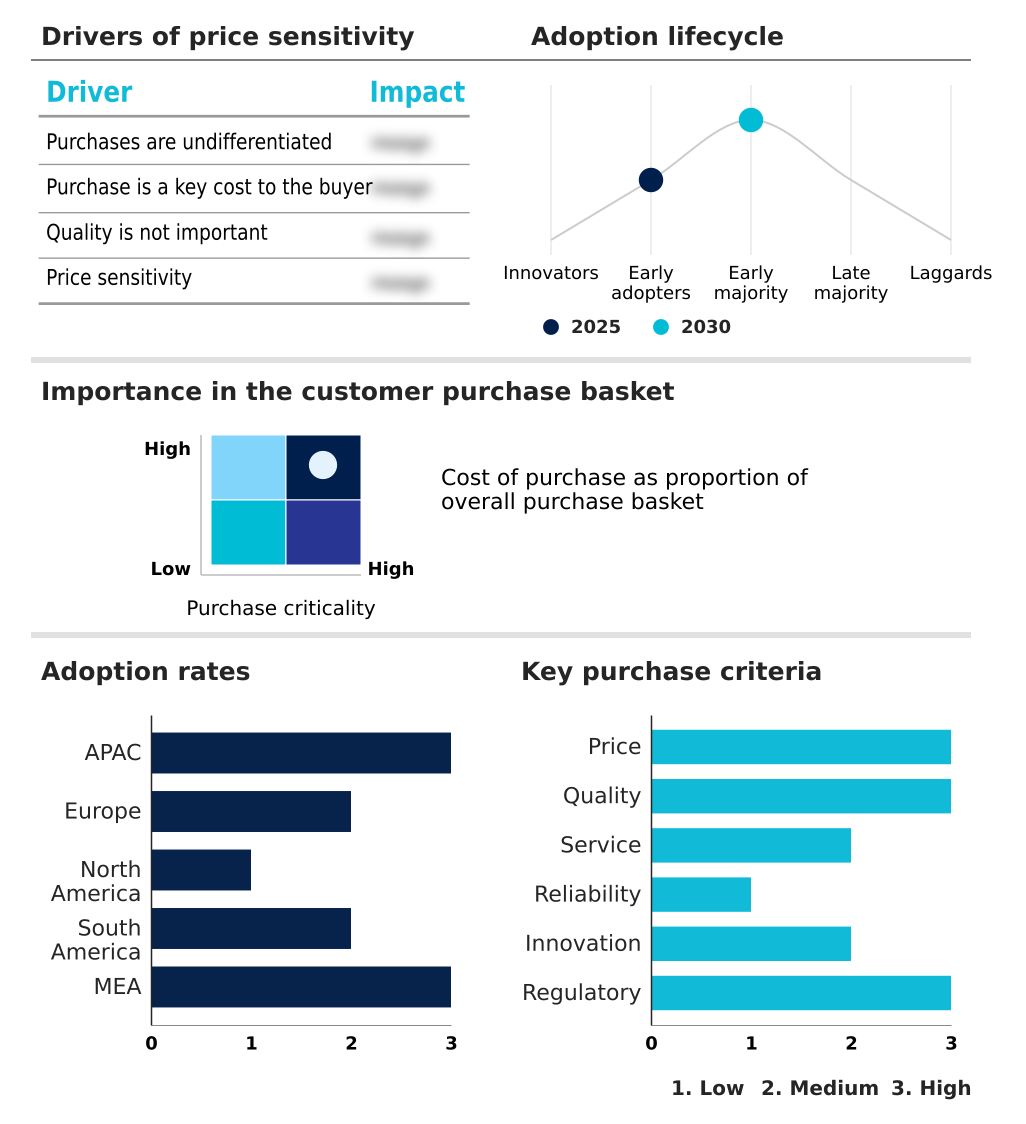
Customer Landscape of Automotive Trailer Industry

Competitive Landscape

Companies are implementing various strategies, such as strategic alliances, automotive trailer market forecast, partnerships, mergers and acquisitions, geographical expansion, and product/service launches, to enhance their presence in the industry.

CIMC Vehicles Group Co. Ltd. - This manufacturer delivers specialized unpowered transport units, encompassing enclosed freight configurations, skeletal container frameworks, and temperature-controlled insulated models tailored for rigorous commercial logistics and supply chain optimization.

The industry research and growth report includes detailed analyses of the competitive landscape of the market and information about key companies, including:

  • CIMC Vehicles Group Co. Ltd.
  • Dennison Trailers Ltd.
  • East Manufacturing Corp.
  • Faymonville Distribution AG
  • Fontaine Trailer Co.
  • GOLDHOFER
  • Great Dane LLC
  • HYUNDAI TRANSLEAD
  • Kassbohrer Transport Technik
  • Kentucky Trailer
  • Kogel Trailer GmbH
  • KRONE GMBH and CO. KG
  • LAMBERET SAS
  • Mac Trailer Manufacturing Inc.
  • Manac Inc.
  • Pitts Trailers.
  • Schmitz Cargobull AG
  • Schwarzmüller Group
  • STI HOLDINGS Inc.
  • Strick Trailers
  • Utility Trailer Manufacturing Co
  • Wabash National Corp.
  • Wielton S.A.

Qualitative and quantitative analysis of companies has been conducted to help clients understand the wider business environment as well as the strengths and weaknesses of key industry players. Data is qualitatively analyzed to categorize companies as pure play, category-focused, industry-focused, and diversified; it is quantitatively analyzed to categorize companies as dominant, leading, strong, tentative, and weak.

Recent Development and News in Automotive trailer market

  • In the Automobile Manufacturers industry, the aggressive transition toward zero-emission fleet operations necessitated the redesign of commercial towing units, directly impacting Automotive Trailer demand by spurring a 22% increase in the production of regenerative braking axles and electrified axles that reduce the primary cabin energy load.
  • The implementation of strict highway weight limit compliance regulations across major transit corridors forced structural re-engineering, causing trailer producers to adopt friction stir welding and advanced adhesive bonding to lower unladen weight by up to 15%.
  • The rapid expansion of cold chain logistics infrastructure for perishable and pharmaceutical goods required tighter thermal integration, leading manufacturers to deploy multi-temperature zones and solar-assisted refrigeration, thereby improving refrigerated cargo integrity by over 30%.
  • Surging requirements for automated warehouse replenishment and intermodal rail-road transfers drove the standardization of smart fleet management protocols, increasing the integration of predictive maintenance sensors and real-time telematics by 40% across skeletal container chassis production lines.

Dive into Technavio’s robust research methodology, blending expert interviews, extensive data synthesis, and validated models for unparalleled Automotive Trailer Market insights. See full methodology.

Market Scope
Page number 302
Base year 2025
Historic period 2020-2024
Forecast period 2026-2030
Growth momentum & CAGR Accelerate at a CAGR of 4.6%
Market growth 2026-2030 USD 8372.9 million
Market structure Fragmented
YoY growth 2025-2026(%) 4.4%
Key countries China, India, Japan, South Korea, Australia, Indonesia, Germany, France, UK, Italy, Spain, The Netherlands, US, Canada, Mexico, Brazil, Argentina, Chile, Saudi Arabia, UAE, Turkey, South Africa and Israel
Competitive landscape Leading Companies, Market Positioning of Companies, Competitive Strategies, and Industry Risks

Request Free Sample

Research Analyst Overview

  • The persistent necessity for robust intermodal transport solutions heavily dictates strategic asset allocation within modern supply chain operations. Logistics executives consistently prioritize the integration of lightweight composite materials and high-strength aluminum alloys to maximize payload capacities without exceeding rigid infrastructure weight restrictions.
  • This specific material transition has enabled prominent fleet operators to achieve a 16% reduction in structural maintenance costs over a five-year lifecycle. The ongoing shift toward digital connectivity directly influences boardroom-level compliance and budgeting strategies, as the mandatory installation of real-time telematics and electronic braking systems significantly lowers annual insurance premiums while ensuring complete regulatory alignment.
  • Furthermore, the optimization of aerodynamic fairings heavily mitigates wind resistance during long-distance transit. In temperature-sensitive sectors, the incorporation of multi-temperature zones and fiberglass reinforced polymers prevents thermal leakage, safeguarding high-value pharmaceutical and agricultural shipments. By deploying advanced predictive maintenance sensors and roll stability control mechanisms, transportation networks actively eliminate unexpected downtime.
  • These deliberate engineering advancements ensure that heavy-duty commercial fleets operate with exceptional precision, structural resilience, and absolute operational efficiency.

What are the Key Data Covered in this Automotive Trailer Market Research and Growth Report?

  • What is the expected growth of the Automotive Trailer Market between 2026 and 2030?

    • USD 8.37 billion, at a CAGR of 4.6%

  • What segmentation does the market report cover?

    • The report is segmented by Type (Dry trailers, Refrigerated trailer, Tank trailer, Flatbed trailers, and Others), Vehicle Type (Commercial vehicle, Passenger car, and Two-wheeler and bicycle), Channel (OEM, and Aftermarket) and Geography (APAC, Europe, North America, South America, Middle East and Africa)

  • Which regions are analyzed in the report?

    • APAC, Europe, North America, South America and Middle East and Africa

  • What are the key growth drivers and market challenges?

    • Expansion of electronic commerce and retail logistics, Volatility in raw material costs and supply chain bottlenecks

  • Who are the major players in the Automotive Trailer Market?

    • CIMC Vehicles Group Co. Ltd., Dennison Trailers Ltd., East Manufacturing Corp., Faymonville Distribution AG, Fontaine Trailer Co., GOLDHOFER, Great Dane LLC, HYUNDAI TRANSLEAD, Kassbohrer Transport Technik, Kentucky Trailer, Kogel Trailer GmbH, KRONE GMBH and CO. KG, LAMBERET SAS, Mac Trailer Manufacturing Inc., Manac Inc., Pitts Trailers., Schmitz Cargobull AG, Schwarzmüller Group, STI HOLDINGS Inc., Strick Trailers, Utility Trailer Manufacturing Co, Wabash National Corp. and Wielton S.A.

Market Research Insights

  • The commercial haulage sector is experiencing a profound technological transformation centered on commercial vehicle payload optimization and smart fleet management. By integrating advanced telematics, logistics operators have successfully improved cross-border haulage efficiency by nearly 22%, drastically reducing transit delays at major inspection checkpoints.
  • The transition toward zero-emission fleet operations has accelerated the deployment of aerodynamically optimized transport units, resulting in a 15% reduction in overall aerodynamic drag compared to traditional designs. Furthermore, the expansion of cold chain logistics infrastructure guarantees secure temperature-controlled distribution for sensitive commodities.
  • These strategic upgrades enable modern transport networks to maintain absolute highway weight limit compliance while simultaneously maximizing daily cargo throughput and enhancing long-term asset utilization.

We can help! Our analysts can customize this automotive trailer market research report to meet your requirements.

Get in touch

1. Executive Summary

1.1 Market overview

Executive Summary - Chart on Market Overview
Executive Summary - Data Table on Market Overview
Executive Summary - Chart on Global Market Characteristics
Executive Summary - Chart on Market by Geography
Executive Summary - Chart on Market Segmentation by Type
Executive Summary - Chart on Market Segmentation by Vehicle Type
Executive Summary - Chart on Market Segmentation by Channel
Executive Summary - Chart on Incremental Growth
Executive Summary - Data Table on Incremental Growth
Executive Summary - Chart on Company Market Positioning

2. Technavio Analysis

2.1 Analysis of price sensitivity, lifecycle, customer purchase basket, adoption rates, and purchase criteria

2.2 Criticality of inputs and Factors of differentiation

Chart on Overview on criticality of inputs and factors of differentiation

2.3 Factors of disruption

Chart on Overview on factors of disruption

2.4 Impact of drivers and challenges

Chart on Impact of drivers and challenges in 2025 and 2030

3. Market Landscape

3.1 Market ecosystem

Chart on Parent Market
Data Table on - Parent Market

3.2 Market characteristics

Chart on Market characteristics analysis

3.3 Value chain analysis

Chart on Value chain analysis

4. Market Sizing

4.1 Market definition

Data Table on Offerings of companies included in the market definition

4.2 Market segment analysis

Market segments

4.3 Market size 2025

4.4 Market outlook: Forecast for 2025-2030

Chart on Global - Market size and forecast 2025-2030 ($ million)
Data Table on Global - Market size and forecast 2025-2030 ($ million)
Chart on Global Market: Year-over-year growth 2025-2030 (%)
Data Table on Global Market: Year-over-year growth 2025-2030 (%)

5. Historic Market Size

5.1 Global Automotive Trailer Market 2020 - 2024

Historic Market Size - Data Table on Global Automotive Trailer Market 2020 - 2024 ($ million)

5.2 Type segment analysis 2020 - 2024

Historic Market Size - Type Segment 2020 - 2024 ($ million)

5.3 Vehicle Type segment analysis 2020 - 2024

Historic Market Size - Vehicle Type Segment 2020 - 2024 ($ million)

5.4 Channel segment analysis 2020 - 2024

Historic Market Size - Channel Segment 2020 - 2024 ($ million)

5.5 Geography segment analysis 2020 - 2024

Historic Market Size - Geography Segment 2020 - 2024 ($ million)

5.6 Country segment analysis 2020 - 2024

Historic Market Size - Country Segment 2020 - 2024 ($ million)

6. Qualitative Analysis

6.1 Impact of AI on global automotive trailer market

6.2 Impact of geopolitical conflicts on global automotive trailer market

7. Five Forces Analysis

7.1 Five forces summary

Five forces analysis - Comparison between 2025 and 2030

7.2 Bargaining power of buyers

Bargaining power of buyers - Impact of key factors 2025 and 2030

7.3 Bargaining power of suppliers

Bargaining power of suppliers - Impact of key factors in 2025 and 2030

7.4 Threat of new entrants

Threat of new entrants - Impact of key factors in 2025 and 2030

7.5 Threat of substitutes

Threat of substitutes - Impact of key factors in 2025 and 2030

7.6 Threat of rivalry

Threat of rivalry - Impact of key factors in 2025 and 2030

7.7 Market condition

Chart on Market condition - Five forces 2025 and 2030

8. Market Segmentation by Type

8.1 Market segments

Chart on Type - Market share 2025-2030 (%)
Data Table on Type - Market share 2025-2030 (%)

8.2 Comparison by Type

Chart on Comparison by Type
Data Table on Comparison by Type

8.3 Dry trailers - Market size and forecast 2025-2030

Chart on Dry trailers - Market size and forecast 2025-2030 ($ million)
Data Table on Dry trailers - Market size and forecast 2025-2030 ($ million)
Chart on Dry trailers - Year-over-year growth 2025-2030 (%)
Data Table on Dry trailers - Year-over-year growth 2025-2030 (%)

8.4 Refrigerated trailer - Market size and forecast 2025-2030

Chart on Refrigerated trailer - Market size and forecast 2025-2030 ($ million)
Data Table on Refrigerated trailer - Market size and forecast 2025-2030 ($ million)
Chart on Refrigerated trailer - Year-over-year growth 2025-2030 (%)
Data Table on Refrigerated trailer - Year-over-year growth 2025-2030 (%)

8.5 Tank trailer - Market size and forecast 2025-2030

Chart on Tank trailer - Market size and forecast 2025-2030 ($ million)
Data Table on Tank trailer - Market size and forecast 2025-2030 ($ million)
Chart on Tank trailer - Year-over-year growth 2025-2030 (%)
Data Table on Tank trailer - Year-over-year growth 2025-2030 (%)

8.6 Flatbed trailers - Market size and forecast 2025-2030

Chart on Flatbed trailers - Market size and forecast 2025-2030 ($ million)
Data Table on Flatbed trailers - Market size and forecast 2025-2030 ($ million)
Chart on Flatbed trailers - Year-over-year growth 2025-2030 (%)
Data Table on Flatbed trailers - Year-over-year growth 2025-2030 (%)

8.7 Others - Market size and forecast 2025-2030

Chart on Others - Market size and forecast 2025-2030 ($ million)
Data Table on Others - Market size and forecast 2025-2030 ($ million)
Chart on Others - Year-over-year growth 2025-2030 (%)
Data Table on Others - Year-over-year growth 2025-2030 (%)

8.8 Market opportunity by Type

Market opportunity by Type ($ million)
Data Table on Market opportunity by Type ($ million)

9. Market Segmentation by Vehicle Type

9.1 Market segments

Chart on Vehicle Type - Market share 2025-2030 (%)
Data Table on Vehicle Type - Market share 2025-2030 (%)

9.2 Comparison by Vehicle Type

Chart on Comparison by Vehicle Type
Data Table on Comparison by Vehicle Type

9.3 Commercial vehicle - Market size and forecast 2025-2030

Chart on Commercial vehicle - Market size and forecast 2025-2030 ($ million)
Data Table on Commercial vehicle - Market size and forecast 2025-2030 ($ million)
Chart on Commercial vehicle - Year-over-year growth 2025-2030 (%)
Data Table on Commercial vehicle - Year-over-year growth 2025-2030 (%)

9.4 Passenger car - Market size and forecast 2025-2030

Chart on Passenger car - Market size and forecast 2025-2030 ($ million)
Data Table on Passenger car - Market size and forecast 2025-2030 ($ million)
Chart on Passenger car - Year-over-year growth 2025-2030 (%)
Data Table on Passenger car - Year-over-year growth 2025-2030 (%)

9.5 Two-wheeler and bicycle - Market size and forecast 2025-2030

Chart on Two-wheeler and bicycle - Market size and forecast 2025-2030 ($ million)
Data Table on Two-wheeler and bicycle - Market size and forecast 2025-2030 ($ million)
Chart on Two-wheeler and bicycle - Year-over-year growth 2025-2030 (%)
Data Table on Two-wheeler and bicycle - Year-over-year growth 2025-2030 (%)

9.6 Market opportunity by Vehicle Type

Market opportunity by Vehicle Type ($ million)
Data Table on Market opportunity by Vehicle Type ($ million)

10. Market Segmentation by Channel

10.1 Market segments

Chart on Channel - Market share 2025-2030 (%)
Data Table on Channel - Market share 2025-2030 (%)

10.2 Comparison by Channel

Chart on Comparison by Channel
Data Table on Comparison by Channel

10.3 OEM - Market size and forecast 2025-2030

Chart on OEM - Market size and forecast 2025-2030 ($ million)
Data Table on OEM - Market size and forecast 2025-2030 ($ million)
Chart on OEM - Year-over-year growth 2025-2030 (%)
Data Table on OEM - Year-over-year growth 2025-2030 (%)

10.4 Aftermarket - Market size and forecast 2025-2030

Chart on Aftermarket - Market size and forecast 2025-2030 ($ million)
Data Table on Aftermarket - Market size and forecast 2025-2030 ($ million)
Chart on Aftermarket - Year-over-year growth 2025-2030 (%)
Data Table on Aftermarket - Year-over-year growth 2025-2030 (%)

10.5 Market opportunity by Channel

Market opportunity by Channel ($ million)
Data Table on Market opportunity by Channel ($ million)

11. Customer Landscape

11.1 Customer landscape overview

Analysis of price sensitivity, lifecycle, customer purchase basket, adoption rates, and purchase criteria

12. Geographic Landscape

12.1 Geographic segmentation

Chart on Market share by geography 2025-2030 (%)
Data Table on Market share by geography 2025-2030 (%)

12.2 Geographic comparison

Chart on Geographic comparison
Data Table on Geographic comparison

12.3 APAC - Market size and forecast 2025-2030

Chart on APAC - Market size and forecast 2025-2030 ($ million)
Data Table on APAC - Market size and forecast 2025-2030 ($ million)
Chart on APAC - Year-over-year growth 2025-2030 (%)
Data Table on APAC - Year-over-year growth 2025-2030 (%)
Chart on Regional Comparison - APAC
Data Table on Regional Comparison - APAC

12.3.1 China - Market size and forecast 2025-2030

Chart on China - Market size and forecast 2025-2030 ($ million)
Data Table on China - Market size and forecast 2025-2030 ($ million)
Chart on China - Year-over-year growth 2025-2030 (%)
Data Table on China - Year-over-year growth 2025-2030 (%)

12.3.2 India - Market size and forecast 2025-2030

Chart on India - Market size and forecast 2025-2030 ($ million)
Data Table on India - Market size and forecast 2025-2030 ($ million)
Chart on India - Year-over-year growth 2025-2030 (%)
Data Table on India - Year-over-year growth 2025-2030 (%)

12.3.3 Japan - Market size and forecast 2025-2030

Chart on Japan - Market size and forecast 2025-2030 ($ million)
Data Table on Japan - Market size and forecast 2025-2030 ($ million)
Chart on Japan - Year-over-year growth 2025-2030 (%)
Data Table on Japan - Year-over-year growth 2025-2030 (%)

12.3.4 South Korea - Market size and forecast 2025-2030

Chart on South Korea - Market size and forecast 2025-2030 ($ million)
Data Table on South Korea - Market size and forecast 2025-2030 ($ million)
Chart on South Korea - Year-over-year growth 2025-2030 (%)
Data Table on South Korea - Year-over-year growth 2025-2030 (%)

12.3.5 Australia - Market size and forecast 2025-2030

Chart on Australia - Market size and forecast 2025-2030 ($ million)
Data Table on Australia - Market size and forecast 2025-2030 ($ million)
Chart on Australia - Year-over-year growth 2025-2030 (%)
Data Table on Australia - Year-over-year growth 2025-2030 (%)

12.3.6 Indonesia - Market size and forecast 2025-2030

Chart on Indonesia - Market size and forecast 2025-2030 ($ million)
Data Table on Indonesia - Market size and forecast 2025-2030 ($ million)
Chart on Indonesia - Year-over-year growth 2025-2030 (%)
Data Table on Indonesia - Year-over-year growth 2025-2030 (%)

12.4 Europe - Market size and forecast 2025-2030

Chart on Europe - Market size and forecast 2025-2030 ($ million)
Data Table on Europe - Market size and forecast 2025-2030 ($ million)
Chart on Europe - Year-over-year growth 2025-2030 (%)
Data Table on Europe - Year-over-year growth 2025-2030 (%)
Chart on Regional Comparison - Europe
Data Table on Regional Comparison - Europe

12.4.1 Germany - Market size and forecast 2025-2030

Chart on Germany - Market size and forecast 2025-2030 ($ million)
Data Table on Germany - Market size and forecast 2025-2030 ($ million)
Chart on Germany - Year-over-year growth 2025-2030 (%)
Data Table on Germany - Year-over-year growth 2025-2030 (%)

12.4.2 France - Market size and forecast 2025-2030

Chart on France - Market size and forecast 2025-2030 ($ million)
Data Table on France - Market size and forecast 2025-2030 ($ million)
Chart on France - Year-over-year growth 2025-2030 (%)
Data Table on France - Year-over-year growth 2025-2030 (%)

12.4.3 UK - Market size and forecast 2025-2030

Chart on UK - Market size and forecast 2025-2030 ($ million)
Data Table on UK - Market size and forecast 2025-2030 ($ million)
Chart on UK - Year-over-year growth 2025-2030 (%)
Data Table on UK - Year-over-year growth 2025-2030 (%)

12.4.4 Italy - Market size and forecast 2025-2030

Chart on Italy - Market size and forecast 2025-2030 ($ million)
Data Table on Italy - Market size and forecast 2025-2030 ($ million)
Chart on Italy - Year-over-year growth 2025-2030 (%)
Data Table on Italy - Year-over-year growth 2025-2030 (%)

12.4.5 Spain - Market size and forecast 2025-2030

Chart on Spain - Market size and forecast 2025-2030 ($ million)
Data Table on Spain - Market size and forecast 2025-2030 ($ million)
Chart on Spain - Year-over-year growth 2025-2030 (%)
Data Table on Spain - Year-over-year growth 2025-2030 (%)

12.4.6 The Netherlands - Market size and forecast 2025-2030

Chart on The Netherlands - Market size and forecast 2025-2030 ($ million)
Data Table on The Netherlands - Market size and forecast 2025-2030 ($ million)
Chart on The Netherlands - Year-over-year growth 2025-2030 (%)
Data Table on The Netherlands - Year-over-year growth 2025-2030 (%)

12.5 North America - Market size and forecast 2025-2030

Chart on North America - Market size and forecast 2025-2030 ($ million)
Data Table on North America - Market size and forecast 2025-2030 ($ million)
Chart on North America - Year-over-year growth 2025-2030 (%)
Data Table on North America - Year-over-year growth 2025-2030 (%)
Chart on Regional Comparison - North America
Data Table on Regional Comparison - North America

12.5.1 US - Market size and forecast 2025-2030

Chart on US - Market size and forecast 2025-2030 ($ million)
Data Table on US - Market size and forecast 2025-2030 ($ million)
Chart on US - Year-over-year growth 2025-2030 (%)
Data Table on US - Year-over-year growth 2025-2030 (%)

12.5.2 Canada - Market size and forecast 2025-2030

Chart on Canada - Market size and forecast 2025-2030 ($ million)
Data Table on Canada - Market size and forecast 2025-2030 ($ million)
Chart on Canada - Year-over-year growth 2025-2030 (%)
Data Table on Canada - Year-over-year growth 2025-2030 (%)

12.5.3 Mexico - Market size and forecast 2025-2030

Chart on Mexico - Market size and forecast 2025-2030 ($ million)
Data Table on Mexico - Market size and forecast 2025-2030 ($ million)
Chart on Mexico - Year-over-year growth 2025-2030 (%)
Data Table on Mexico - Year-over-year growth 2025-2030 (%)

12.6 South America - Market size and forecast 2025-2030

Chart on South America - Market size and forecast 2025-2030 ($ million)
Data Table on South America - Market size and forecast 2025-2030 ($ million)
Chart on South America - Year-over-year growth 2025-2030 (%)
Data Table on South America - Year-over-year growth 2025-2030 (%)
Chart on Regional Comparison - South America
Data Table on Regional Comparison - South America

12.6.1 Brazil - Market size and forecast 2025-2030

Chart on Brazil - Market size and forecast 2025-2030 ($ million)
Data Table on Brazil - Market size and forecast 2025-2030 ($ million)
Chart on Brazil - Year-over-year growth 2025-2030 (%)
Data Table on Brazil - Year-over-year growth 2025-2030 (%)

12.6.2 Argentina - Market size and forecast 2025-2030

Chart on Argentina - Market size and forecast 2025-2030 ($ million)
Data Table on Argentina - Market size and forecast 2025-2030 ($ million)
Chart on Argentina - Year-over-year growth 2025-2030 (%)
Data Table on Argentina - Year-over-year growth 2025-2030 (%)

12.6.3 Chile - Market size and forecast 2025-2030

Chart on Chile - Market size and forecast 2025-2030 ($ million)
Data Table on Chile - Market size and forecast 2025-2030 ($ million)
Chart on Chile - Year-over-year growth 2025-2030 (%)
Data Table on Chile - Year-over-year growth 2025-2030 (%)

12.7 Middle East and Africa - Market size and forecast 2025-2030

Chart on Middle East and Africa - Market size and forecast 2025-2030 ($ million)
Data Table on Middle East and Africa - Market size and forecast 2025-2030 ($ million)
Chart on Middle East and Africa - Year-over-year growth 2025-2030 (%)
Data Table on Middle East and Africa - Year-over-year growth 2025-2030 (%)
Chart on Regional Comparison - Middle East and Africa
Data Table on Regional Comparison - Middle East and Africa

12.7.1 Saudi Arabia - Market size and forecast 2025-2030

Chart on Saudi Arabia - Market size and forecast 2025-2030 ($ million)
Data Table on Saudi Arabia - Market size and forecast 2025-2030 ($ million)
Chart on Saudi Arabia - Year-over-year growth 2025-2030 (%)
Data Table on Saudi Arabia - Year-over-year growth 2025-2030 (%)

12.7.2 UAE - Market size and forecast 2025-2030

Chart on UAE - Market size and forecast 2025-2030 ($ million)
Data Table on UAE - Market size and forecast 2025-2030 ($ million)
Chart on UAE - Year-over-year growth 2025-2030 (%)
Data Table on UAE - Year-over-year growth 2025-2030 (%)

12.7.3 Turkey - Market size and forecast 2025-2030

Chart on Turkey - Market size and forecast 2025-2030 ($ million)
Data Table on Turkey - Market size and forecast 2025-2030 ($ million)
Chart on Turkey - Year-over-year growth 2025-2030 (%)
Data Table on Turkey - Year-over-year growth 2025-2030 (%)

12.7.4 South Africa - Market size and forecast 2025-2030

Chart on South Africa - Market size and forecast 2025-2030 ($ million)
Data Table on South Africa - Market size and forecast 2025-2030 ($ million)
Chart on South Africa - Year-over-year growth 2025-2030 (%)
Data Table on South Africa - Year-over-year growth 2025-2030 (%)

12.7.5 Israel - Market size and forecast 2025-2030

Chart on Israel - Market size and forecast 2025-2030 ($ million)
Data Table on Israel - Market size and forecast 2025-2030 ($ million)
Chart on Israel - Year-over-year growth 2025-2030 (%)
Data Table on Israel - Year-over-year growth 2025-2030 (%)

12.8 Market opportunity by geography

Market opportunity by geography ($ million)
Data Tables on Market opportunity by geography ($ million)

13. Drivers, Challenges, and Opportunity

13.1 Market drivers

Expansion of electronic commerce and retail logistics
Escalating demand for temperature controlled and cold chain logistics
Continuous infrastructure development and urbanization

13.2 Market challenges

Volatility in raw material costs and supply chain bottlenecks
Navigation of fragmented and stringent regional regulatory frameworks
Persistent shortage of skilled manufacturing labor and technical personnel

13.3 Impact of drivers and challenges

Impact of drivers and challenges in 2025 and 2030

13.4 Market opportunities

Integration of smart telematics and internet of things
Adoption of lightweight and advanced composite materials
Electrification and energy recovery systems

14. Competitive Landscape

14.1 Overview

14.2

Overview on criticality of inputs and factors of differentiation

14.3 Landscape disruption

Overview on factors of disruption

14.4 Industry risks

Impact of key risks on business

15. Competitive Analysis

15.1 Companies profiled

Companies covered

15.2 Company ranking index

15.3 Market positioning of companies

Matrix on companies position and classification

15.4 CIMC Vehicles Group Co. Ltd.

CIMC Vehicles Group Co. Ltd. - Overview
CIMC Vehicles Group Co. Ltd. - Business segments
CIMC Vehicles Group Co. Ltd. - Key offerings
CIMC Vehicles Group Co. Ltd. - Segment focus
SWOT

15.5 East Manufacturing Corp.

East Manufacturing Corp. - Overview
East Manufacturing Corp. - Product / Service
East Manufacturing Corp. - Key offerings
SWOT

15.6 Faymonville Distribution AG

Faymonville Distribution AG - Overview
Faymonville Distribution AG - Product / Service
Faymonville Distribution AG - Key offerings
SWOT

15.7 Fontaine Trailer Co.

Fontaine Trailer Co. - Overview
Fontaine Trailer Co. - Product / Service
Fontaine Trailer Co. - Key offerings
SWOT

15.8 GOLDHOFER

GOLDHOFER - Overview
GOLDHOFER - Product / Service
GOLDHOFER - Key offerings
SWOT

15.9 Great Dane LLC

Great Dane LLC - Overview
Great Dane LLC - Product / Service
Great Dane LLC - Key offerings
SWOT

15.10 HYUNDAI TRANSLEAD

HYUNDAI TRANSLEAD - Overview
HYUNDAI TRANSLEAD - Product / Service
HYUNDAI TRANSLEAD - Key offerings
SWOT

15.11 Kogel Trailer GmbH

Kogel Trailer GmbH - Overview
Kogel Trailer GmbH - Product / Service
Kogel Trailer GmbH - Key offerings
SWOT

15.12 KRONE GMBH and CO. KG

KRONE GMBH and CO. KG - Overview
KRONE GMBH and CO. KG - Product / Service
KRONE GMBH and CO. KG - Key offerings
SWOT

15.13 Mac Trailer Manufacturing Inc.

Mac Trailer Manufacturing Inc. - Overview
Mac Trailer Manufacturing Inc. - Product / Service
Mac Trailer Manufacturing Inc. - Key offerings
SWOT

15.14 Manac Inc.

Manac Inc. - Overview
Manac Inc. - Product / Service
Manac Inc. - Key offerings
SWOT

15.15 Schmitz Cargobull AG

Schmitz Cargobull AG - Overview
Schmitz Cargobull AG - Product / Service
Schmitz Cargobull AG - Key offerings
SWOT

15.16 Schwarzmüller Group

Schwarzmüller Group - Overview
Schwarzmüller Group - Product / Service
Schwarzmüller Group - Key offerings
SWOT

15.17 Wabash National Corp.

Wabash National Corp. - Overview
Wabash National Corp. - Business segments
Wabash National Corp. - Key offerings
Wabash National Corp. - Segment focus
SWOT

15.18 Wielton S.A.

Wielton S.A. - Overview
Wielton S.A. - Product / Service
Wielton S.A. - Key offerings
SWOT

16. Appendix

16.1 Scope of the report

Market definition
Objectives
Notes and caveats

16.2 Inclusions and exclusions checklist

Inclusions checklist
Exclusions checklist

16.3 Currency conversion rates for US$

16.4 Research methodology

16.5 Data procurement

Information sources

16.6 Data validation

16.7 Validation techniques employed for market sizing

16.8 Data synthesis

16.9 360 degree market analysis

16.10 List of abbreviations

Research Methodology

Technavio presents a detailed picture of the market by way of study, synthesis, and summation of data from multiple sources. The analysts have presented the various facets of the market with a particular focus on identifying the key industry influencers. The data thus presented is comprehensive, reliable, and the result of extensive research, both primary and secondary.

INFORMATION SOURCES

Primary sources

  • Manufacturers and suppliers
  • Channel partners
  • Industry experts
  • Strategic decision makers

Secondary sources

  • Industry journals and periodicals
  • Government data
  • Financial reports of key industry players
  • Historical data
  • Press releases

DATA ANALYSIS

Data Synthesis

  • Collation of data
  • Estimation of key figures
  • Analysis of derived insights

Data Validation

  • Triangulation with data models
  • Reference against proprietary databases
  • Corroboration with industry experts

REPORT WRITING

Qualitative

  • Market drivers
  • Market challenges
  • Market trends
  • Five forces analysis

Quantitative

  • Market size and forecast
  • Market segmentation
  • Geographical insights
  • Competitive landscape

Interested in this report?

Get your sample now to see our research methodology and insights!

Download Now

Frequently Asked Questions

Automotive Trailer market growth will increase by USD 8372.9 million during 2026-2030.

The Automotive Trailer market is expected to grow at a CAGR of 4.6% during 2026-2030.

Automotive Trailer market is segmented by Type (Dry trailers, Refrigerated trailer, Tank trailer, Flatbed trailers, Others) Vehicle type (Commercial vehicle, Passenger car, Two-wheeler and bicycle) Channel (OEM, Aftermarket)

CIMC Vehicles Group Co. Ltd., Dennison Trailers Ltd., East Manufacturing Corp., Faymonville Distribution AG, Fontaine Trailer Co., GOLDHOFER, Great Dane LLC, HYUNDAI TRANSLEAD, Kassbohrer Transport Technik, Kentucky Trailer, Kogel Trailer GmbH, KRONE GMBH and CO. KG, LAMBERET SAS, Mac Trailer Manufacturing Inc., Manac Inc., Pitts Trailers., Schmitz Cargobull AG, Schwarzmüller Group, STI HOLDINGS Inc., Strick Trailers, Utility Trailer Manufacturing Co, Wabash National Corp., Wielton S.A. are a few of the key vendors in the Automotive Trailer market.

APAC will register the highest growth rate of 47.2% among the other regions. Therefore, the Automotive Trailer market in APAC is expected to garner significant business opportunities for the vendors during the forecast period.

China, India, Japan, South Korea, Australia, Indonesia, Germany, France, UK, Italy, Spain, The Netherlands, US, Canada, Mexico, Brazil, Argentina, Chile, Saudi Arabia, UAE, Turkey, South Africa, Israel

  • Expansion of electronic commerce and retail logistics is the driving factor this market.

The Automotive Trailer market vendors should focus on grabbing business opportunities from the Type segment as it accounted for the largest market share in the base year.
RIA - Research AI Assistant
Ask RIA
