
Barge Transportation Market Analysis, Size, and Forecast 2026-2030: APAC (China, India, and Japan), North America (US, Canada, and Mexico), Europe (Germany, The Netherlands, and UK), South America (Brazil, Argentina, and Chile), Middle East and Africa (Saudi Arabia, UAE, and Turkey), and Rest of World (ROW)

Barge Transportation Market Analysis, Size, and Forecast 2026-2030:
APAC (China, India, and Japan), North America (US, Canada, and Mexico), Europe (Germany, The Netherlands, and UK), South America (Brazil, Argentina, and Chile), Middle East and Africa (Saudi Arabia, UAE, and Turkey), and Rest of World (ROW)

Published: Oct 2026 299 Pages SKU: IRTNTR73614

Market Overview at a Glance

$45.52 B
Market Opportunity
5.7%
CAGR 2025 - 2030
29%
North America Growth
$91.39 B
Dry cargo barge segment 2024

Barge Transportation Market Size 2026-2030

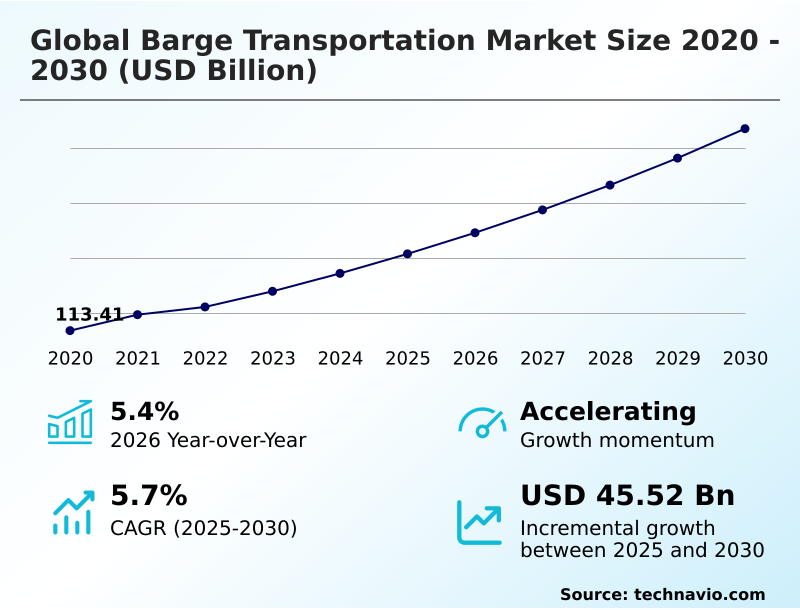
The barge transportation market size is valued to increase by USD 45.52 billion, at a CAGR of 5.7% from 2025 to 2030. Superior fuel efficiency and carbon reduction driving bulk freight adoption will drive the barge transportation market.

Major Market Trends & Insights

  • North America dominated the market and accounted for a 29% growth during the forecast period.
  • By Type - Dry cargo barge segment was valued at USD 91.39 billion in 2024
  • By Application - Agricultural products segment accounted for the largest market revenue share in 2024

Market Size & Forecast

  • Market Opportunities: USD 73.43 billion
  • Market Future Opportunities: USD 45.52 billion
  • CAGR from 2025 to 2030 : 5.7%

Market Summary

  • The Barge Transportation Market operates as a highly resilient and cost-effective maritime logistics framework essential for continuous bulk commodity movement. Industrial enterprises increasingly leverage multi-vessel configurations to bypass congested land transportation, directly enhancing supply chain capacity.
  • For instance, agricultural exporters utilizing specialized covered hopper barges preserve cargo integrity across extended transit periods, linking rural farming hubs seamlessly with coastal export terminals. This modal shift achieves a 25% reduction in overall freight expenditures compared to long-haul rail distribution.
  • A primary driver of this market is the strict corporate mandate to reduce carbon footprints, as waterborne freight consumes significantly less fuel per ton-mile, fulfilling aggressive environmental sustainability targets. Conversely, the market faces a substantial challenge from aging hydraulic infrastructure, where recurring lock and dam failures generate severe transit delays and inflate operational costs.
  • Despite these infrastructural limitations, the continuous integration of predictive navigation software allows fleet operators to recalibrate routes dynamically. This strategic modernization stabilizes bulk cargo throughput and ensures the persistent relevance of inland maritime networks within modern industrial supply chains.

What will be the Size of the Barge Transportation Market during the forecast period?
Get Key Insights on Market Forecast (PDF) Get Free Sample

How is the Barge Transportation Market Segmented?

The barge transportation industry research report provides comprehensive data (region-wise segment analysis), with forecasts and estimates in "USD million" for the period 2026-2030, as well as historical data from 2020-2024 for the following segments.

  • Type
    • Dry cargo barge
    • Liquid cargo barge
  • Application
    • Agricultural products
    • Coal and crude petroleum
    • Food and beverage
    • Others
  • Product type
    • Covered barge
    • Opened barge
    • Tank barge
  • Geography
    • APAC
      • China
      • India
      • Japan
      • South Korea
      • Australia
      • Indonesia
    • North America
      • US
      • Canada
      • Mexico
    • Europe
      • Germany
      • The Netherlands
      • UK
      • France
      • Italy
      • Spain
    • South America
      • Brazil
      • Argentina
      • Chile
    • Middle East and Africa
      • Saudi Arabia
      • UAE
      • Turkey
      • Israel
      • South Africa

By Type Insights

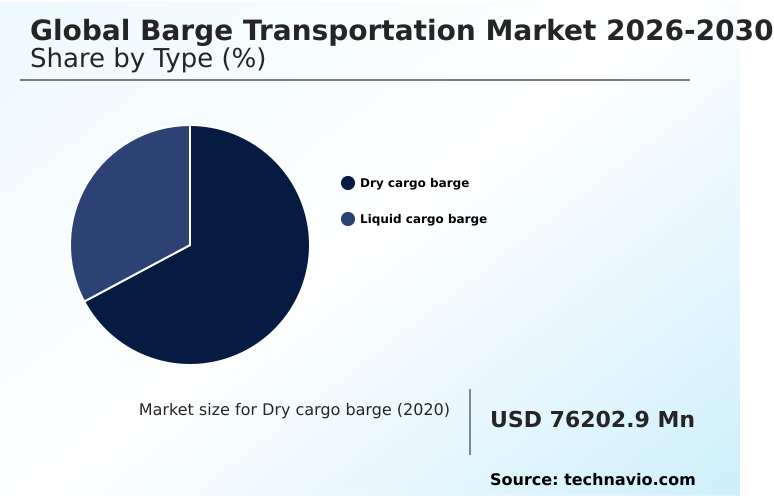
The dry cargo barge segment is estimated to witness significant growth during the forecast period.

The Dry cargo barge segment represents a foundational element of inland waterway navigation, handling essential non-liquid commodities across vast river networks. Operators increasingly implement an advanced push towboat configuration to maximize efficiency and achieve profound corporate carbon footprint reduction.

By ensuring seamless bulk agricultural commodity logistics and heavy industrial material handling, these vessels significantly outpace land transport capacity.

To maintain cargo integrity during extended transits, modern fleets deploy a reliable hopper hatch cover system alongside robust double hull tank vessel structures for mixed convoys.

This strategic marine propulsion optimization supports critical supply chain bottleneck mitigation, resulting in a 14% improvement in overall logistics fuel consumption metric efficiency.

Furthermore, integrating these vessels into the broader petrochemical distribution channel guarantees uninterrupted material flow, demonstrating how targeted segmentation upgrades drive superior operational performance and cost control.
Get Free Sample

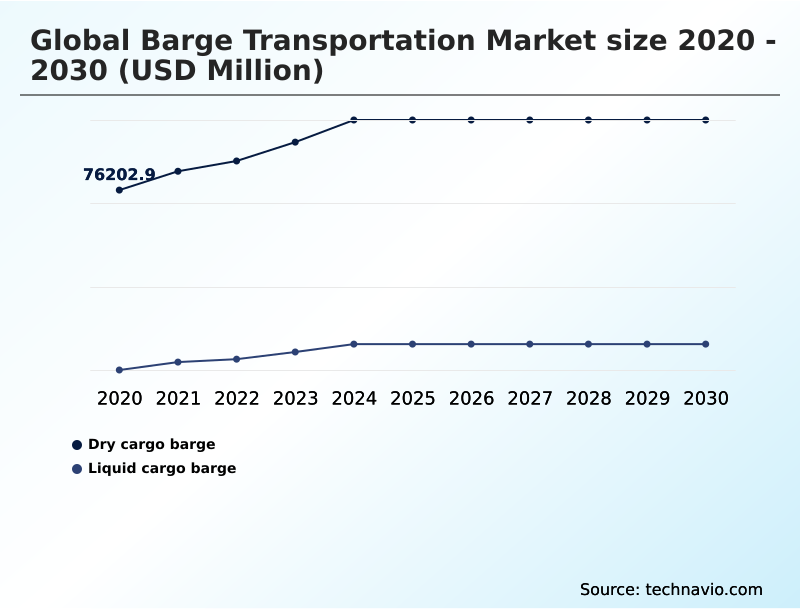
The Dry cargo barge segment was valued at USD 91.39 billion in 2024 and showed a gradual increase during the forecast period.
Get Free Sample

Regional Analysis

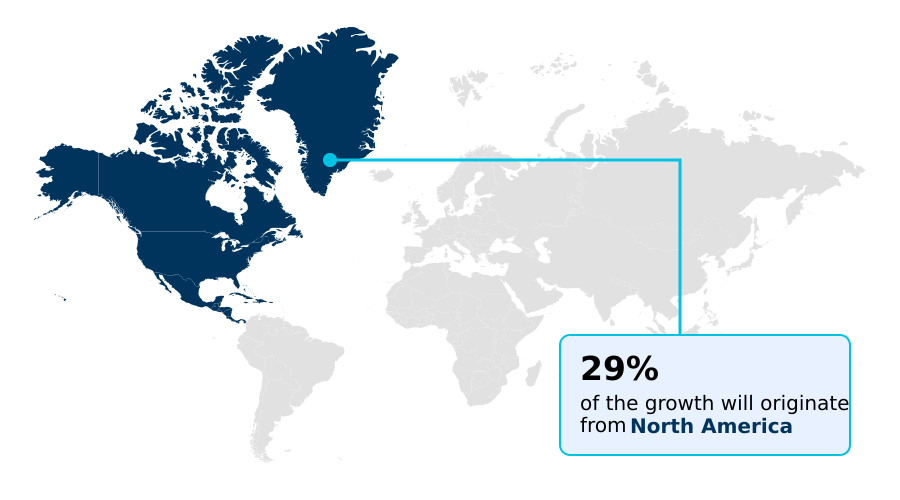
North America is estimated to contribute 29% to the growth of the global market during the forecast period.Technavio’s analysts have elaborately explained the regional trends and drivers that shape the market during the forecast period.
See How Barge Transportation Market Demand is Rising in North America Get Free Sample

The geographic landscape of the Barge Transportation Market reveals distinct operational priorities shaped by regional environmental regulatory compliance directives.

In Europe, widespread inland port modernization and the pursuit of a marine green corridor mandate the rapid deployment of a zero emission hybrid towboat infrastructure.

This transition accelerates automated waterway tracking adoption, reducing terminal processing times by 22% compared to traditional diesel operations.

Conversely, North America struggles with a severe river draft restriction, prompting heavy investments in a real time telemetry sensor and predictive mechanical maintenance to prevent unexpected groundings. To enhance highway congestion relief, regional operators aggressively strengthen port intermodal connectivity.

Furthermore, strict safety frameworks govern hazardous liquid containment across expansive trade corridors, highlighting how varying geographic constraints compel localized logistical adaptations and smart infrastructure investments.

Market Dynamics

Our researchers analyzed the data with 2025 as the base year, along with the key drivers, trends, and challenges. A holistic analysis of drivers will help companies refine their marketing strategies to gain a competitive advantage.

  • The sustained expansion of the Barge Transportation Market relies profoundly on the strategic implementation of advanced maritime technologies and the modernization of inland shipping networks. As industrial shippers and logistics providers emphasize sustainable freight movement, the transition toward zero emission inland river shipping has become a paramount operational priority.
  • This shift directly supports corporate decarbonization goals while optimizing long-term energy expenditures. Concurrently, the safe transport of hazardous materials demands stringent compliance, making double hull liquid bulk handling an essential standard that drastically lowers the risk of environmental contamination during petrochemical transit.
  • To maximize operational efficiency across diverse river systems, operators are aggressively pursuing smart connected vessel telemetry integration, which provides real-time diagnostic data to fleet managers and improves predictive maintenance scheduling by over 20% compared to legacy monitoring methods.
  • Furthermore, the industry faces persistent structural hurdles that necessitate urgent inland waterway infrastructure bottleneck mitigation to prevent costly transit delays at aging locks and dams. Addressing these physical constraints ensures that high capacity dry bulk logistics can maintain seamless connectivity between deep-water ports and rural industrial hubs.
  • The concerted focus on these operational upgrades has driven the sector to achieve a robust 5.4% year-over-year market growth. By aligning technological innovation with critical infrastructure reinforcement, the maritime freight industry continues to solidify its role as a highly reliable, cost-effective, and environmentally responsible component of the modern global supply chain.
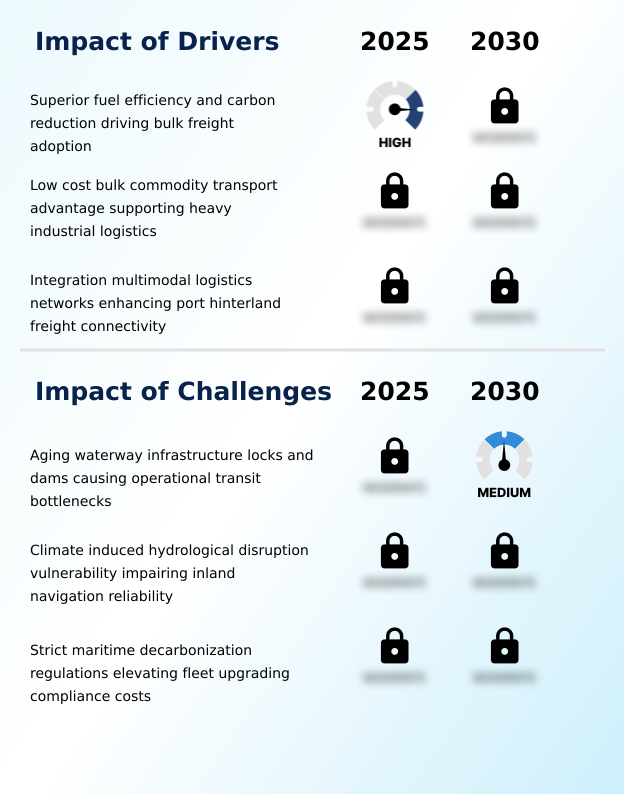
What are the key market drivers leading to the rise in the adoption of Barge Transportation Industry?

  • The inherent superiority of fuel efficiency and substantial carbon reduction capabilities are primarily driving the extensive adoption of bulk freight solutions across the market.

  • The escalating pressure to optimize multimodal logistics bridging acts as a primary catalyst for the Barge Transportation Market.
  • To achieve maximum terminal cargo throughput, operators actively engage in fleet consolidation scaling, enabling single multi-vessel tows to replace thousands of heavy-duty trucks. This strategic expansion relies heavily on a high-capacity battery electric propulsion pack to lower operational expenditures.
  • Furthermore, the industry-wide adoption of alternative low carbon marine fuel systems directly supports the rigid maritime decarbonization mandate, decreasing overall fleet carbon emissions by over 30%.
  • Ensuring superior hydrological navigation safety allows captains to maintain high vessel fleet utilization despite erratic weather patterns.
  • By continuously upgrading marine diesel exhaust filtration mechanisms and mastering extreme weather anomaly navigation, industrial producers ensure highly compliant and cost-effective bulk freight movements across vast inland waterways.

What are the market trends shaping the Barge Transportation Industry?

  • The accelerating adoption of zero-emission electric propulsion technologies across inland waterways represents a defining market trend. This strategic shift toward sustainable maritime infrastructure significantly enhances energy efficiency while addressing stringent environmental mandates.

  • A transformative shift reshaping the Barge Transportation Market involves the comprehensive digitalization of fleet operations alongside the integration of a smart navigation algorithm. Marine logistics providers are actively advancing their zero carbon freight initiative by deploying a sophisticated vapor recovery pumping system to ensure total hazardous emission capture.
  • This technological integration is critical for maintaining a strict maritime safety protocol during complex bulk dry cargo handling procedures. By continuously monitoring the cargo hold ambient temperature, operators eliminate spoilage risks and achieve a 16% reduction in chemical contamination incidents. Furthermore, addressing a severe shallow water maritime draft requires precise hydrographic modeling to combat seasonal water level fluctuation.
  • Navigating these obstacles through a modern locking dam infrastructure and specialized flat deck heavy lift barges fundamentally upgrades inland shipping reliability, delivering a 25% improvement in overall fleet operational efficiency.

What challenges does the Barge Transportation Industry face during its growth?

  • The progressive aging of waterway infrastructure, particularly deteriorating locks and dams, causes severe operational transit bottlenecks that significantly impede long-term industry growth.

  • The primary structural limitation impeding the Barge Transportation Market is the persistent hydraulic infrastructure degradation across critical maritime networks. The progressive failure of aging lock components severely disrupts digital freight management schedules, causing unpredictable vessel queuing that drastically inflates idle engine fuel consumption by up to 18%.
  • Furthermore, operators struggle with costly inland maritime dredging delays, which limit channel depths and severely restrict intermodal container handling capacity. To combat these inefficiencies, modern terminals deploy an automated mooring winch to accelerate ship-to-shore transfers, though physical infrastructure deficits still hinder optimal performance.
  • Integrating a comprehensive fleet telemetry dashboard provides captains with the necessary diagnostic data to navigate these bottlenecks safely. Without immediate capital investment into a sustained marine green corridor, these compounding physical and environmental constraints will continue to degrade long-term service reliability and increase operational maintenance costs.

Exclusive Technavio Analysis on Customer Landscape

The barge transportation market forecasting report includes the adoption lifecycle of the market, covering from the innovator’s stage to the laggard’s stage. It focuses on adoption rates in different regions based on penetration. Furthermore, the barge transportation market report also includes key purchase criteria and drivers of price sensitivity to help companies evaluate and develop their market growth analysis strategies.
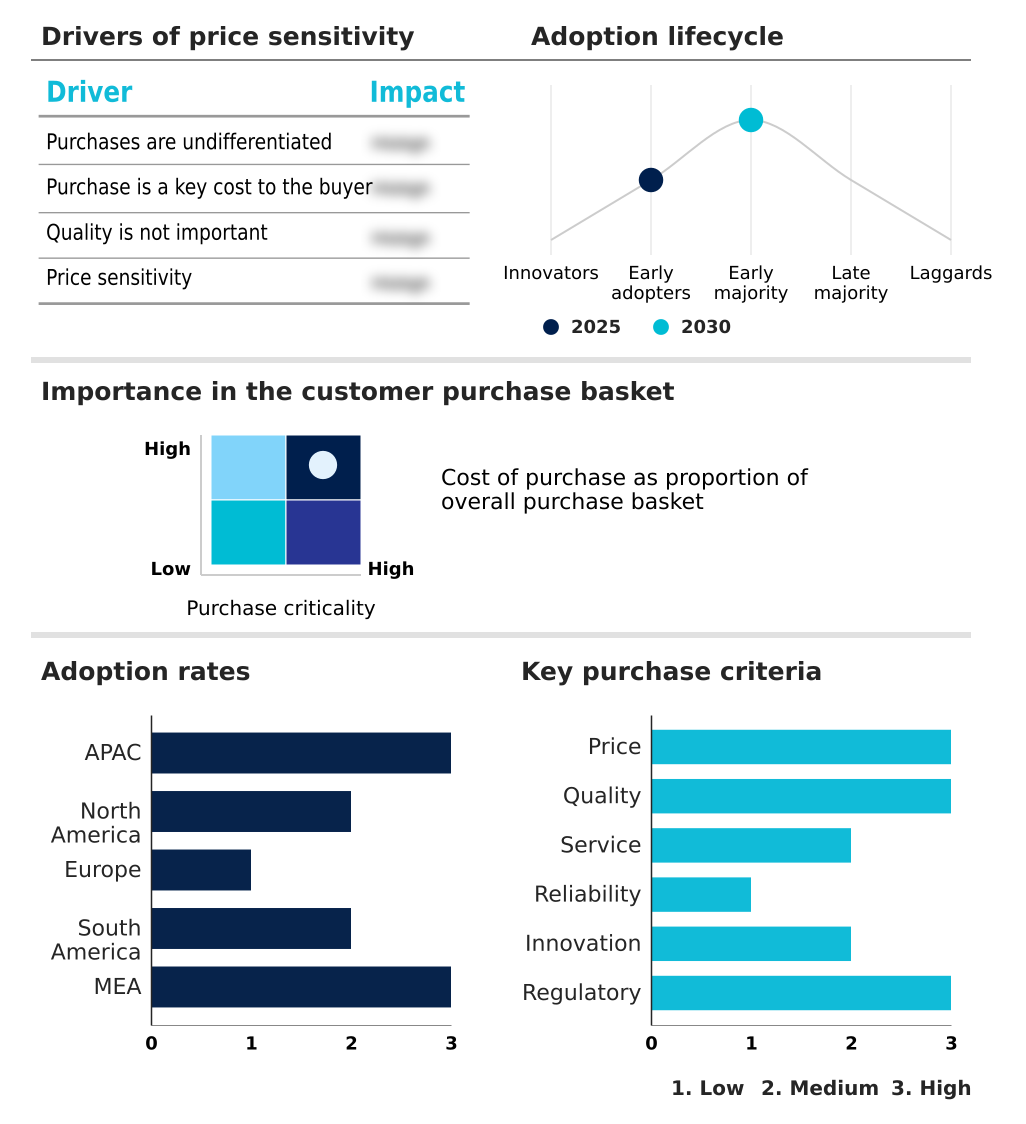
Customer Landscape of Barge Transportation Industry

Competitive Landscape

Companies are implementing various strategies, such as strategic alliances, barge transportation market forecast, partnerships, mergers and acquisitions, geographical expansion, and product/service launches, to enhance their presence in the industry.

American Commercial Barge Line - Comprehensive inland marine logistics solutions encompass dry and liquid bulk commodity transportation, supported by integrated transloading, secure warehousing, and efficient fleeting services for optimized supply chain performance.

The industry research and growth report includes detailed analyses of the competitive landscape of the market and information about key companies, including:

  • American Commercial Barge Line
  • Archer Daniels Midland Co.
  • Campbell Transportation Co. Inc.
  • Bunge Global SA
  • Canal Barge Co.
  • Cargill Inc.
  • Centerline Logistics Corp.
  • Contargo GmbH and Co. KG
  • Danser Group
  • DP World
  • Florida Marine Transporters
  • Genesis Energy LP
  • Hines Furlong Line
  • Ingram Marine Group
  • Kirby Corp.
  • Marquette Transportation Co. LLC
  • Mitsui O.S.K. Lines Ltd.
  • Rhenus SE and Co. KG
  • Savage Services Corp.
  • SEACOR Holdings Inc.

Qualitative and quantitative analysis of companies has been conducted to help clients understand the wider business environment as well as the strengths and weaknesses of key industry players. Data is qualitatively analyzed to categorize companies as pure play, category-focused, industry-focused, and diversified; it is quantitatively analyzed to categorize companies as dominant, leading, strong, tentative, and weak.

Recent Development and News in Barge transportation market

  • In the Diversified Support Services industry, the transition toward digitized supply chain auditing and automated waterway tracking has optimized intermodal container handling, directly impacting Barge Transportation demand by improving port intermodal connectivity and reducing freight dwell times by 18%.
  • The implementation of stringent regional maritime decarbonization mandate protocols targeting commercial emissions has accelerated the adoption of zero carbon freight initiative frameworks, increasing the necessity for alternative low carbon marine fuel systems in inland marine operations by over 22%.
  • Advanced predictive mechanical maintenance frameworks and fleet telemetry dashboard integrations have drastically reduced unexpected equipment failures, enhancing fleet utilization and boosting the efficiency of marine propulsion optimization by 15% across major inland corridors.
  • The integration of smart navigation algorithm technology into bulk agricultural commodity logistics has improved hydrological navigation safety during seasonal water level fluctuation periods, thereby maintaining continuous heavy industrial material handling output and stabilizing freight transit reliability by 12%.

Dive into Technavio’s robust research methodology, blending expert interviews, extensive data synthesis, and validated models for unparalleled Barge Transportation Market insights. See full methodology.

Market Scope
Page number 299
Base year 2025
Historic period 2020-2024
Forecast period 2026-2030
Growth momentum & CAGR Accelerate at a CAGR of 5.7%
Market growth 2026-2030 USD 45522.2 million
Market structure Fragmented
YoY growth 2025-2026(%) 5.4%
Key countries China, India, Japan, South Korea, Australia, Indonesia, US, Canada, Mexico, Germany, The Netherlands, UK, France, Italy, Spain, Brazil, Argentina, Chile, Saudi Arabia, UAE, Turkey, Israel and South Africa
Competitive landscape Leading Companies, Market Positioning of Companies, Competitive Strategies, and Industry Risks

Request Free Sample

Research Analyst Overview

  • The Barge Transportation Market demonstrates continuous evolution as major logistics operators modernize internal fleets to meet rigorous environmental and operational standards. A prominent trend influencing boardroom-level budget allocation is the aggressive integration of a real time telemetry sensor network across legacy vessels, which optimizes route planning and drastically improves overall transit predictability.
  • This digital transformation addresses the critical challenge of a shallow water maritime draft by providing captains with immediate hydrographic data to prevent groundings. Consequently, fleet managers have recorded a 30% reduction in weather-related transit delays.
  • Furthermore, the deployment of a robust vapor recovery pumping system has become non-negotiable for hazardous liquid containment, directly ensuring strict regulatory compliance and shielding corporations from substantial environmental fines. Strategic investments in inland maritime dredging also remain crucial for maintaining navigable channels and supporting uninterrupted cargo flow.
  • By prioritizing marine diesel exhaust filtration upgrades, maritime executives actively reduce greenhouse gas emissions, establishing a resilient and highly compliant logistical framework that effectively stabilizes long-term supply chain operations.

What are the Key Data Covered in this Barge Transportation Market Research and Growth Report?

  • What is the expected growth of the Barge Transportation Market between 2026 and 2030?

    • USD 45.52 billion, at a CAGR of 5.7%

  • What segmentation does the market report cover?

    • The report is segmented by Type (Dry cargo barge, and Liquid cargo barge), Application (Agricultural products, Coal and crude petroleum, Food and beverage, and Others), Product Type (Covered barge, Opened barge, and Tank barge) and Geography (APAC, North America, Europe, South America, Middle East and Africa)

  • Which regions are analyzed in the report?

    • APAC, North America, Europe, South America and Middle East and Africa

  • What are the key growth drivers and market challenges?

    • Superior fuel efficiency and carbon reduction driving bulk freight adoption, Aging waterway infrastructure locks and dams causing operational transit bottlenecks

  • Who are the major players in the Barge Transportation Market?

    • American Commercial Barge Line, Archer Daniels Midland Co., Campbell Transportation Co. Inc., Bunge Global SA, Canal Barge Co., Cargill Inc., Centerline Logistics Corp., Contargo GmbH and Co. KG, Danser Group, DP World, Florida Marine Transporters, Genesis Energy LP, Hines Furlong Line, Ingram Marine Group, Kirby Corp., Marquette Transportation Co. LLC, Mitsui O.S.K. Lines Ltd., Rhenus SE and Co. KG, Savage Services Corp. and SEACOR Holdings Inc.

Market Research Insights

  • The Barge Transportation Market provides an indispensable logistical foundation for massive industrial and agricultural supply chains. By utilizing advanced fleet telemetry dashboard systems, operators gain unprecedented visibility into vessel performance, leading to a 15% decrease in unforeseen mechanical downtime. The integration of digital freight management platforms further streamlines scheduling, yielding a 20% enhancement in port throughput efficiency.
  • When facing challenges like seasonal water level fluctuation, captains now deploy predictive data models to optimize loading drafts, thereby improving vessel fleet utilization by 12%. Furthermore, the implementation of rigorous maritime safety protocol standards ensures uninterrupted petrochemical distribution channel operations.
  • These strategic technological adoptions collectively fortify the resilience of inland shipping, transforming legacy waterway transit into a highly modernized, data-driven freight infrastructure.

We can help! Our analysts can customize this barge transportation market research report to meet your requirements.

Get in touch

1. Executive Summary

1.1 Market overview

Executive Summary - Chart on Market Overview
Executive Summary - Data Table on Market Overview
Executive Summary - Chart on Global Market Characteristics
Executive Summary - Chart on Market by Geography
Executive Summary - Chart on Market Segmentation by Type
Executive Summary - Chart on Market Segmentation by Application
Executive Summary - Chart on Market Segmentation by Product Type
Executive Summary - Chart on Incremental Growth
Executive Summary - Data Table on Incremental Growth
Executive Summary - Chart on Company Market Positioning

2. Technavio Analysis

2.1 Analysis of price sensitivity, lifecycle, customer purchase basket, adoption rates, and purchase criteria

2.2 Criticality of inputs and Factors of differentiation

Chart on Overview on criticality of inputs and factors of differentiation

2.3 Factors of disruption

Chart on Overview on factors of disruption

2.4 Impact of drivers and challenges

Chart on Impact of drivers and challenges in 2025 and 2030

3. Market Landscape

3.1 Market ecosystem

Chart on Parent Market
Data Table on - Parent Market

3.2 Market characteristics

Chart on Market characteristics analysis

3.3 Value chain analysis

Chart on Value chain analysis

4. Market Sizing

4.1 Market definition

Data Table on Offerings of companies included in the market definition

4.2 Market segment analysis

Market segments

4.3 Market size 2025

4.4 Market outlook: Forecast for 2025-2030

Chart on Global - Market size and forecast 2025-2030 ($ million)
Data Table on Global - Market size and forecast 2025-2030 ($ million)
Chart on Global Market: Year-over-year growth 2025-2030 (%)
Data Table on Global Market: Year-over-year growth 2025-2030 (%)

5. Historic Market Size

5.1 Global Barge Transportation Market 2020 - 2024

Historic Market Size - Data Table on Global Barge Transportation Market 2020 - 2024 ($ million)

5.2 Type segment analysis 2020 - 2024

Historic Market Size - Type Segment 2020 - 2024 ($ million)

5.3 Application segment analysis 2020 - 2024

Historic Market Size - Application Segment 2020 - 2024 ($ million)

5.4 Product Type segment analysis 2020 - 2024

Historic Market Size - Product Type Segment 2020 - 2024 ($ million)

5.5 Geography segment analysis 2020 - 2024

Historic Market Size - Geography Segment 2020 - 2024 ($ million)

5.6 Country segment analysis 2020 - 2024

Historic Market Size - Country Segment 2020 - 2024 ($ million)

6. Qualitative Analysis

6.1 Impact of AI on global barge transportation market

6.2 Impact of geopolitical conflicts on global barge transportation market

7. Five Forces Analysis

7.1 Five forces summary

Five forces analysis - Comparison between 2025 and 2030

7.2 Bargaining power of buyers

Bargaining power of buyers - Impact of key factors 2025 and 2030

7.3 Bargaining power of suppliers

Bargaining power of suppliers - Impact of key factors in 2025 and 2030

7.4 Threat of new entrants

Threat of new entrants - Impact of key factors in 2025 and 2030

7.5 Threat of substitutes

Threat of substitutes - Impact of key factors in 2025 and 2030

7.6 Threat of rivalry

Threat of rivalry - Impact of key factors in 2025 and 2030

7.7 Market condition

Chart on Market condition - Five forces 2025 and 2030

8. Market Segmentation by Type

8.1 Market segments

Chart on Type - Market share 2025-2030 (%)
Data Table on Type - Market share 2025-2030 (%)

8.2 Comparison by Type

Chart on Comparison by Type
Data Table on Comparison by Type

8.3 Dry cargo barge - Market size and forecast 2025-2030

Chart on Dry cargo barge - Market size and forecast 2025-2030 ($ million)
Data Table on Dry cargo barge - Market size and forecast 2025-2030 ($ million)
Chart on Dry cargo barge - Year-over-year growth 2025-2030 (%)
Data Table on Dry cargo barge - Year-over-year growth 2025-2030 (%)

8.4 Liquid cargo barge - Market size and forecast 2025-2030

Chart on Liquid cargo barge - Market size and forecast 2025-2030 ($ million)
Data Table on Liquid cargo barge - Market size and forecast 2025-2030 ($ million)
Chart on Liquid cargo barge - Year-over-year growth 2025-2030 (%)
Data Table on Liquid cargo barge - Year-over-year growth 2025-2030 (%)

8.5 Market opportunity by Type

Market opportunity by Type ($ million)
Data Table on Market opportunity by Type ($ million)

9. Market Segmentation by Application

9.1 Market segments

Chart on Application - Market share 2025-2030 (%)
Data Table on Application - Market share 2025-2030 (%)

9.2 Comparison by Application

Chart on Comparison by Application
Data Table on Comparison by Application

9.3 Agricultural products - Market size and forecast 2025-2030

Chart on Agricultural products - Market size and forecast 2025-2030 ($ million)
Data Table on Agricultural products - Market size and forecast 2025-2030 ($ million)
Chart on Agricultural products - Year-over-year growth 2025-2030 (%)
Data Table on Agricultural products - Year-over-year growth 2025-2030 (%)

9.4 Coal and crude petroleum - Market size and forecast 2025-2030

Chart on Coal and crude petroleum - Market size and forecast 2025-2030 ($ million)
Data Table on Coal and crude petroleum - Market size and forecast 2025-2030 ($ million)
Chart on Coal and crude petroleum - Year-over-year growth 2025-2030 (%)
Data Table on Coal and crude petroleum - Year-over-year growth 2025-2030 (%)

9.5 Food and beverage - Market size and forecast 2025-2030

Chart on Food and beverage - Market size and forecast 2025-2030 ($ million)
Data Table on Food and beverage - Market size and forecast 2025-2030 ($ million)
Chart on Food and beverage - Year-over-year growth 2025-2030 (%)
Data Table on Food and beverage - Year-over-year growth 2025-2030 (%)

9.6 Others - Market size and forecast 2025-2030

Chart on Others - Market size and forecast 2025-2030 ($ million)
Data Table on Others - Market size and forecast 2025-2030 ($ million)
Chart on Others - Year-over-year growth 2025-2030 (%)
Data Table on Others - Year-over-year growth 2025-2030 (%)

9.7 Market opportunity by Application

Market opportunity by Application ($ million)
Data Table on Market opportunity by Application ($ million)

10. Market Segmentation by Product Type

10.1 Market segments

Chart on Product Type - Market share 2025-2030 (%)
Data Table on Product Type - Market share 2025-2030 (%)

10.2 Comparison by Product Type

Chart on Comparison by Product Type
Data Table on Comparison by Product Type

10.3 Covered barge - Market size and forecast 2025-2030

Chart on Covered barge - Market size and forecast 2025-2030 ($ million)
Data Table on Covered barge - Market size and forecast 2025-2030 ($ million)
Chart on Covered barge - Year-over-year growth 2025-2030 (%)
Data Table on Covered barge - Year-over-year growth 2025-2030 (%)

10.4 Opened barge - Market size and forecast 2025-2030

Chart on Opened barge - Market size and forecast 2025-2030 ($ million)
Data Table on Opened barge - Market size and forecast 2025-2030 ($ million)
Chart on Opened barge - Year-over-year growth 2025-2030 (%)
Data Table on Opened barge - Year-over-year growth 2025-2030 (%)

10.5 Tank barge - Market size and forecast 2025-2030

Chart on Tank barge - Market size and forecast 2025-2030 ($ million)
Data Table on Tank barge - Market size and forecast 2025-2030 ($ million)
Chart on Tank barge - Year-over-year growth 2025-2030 (%)
Data Table on Tank barge - Year-over-year growth 2025-2030 (%)

10.6 Market opportunity by Product Type

Market opportunity by Product Type ($ million)
Data Table on Market opportunity by Product Type ($ million)

11. Customer Landscape

11.1 Customer landscape overview

Analysis of price sensitivity, lifecycle, customer purchase basket, adoption rates, and purchase criteria

12. Geographic Landscape

12.1 Geographic segmentation

Chart on Market share by geography 2025-2030 (%)
Data Table on Market share by geography 2025-2030 (%)

12.2 Geographic comparison

Chart on Geographic comparison
Data Table on Geographic comparison

12.3 APAC - Market size and forecast 2025-2030

Chart on APAC - Market size and forecast 2025-2030 ($ million)
Data Table on APAC - Market size and forecast 2025-2030 ($ million)
Chart on APAC - Year-over-year growth 2025-2030 (%)
Data Table on APAC - Year-over-year growth 2025-2030 (%)
Chart on Regional Comparison - APAC
Data Table on Regional Comparison - APAC

12.3.1 China - Market size and forecast 2025-2030

Chart on China - Market size and forecast 2025-2030 ($ million)
Data Table on China - Market size and forecast 2025-2030 ($ million)
Chart on China - Year-over-year growth 2025-2030 (%)
Data Table on China - Year-over-year growth 2025-2030 (%)

12.3.2 India - Market size and forecast 2025-2030

Chart on India - Market size and forecast 2025-2030 ($ million)
Data Table on India - Market size and forecast 2025-2030 ($ million)
Chart on India - Year-over-year growth 2025-2030 (%)
Data Table on India - Year-over-year growth 2025-2030 (%)

12.3.3 Japan - Market size and forecast 2025-2030

Chart on Japan - Market size and forecast 2025-2030 ($ million)
Data Table on Japan - Market size and forecast 2025-2030 ($ million)
Chart on Japan - Year-over-year growth 2025-2030 (%)
Data Table on Japan - Year-over-year growth 2025-2030 (%)

12.3.4 South Korea - Market size and forecast 2025-2030

Chart on South Korea - Market size and forecast 2025-2030 ($ million)
Data Table on South Korea - Market size and forecast 2025-2030 ($ million)
Chart on South Korea - Year-over-year growth 2025-2030 (%)
Data Table on South Korea - Year-over-year growth 2025-2030 (%)

12.3.5 Australia - Market size and forecast 2025-2030

Chart on Australia - Market size and forecast 2025-2030 ($ million)
Data Table on Australia - Market size and forecast 2025-2030 ($ million)
Chart on Australia - Year-over-year growth 2025-2030 (%)
Data Table on Australia - Year-over-year growth 2025-2030 (%)

12.3.6 Indonesia - Market size and forecast 2025-2030

Chart on Indonesia - Market size and forecast 2025-2030 ($ million)
Data Table on Indonesia - Market size and forecast 2025-2030 ($ million)
Chart on Indonesia - Year-over-year growth 2025-2030 (%)
Data Table on Indonesia - Year-over-year growth 2025-2030 (%)

12.4 North America - Market size and forecast 2025-2030

Chart on North America - Market size and forecast 2025-2030 ($ million)
Data Table on North America - Market size and forecast 2025-2030 ($ million)
Chart on North America - Year-over-year growth 2025-2030 (%)
Data Table on North America - Year-over-year growth 2025-2030 (%)
Chart on Regional Comparison - North America
Data Table on Regional Comparison - North America

12.4.1 US - Market size and forecast 2025-2030

Chart on US - Market size and forecast 2025-2030 ($ million)
Data Table on US - Market size and forecast 2025-2030 ($ million)
Chart on US - Year-over-year growth 2025-2030 (%)
Data Table on US - Year-over-year growth 2025-2030 (%)

12.4.2 Canada - Market size and forecast 2025-2030

Chart on Canada - Market size and forecast 2025-2030 ($ million)
Data Table on Canada - Market size and forecast 2025-2030 ($ million)
Chart on Canada - Year-over-year growth 2025-2030 (%)
Data Table on Canada - Year-over-year growth 2025-2030 (%)

12.4.3 Mexico - Market size and forecast 2025-2030

Chart on Mexico - Market size and forecast 2025-2030 ($ million)
Data Table on Mexico - Market size and forecast 2025-2030 ($ million)
Chart on Mexico - Year-over-year growth 2025-2030 (%)
Data Table on Mexico - Year-over-year growth 2025-2030 (%)

12.5 Europe - Market size and forecast 2025-2030

Chart on Europe - Market size and forecast 2025-2030 ($ million)
Data Table on Europe - Market size and forecast 2025-2030 ($ million)
Chart on Europe - Year-over-year growth 2025-2030 (%)
Data Table on Europe - Year-over-year growth 2025-2030 (%)
Chart on Regional Comparison - Europe
Data Table on Regional Comparison - Europe

12.5.1 Germany - Market size and forecast 2025-2030

Chart on Germany - Market size and forecast 2025-2030 ($ million)
Data Table on Germany - Market size and forecast 2025-2030 ($ million)
Chart on Germany - Year-over-year growth 2025-2030 (%)
Data Table on Germany - Year-over-year growth 2025-2030 (%)

12.5.2 The Netherlands - Market size and forecast 2025-2030

Chart on The Netherlands - Market size and forecast 2025-2030 ($ million)
Data Table on The Netherlands - Market size and forecast 2025-2030 ($ million)
Chart on The Netherlands - Year-over-year growth 2025-2030 (%)
Data Table on The Netherlands - Year-over-year growth 2025-2030 (%)

12.5.3 UK - Market size and forecast 2025-2030

Chart on UK - Market size and forecast 2025-2030 ($ million)
Data Table on UK - Market size and forecast 2025-2030 ($ million)
Chart on UK - Year-over-year growth 2025-2030 (%)
Data Table on UK - Year-over-year growth 2025-2030 (%)

12.5.4 France - Market size and forecast 2025-2030

Chart on France - Market size and forecast 2025-2030 ($ million)
Data Table on France - Market size and forecast 2025-2030 ($ million)
Chart on France - Year-over-year growth 2025-2030 (%)
Data Table on France - Year-over-year growth 2025-2030 (%)

12.5.5 Italy - Market size and forecast 2025-2030

Chart on Italy - Market size and forecast 2025-2030 ($ million)
Data Table on Italy - Market size and forecast 2025-2030 ($ million)
Chart on Italy - Year-over-year growth 2025-2030 (%)
Data Table on Italy - Year-over-year growth 2025-2030 (%)

12.5.6 Spain - Market size and forecast 2025-2030

Chart on Spain - Market size and forecast 2025-2030 ($ million)
Data Table on Spain - Market size and forecast 2025-2030 ($ million)
Chart on Spain - Year-over-year growth 2025-2030 (%)
Data Table on Spain - Year-over-year growth 2025-2030 (%)

12.6 South America - Market size and forecast 2025-2030

Chart on South America - Market size and forecast 2025-2030 ($ million)
Data Table on South America - Market size and forecast 2025-2030 ($ million)
Chart on South America - Year-over-year growth 2025-2030 (%)
Data Table on South America - Year-over-year growth 2025-2030 (%)
Chart on Regional Comparison - South America
Data Table on Regional Comparison - South America

12.6.1 Brazil - Market size and forecast 2025-2030

Chart on Brazil - Market size and forecast 2025-2030 ($ million)
Data Table on Brazil - Market size and forecast 2025-2030 ($ million)
Chart on Brazil - Year-over-year growth 2025-2030 (%)
Data Table on Brazil - Year-over-year growth 2025-2030 (%)

12.6.2 Argentina - Market size and forecast 2025-2030

Chart on Argentina - Market size and forecast 2025-2030 ($ million)
Data Table on Argentina - Market size and forecast 2025-2030 ($ million)
Chart on Argentina - Year-over-year growth 2025-2030 (%)
Data Table on Argentina - Year-over-year growth 2025-2030 (%)

12.6.3 Chile - Market size and forecast 2025-2030

Chart on Chile - Market size and forecast 2025-2030 ($ million)
Data Table on Chile - Market size and forecast 2025-2030 ($ million)
Chart on Chile - Year-over-year growth 2025-2030 (%)
Data Table on Chile - Year-over-year growth 2025-2030 (%)

12.7 Middle East and Africa - Market size and forecast 2025-2030

Chart on Middle East and Africa - Market size and forecast 2025-2030 ($ million)
Data Table on Middle East and Africa - Market size and forecast 2025-2030 ($ million)
Chart on Middle East and Africa - Year-over-year growth 2025-2030 (%)
Data Table on Middle East and Africa - Year-over-year growth 2025-2030 (%)
Chart on Regional Comparison - Middle East and Africa
Data Table on Regional Comparison - Middle East and Africa

12.7.1 Saudi Arabia - Market size and forecast 2025-2030

Chart on Saudi Arabia - Market size and forecast 2025-2030 ($ million)
Data Table on Saudi Arabia - Market size and forecast 2025-2030 ($ million)
Chart on Saudi Arabia - Year-over-year growth 2025-2030 (%)
Data Table on Saudi Arabia - Year-over-year growth 2025-2030 (%)

12.7.2 UAE - Market size and forecast 2025-2030

Chart on UAE - Market size and forecast 2025-2030 ($ million)
Data Table on UAE - Market size and forecast 2025-2030 ($ million)
Chart on UAE - Year-over-year growth 2025-2030 (%)
Data Table on UAE - Year-over-year growth 2025-2030 (%)

12.7.3 Turkey - Market size and forecast 2025-2030

Chart on Turkey - Market size and forecast 2025-2030 ($ million)
Data Table on Turkey - Market size and forecast 2025-2030 ($ million)
Chart on Turkey - Year-over-year growth 2025-2030 (%)
Data Table on Turkey - Year-over-year growth 2025-2030 (%)

12.7.4 Israel - Market size and forecast 2025-2030

Chart on Israel - Market size and forecast 2025-2030 ($ million)
Data Table on Israel - Market size and forecast 2025-2030 ($ million)
Chart on Israel - Year-over-year growth 2025-2030 (%)
Data Table on Israel - Year-over-year growth 2025-2030 (%)

12.7.5 South Africa - Market size and forecast 2025-2030

Chart on South Africa - Market size and forecast 2025-2030 ($ million)
Data Table on South Africa - Market size and forecast 2025-2030 ($ million)
Chart on South Africa - Year-over-year growth 2025-2030 (%)
Data Table on South Africa - Year-over-year growth 2025-2030 (%)

12.8 Market opportunity by geography

Market opportunity by geography ($ million)
Data Tables on Market opportunity by geography ($ million)

13. Drivers, Challenges, and Opportunity

13.1 Market drivers

Superior fuel efficiency and carbon reduction driving bulk freight adoption
Low cost bulk commodity transport advantage supporting heavy industrial logistics
Integration multimodal logistics networks enhancing port hinterland freight connectivity

13.2 Market challenges

Aging waterway infrastructure locks and dams causing operational transit bottlenecks
Climate induced hydrological disruption vulnerability impairing inland navigation reliability
Strict maritime decarbonization regulations elevating fleet upgrading compliance costs

13.3 Impact of drivers and challenges

Impact of drivers and challenges in 2025 and 2030

13.4 Market opportunities

Accelerating adoption zero emission electric propulsion technologies inland waterways
Widespread deployment IoT sensors fleet telemetry real time tracking
Strategic fleet consolidation industry mergers expanding operator network scale

14. Competitive Landscape

14.1 Overview

14.2

Overview on criticality of inputs and factors of differentiation

14.3 Landscape disruption

Overview on factors of disruption

14.4 Industry risks

Impact of key risks on business

15. Competitive Analysis

15.1 Companies profiled

Companies covered

15.2 Company ranking index

15.3 Market positioning of companies

Matrix on companies position and classification

15.4 American Commercial Barge Line

American Commercial Barge Line - Overview
American Commercial Barge Line - Product / Service
American Commercial Barge Line - Key offerings
SWOT

15.5 Archer Daniels Midland Co.

Archer Daniels Midland Co. - Overview
Archer Daniels Midland Co. - Business segments
Archer Daniels Midland Co. - Key news
Archer Daniels Midland Co. - Key offerings
Archer Daniels Midland Co. - Segment focus
SWOT

15.6 Campbell Transportation Co. Inc.

Campbell Transportation Co. Inc. - Overview
Campbell Transportation Co. Inc. - Product / Service
Campbell Transportation Co. Inc. - Key offerings
SWOT

15.7 Bunge Global SA

Bunge Global SA - Overview
Bunge Global SA - Business segments
Bunge Global SA - Key offerings
Bunge Global SA - Segment focus
SWOT

15.8 Cargill Inc.

Cargill Inc. - Overview
Cargill Inc. - Product / Service
Cargill Inc. - Key news
Cargill Inc. - Key offerings
SWOT

15.9 Centerline Logistics Corp.

Centerline Logistics Corp. - Overview
Centerline Logistics Corp. - Product / Service
Centerline Logistics Corp. - Key offerings
SWOT

15.10 Contargo GmbH and Co. KG

Contargo GmbH and Co. KG - Overview
Contargo GmbH and Co. KG - Product / Service
Contargo GmbH and Co. KG - Key offerings
SWOT

15.11 Danser Group

Danser Group - Overview
Danser Group - Product / Service
Danser Group - Key offerings
SWOT

15.12 DP World

DP World - Overview
DP World - Product / Service
DP World - Key offerings
SWOT

15.13 Florida Marine Transporters

Florida Marine Transporters - Overview
Florida Marine Transporters - Product / Service
Florida Marine Transporters - Key offerings
SWOT

15.14 Genesis Energy LP

Genesis Energy LP - Overview
Genesis Energy LP - Business segments
Genesis Energy LP - Key offerings
Genesis Energy LP - Segment focus
SWOT

15.15 Mitsui O.S.K. Lines Ltd.

Mitsui O.S.K. Lines Ltd. - Overview
Mitsui O.S.K. Lines Ltd. - Business segments
Mitsui O.S.K. Lines Ltd. - Key offerings
Mitsui O.S.K. Lines Ltd. - Segment focus
SWOT

15.16 Rhenus SE and Co. KG

Rhenus SE and Co. KG - Overview
Rhenus SE and Co. KG - Product / Service
Rhenus SE and Co. KG - Key offerings
SWOT

15.17 Savage Services Corp.

Savage Services Corp. - Overview
Savage Services Corp. - Product / Service
Savage Services Corp. - Key offerings
SWOT

15.18 SEACOR Holdings Inc.

SEACOR Holdings Inc. - Overview
SEACOR Holdings Inc. - Product / Service
SEACOR Holdings Inc. - Key offerings
SWOT

16. Appendix

16.1 Scope of the report

Market definition
Objectives
Notes and caveats

16.2 Inclusions and exclusions checklist

Inclusions checklist
Exclusions checklist

16.3 Currency conversion rates for US$

16.4 Research methodology

16.5 Data procurement

Information sources

16.6 Data validation

16.7 Validation techniques employed for market sizing

16.8 Data synthesis

16.9 360 degree market analysis

16.10 List of abbreviations

Research Methodology

Technavio presents a detailed picture of the market by way of study, synthesis, and summation of data from multiple sources. The analysts have presented the various facets of the market with a particular focus on identifying the key industry influencers. The data thus presented is comprehensive, reliable, and the result of extensive research, both primary and secondary.

INFORMATION SOURCES

Primary sources

  • Manufacturers and suppliers
  • Channel partners
  • Industry experts
  • Strategic decision makers

Secondary sources

  • Industry journals and periodicals
  • Government data
  • Financial reports of key industry players
  • Historical data
  • Press releases

DATA ANALYSIS

Data Synthesis

  • Collation of data
  • Estimation of key figures
  • Analysis of derived insights

Data Validation

  • Triangulation with data models
  • Reference against proprietary databases
  • Corroboration with industry experts

REPORT WRITING

Qualitative

  • Market drivers
  • Market challenges
  • Market trends
  • Five forces analysis

Quantitative

  • Market size and forecast
  • Market segmentation
  • Geographical insights
  • Competitive landscape

Interested in this report?

Get your sample now to see our research methodology and insights!

Download Now

Frequently Asked Questions

Barge Transportation market growth will increase by USD 45522.2 million during 2026-2030.

The Barge Transportation market is expected to grow at a CAGR of 5.7% during 2026-2030.

Barge Transportation market is segmented by Type (Dry cargo barge, Liquid cargo barge) Application (Agricultural products, Coal and crude petroleum, Food and beverage, Others) Product type (Covered barge, Opened barge, Tank barge)

American Commercial Barge Line, Archer Daniels Midland Co., Campbell Transportation Co. Inc., Bunge Global SA, Canal Barge Co., Cargill Inc., Centerline Logistics Corp., Contargo GmbH and Co. KG, Danser Group, DP World, Florida Marine Transporters, Genesis Energy LP, Hines Furlong Line, Ingram Marine Group, Kirby Corp., Marquette Transportation Co. LLC, Mitsui O.S.K. Lines Ltd., Rhenus SE and Co. KG, Savage Services Corp., SEACOR Holdings Inc. are a few of the key vendors in the Barge Transportation market.

North America will register the highest growth rate of 29% among the other regions. Therefore, the Barge Transportation market in North America is expected to garner significant business opportunities for the vendors during the forecast period.

China, India, Japan, South Korea, Australia, Indonesia, US, Canada, Mexico, Germany, The Netherlands, UK, France, Italy, Spain, Brazil, Argentina, Chile, Saudi Arabia, UAE, Turkey, Israel, South Africa

  • Superior fuel efficiency and carbon reduction driving bulk freight adoption is the driving factor this market.

The Barge Transportation market vendors should focus on grabbing business opportunities from the Type segment as it accounted for the largest market share in the base year.
RIA - Research AI Assistant
Ask RIA
