Biobanking Market Analysis, Size, and Forecast 2026-2030: Europe (Germany, UK, and France), North America (US, Canada, and Mexico), Asia (China, Japan, and India), South America (Brazil, Argentina, and Colombia), Middle East and Africa (Saudi Arabia, UAE, and South Africa), Rest of World (ROW)

Biobanking Market Analysis, Size, and Forecast 2026-2030:
Europe (Germany, UK, and France), North America (US, Canada, and Mexico), Asia (China, Japan, and India), South America (Brazil, Argentina, and Colombia), Middle East and Africa (Saudi Arabia, UAE, and South Africa), Rest of World (ROW)

Published: Oct 2026 296 Pages SKU: IRTNTR70756

Market Overview at a Glance

$1.99 B
Market Opportunity
9.2%
CAGR 2025 - 2030
36.6%
Europe Growth
$2.61 B
Physical segment 2024

Biobanking Market Size 2026-2030

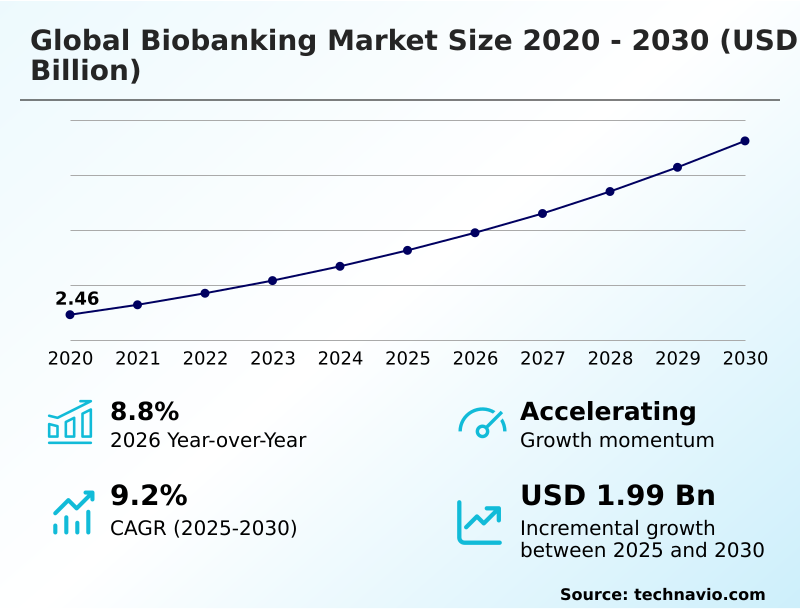
The biobanking market size is valued to increase by USD 1.99 billion, at a CAGR of 9.2% from 2025 to 2030. Increasing prevalence of chronic and genetic diseases will drive the biobanking market.

Major Market Trends & Insights

  • Europe dominated the market and accounted for a 36.6% growth during the forecast period.
  • By Type - Physical segment was valued at USD 2.61 billion in 2024
  • By Product - Equipment segment accounted for the largest market revenue share in 2024

Market Size & Forecast

  • Market Opportunities: USD 3.17 billion
  • Market Future Opportunities: USD 1.99 billion
  • CAGR from 2025 to 2030 : 9.2%

Market Summary

  • The Biobanking Market operates as a foundational infrastructure for modern biomedical advancement by providing highly regulated preservation of critical biological assets. Organizations are continuously optimizing supply chain logistics to maintain strict temperature controls during specimen transit, thereby ensuring long-term viability. Facilities upgrading to automated inventory management solutions have reduced specimen retrieval errors by over 15%, significantly enhancing laboratory efficiency.
  • The increasing incidence of chronic and genetic conditions acts as a major catalyst, forcing research institutions to expand their disease-specific collections to support targeted therapeutic development. Conversely, the high operational costs associated with cryogenic storage infrastructure severely constrain budget allocations, limiting the scaling capabilities of smaller academic repositories.
  • These interconnected factors compel repository managers to balance sophisticated preservation techniques with stringent cost-efficiency measures. High-quality biospecimen collection protocols remain essential for generating reproducible clinical outcomes across diverse research programs. Ultimately, advanced biological sample tracking capabilities empower researchers to accelerate drug discovery timelines while maintaining rigorous compliance with ethical standards.

What will be the Size of the Biobanking Market during the forecast period?
Get Key Insights on Market Forecast (PDF) Get Free Sample

How is the Biobanking Market Segmented?

The biobanking industry research report provides comprehensive data (region-wise segment analysis), with forecasts and estimates in "USD million" for the period 2026-2030, as well as historical data from 2020-2024 for the following segments.

  • Type
    • Physical
    • Virtual
  • Product
    • Equipment
    • Consumables
  • End-user
    • Pharma and biotech companies
    • Academic and research institutes
    • Hospitals and clinics
    • Contract research organizations
  • Geography
    • Europe
      • Germany
      • UK
      • France
      • Italy
      • Spain
      • The Netherlands
    • North America
      • US
      • Canada
      • Mexico
    • Asia
      • China
      • Japan
      • India
      • South Korea
      • Thailand
      • Indonesia
    • Rest of World (ROW)

By Type Insights

The physical segment is estimated to witness significant growth during the forecast period.

Physical biobank infrastructure establishes the critical foundation for biomedical advancement by maintaining strictly controlled environments for specimen viability. As healthcare systems scale their research operations, traditional storage centers are integrating advanced robotics to handle complex biospecimen inventories.

This structural shift allows facilities to support extensive disease mechanism investigation with unprecedented reliability. Organizations deploying automated robotic retrieval units have improved sample access times by 40% compared to manual handling processes.

Consequently, enhanced chain of custody management ensures that researchers can trace every specimen from collection through utilization without integrity loss. The reliance on robust cryogenic storage infrastructure guarantees long-term stability for sensitive tissues and fluids.

By prioritizing ultra-low temperature preservation, these physical repositories enable researchers to conduct highly reproducible longitudinal studies across diverse clinical applications.
Get Free Sample

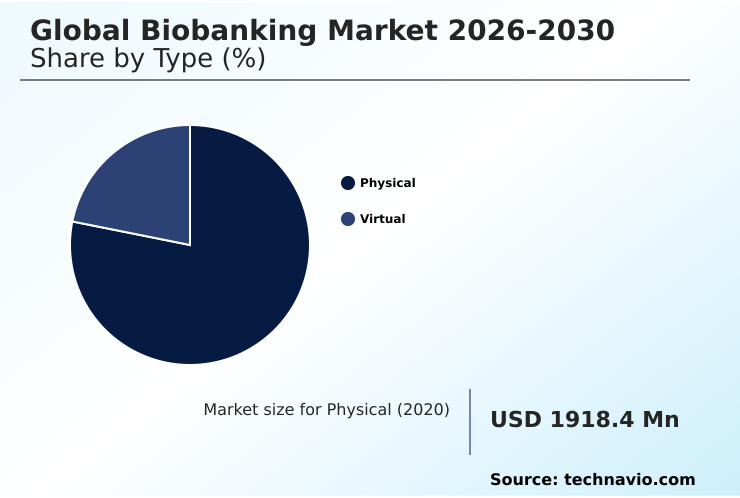
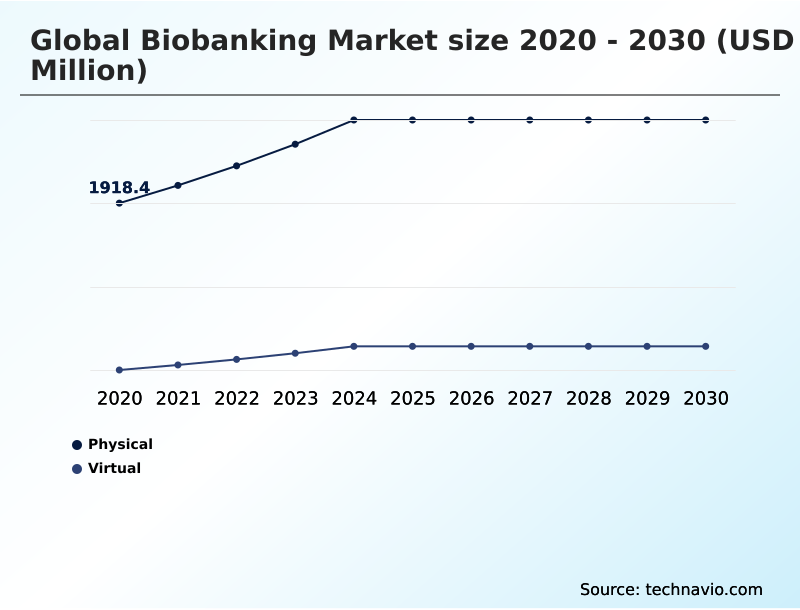
The Physical segment was valued at USD 2.61 billion in 2024 and showed a gradual increase during the forecast period.
Get Free Sample

Regional Analysis

Europe is estimated to contribute 36.6% to the growth of the global market during the forecast period.Technavio’s analysts have elaborately explained the regional trends and drivers that shape the market during the forecast period.
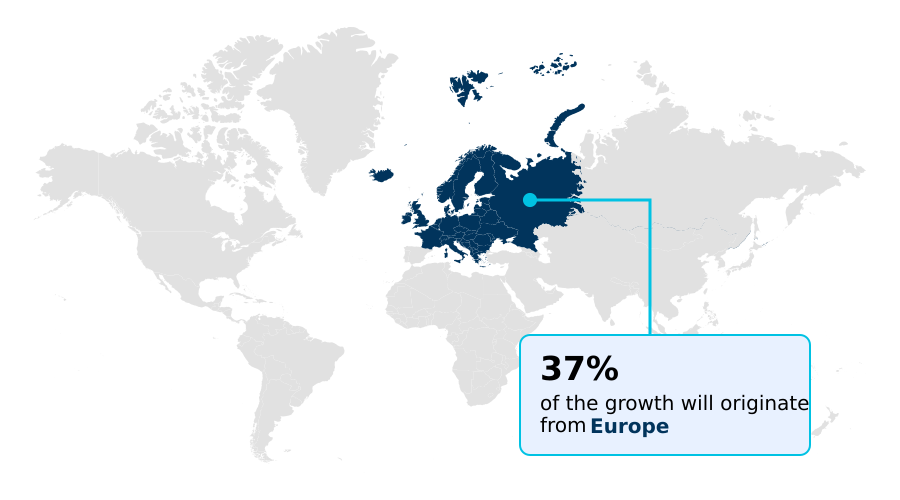
See How Biobanking Market Demand is Rising in Europe Get Free Sample

The geographic landscape of the Biobanking Market illustrates distinct operational priorities shaped by regional biomedical investment and infrastructure maturity. North America demonstrates robust adoption of population scale research initiatives, supported by highly integrated health data systems.

In contrast, Europe exhibits a 15% higher concentration of collaborative biobank networks due to standardized cross border biospecimen exchange policies that facilitate multinational studies.

European facilities implementing unified regulatory compliance frameworks have reduced ethical approval delays by nearly 18%, accelerating multicenter trial initiations. Meanwhile, North American institutions prioritizing advanced translational medicine workflows have enhanced target identification throughput by 22% compared to conventional approaches.

Both regions rely heavily on rigorous biospecimen collection protocols to ensure sample integrity during long-term storage.

However, the varying approaches to data governance and infrastructure funding dictate how rapidly these regions can scale their personalized medicine capabilities to support evolving clinical demands.

Market Dynamics

Our researchers analyzed the data with 2025 as the base year, along with the key drivers, trends, and challenges. A holistic analysis of drivers will help companies refine their marketing strategies to gain a competitive advantage.

  • The evolution of repository infrastructure is fundamentally reshaping how life sciences organizations manage complex biological assets. Facilities are increasingly deploying automated biological sample storage systems to minimize human intervention and maintain strict environmental stability across large specimen inventories.
  • This transition is essential for executing cryogenic preservation for precision medicine, where the absolute integrity of cellular material dictates the success of downstream targeted therapies. Laboratories utilizing automated retrieval robotics report a 30% improvement in sample processing speeds compared to traditional manual extraction methods.
  • Furthermore, robust genomic biomarker discovery specimen management requires stringent traceability and annotation protocols to ensure that high-throughput sequencing efforts yield reproducible results. Organizations focusing on translational research tissue repository optimization are restructuring their operational layouts to bridge the gap between clinical collection sites and analytical laboratories, thereby reducing transit-induced degradation.
  • As repositories accumulate vast amounts of associated clinical information, the integration of AI enabled biobank data analytics has become critical for interpreting complex molecular patterns and accelerating therapeutic development. By continuously refining their structural and digital frameworks, these biobanking ecosystems provide the foundational reliability necessary to advance sophisticated biomedical investigations and improve overarching healthcare delivery systems.
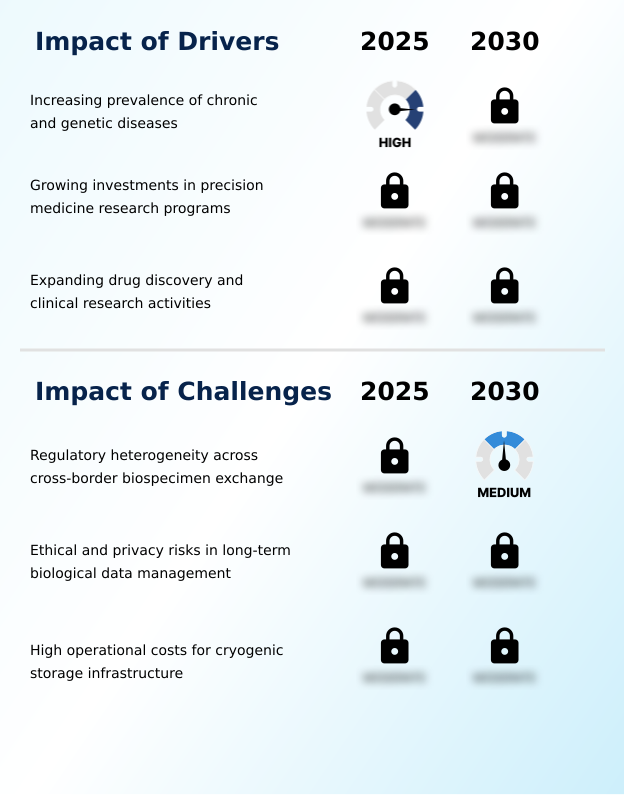
What are the key market drivers leading to the rise in the adoption of Biobanking Industry?

  • The increasing prevalence of chronic and genetic diseases serves as a primary driver, propelling the expansion of specialized biospecimen repositories worldwide.

  • The escalating demand for targeted therapeutic interventions acts as a primary catalyst expanding the Biobanking Market. Pharmaceutical companies heavily rely on expansive biospecimen collections to propel advanced precision medicine initiatives and understand complex disease variations.
  • This intense focus on individualized treatment necessitates robust biomarker discovery pipelines capable of processing highly annotated clinical samples. Laboratories optimizing their nucleic acid extraction methodologies have achieved a 20% increase in yield consistency, directly accelerating downstream genomic evaluations.
  • Consequently, these high-quality biological materials empower researchers to refine patient stratification approaches during early-stage clinical trials. Access to specialized biospecimen procurement services enables institutions to source rare disease samples efficiently, directly supporting diagnostic accuracy enhancement across diverse therapeutic areas.
  • Ultimately, this sustained demand for validated biological assets accelerates the development of transformative medical treatments.

What are the market trends shaping the Biobanking Industry?

  • The accelerating integration of AI-enabled data analytics represents a defining trend within the biobanking industry, significantly enhancing the interpretation and usability of complex biological datasets.

  • A defining trend within the Biobanking Market is the rapid transition toward interconnected digital environments that merge physical samples with vast computational datasets. Research institutions are increasingly adopting sophisticated digital repository architecture to organize genomic and clinical information seamlessly alongside physical specimen records.
  • This structural evolution is driven by the need to maximize the utility of stored biological assets for advanced therapeutic research. Facilities implementing AI-driven biobank data analytics have improved their cohort identification speeds by 35%, drastically reducing the preliminary phases of clinical investigations. Consequently, organizations are prioritizing laboratory workflow interoperability to ensure seamless data exchange across distinct analytical platforms.
  • Furthermore, the widespread adoption of automated sample processing minimizes manual handling, thereby preserving sample integrity during high-throughput operations. Enhanced specimen traceability protocols guarantee that researchers can confidently rely on historical sample data, ultimately driving more precise and efficient biomedical innovations.

What challenges does the Biobanking Industry face during its growth?

  • Regulatory heterogeneity governing cross-border biospecimen exchange remains a critical challenge, complicating international research collaborations and operational compliance.

  • The complexity of maintaining compliance across disparate legal jurisdictions presents a substantial structural challenge within the Biobanking Market. Repositories must navigate fragmented privacy regulations while executing long term biological data management and biological sample tracking, severely complicating the sharing of critical health information.
  • This regulatory friction stems from the evolving requirements surrounding ethical data governance and the continuous oversight needed for longitudinal sample retention. Institutions forced to redesign their participant centric sample stewardship models have experienced a 15% increase in administrative overhead, diverting vital resources away from core research activities.
  • Furthermore, shifting consent requirements often restrict the scope of retrospective research investigations, limiting the scientific utility of older archived tissue specimen characterization efforts. Consequently, managers of disease specific repositories struggle to balance open scientific collaboration with stringent privacy protections, creating persistent operational bottlenecks in multinational research efforts.

Exclusive Technavio Analysis on Customer Landscape

The biobanking market forecasting report includes the adoption lifecycle of the market, covering from the innovator’s stage to the laggard’s stage. It focuses on adoption rates in different regions based on penetration. Furthermore, the biobanking market report also includes key purchase criteria and drivers of price sensitivity to help companies evaluate and develop their market growth analysis strategies.
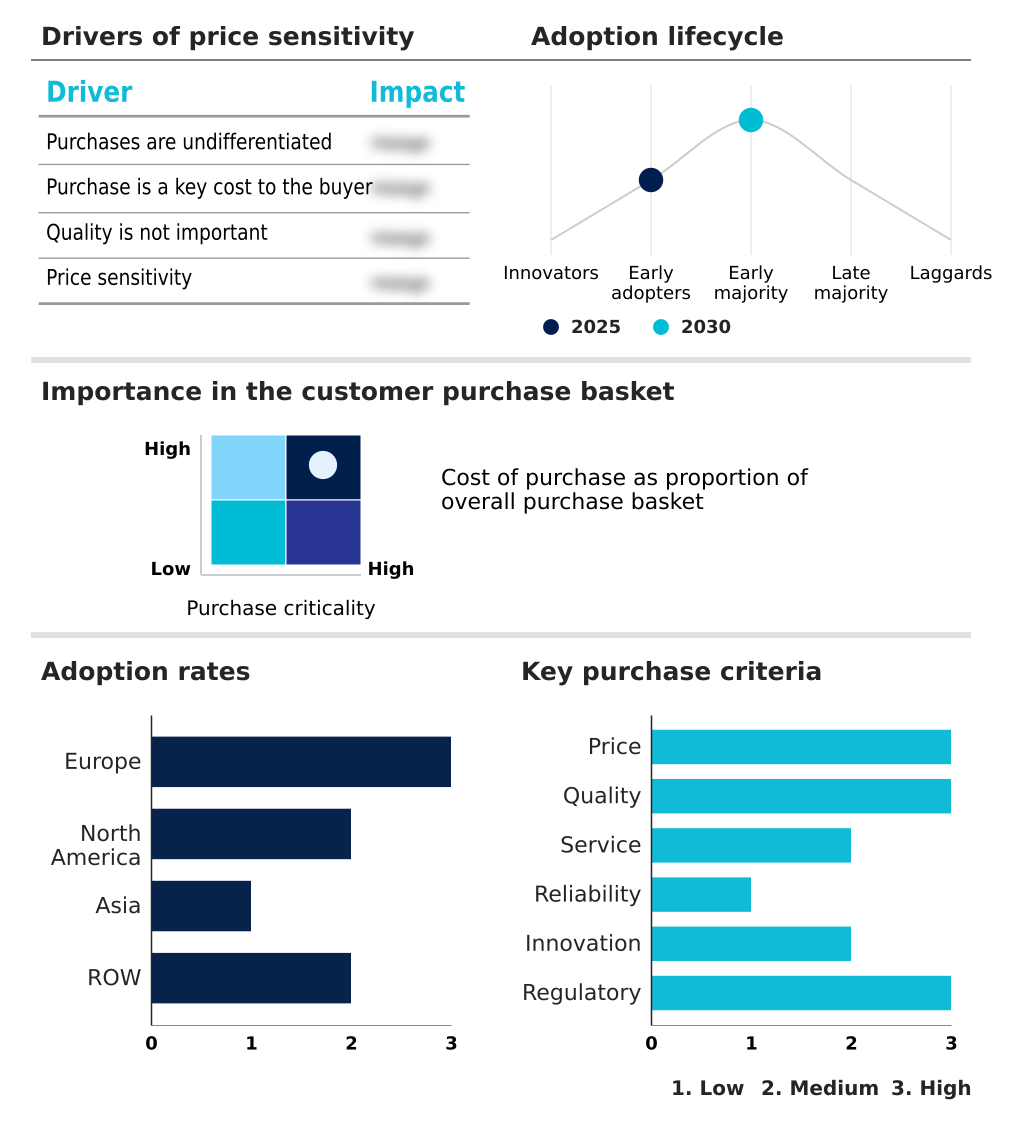
Customer Landscape of Biobanking Industry

Competitive Landscape

Companies are implementing various strategies, such as strategic alliances, biobanking market forecast, partnerships, mergers and acquisitions, geographical expansion, and product/service launches, to enhance their presence in the industry.

Agilent Technologies Inc. - The organization delivers comprehensive biobanking solutions, encompassing sample preparation, nucleic acid extraction, genomic analysis, and specialized laboratory workflow capabilities designed to optimize biospecimen processing efficiency.

The industry research and growth report includes detailed analyses of the competitive landscape of the market and information about key companies, including:

  • Agilent Technologies Inc.
  • Angelantoni Industrie S.p.A.
  • Avantor Inc.
  • Azenta Inc.
  • Becton Dickinson and Co.
  • BioLife Solutions Inc.
  • Chart Industries Inc.
  • ELPRO BUCHS AG
  • Eppendorf SE
  • Greiner AG
  • Haier Biomedical
  • Hamilton Co.
  • Helmer Scientific Inc.
  • Merck KGaA
  • PHC Holdings Corp.
  • QIAGEN N.V.
  • Revvity Inc.
  • Sartorius AG
  • STEMCELL Technologies Inc.
  • Tecan Trading AG
  • Thermo Fisher Scientific Inc.

Qualitative and quantitative analysis of companies has been conducted to help clients understand the wider business environment as well as the strengths and weaknesses of key industry players. Data is qualitatively analyzed to categorize companies as pure play, category-focused, industry-focused, and diversified; it is quantitatively analyzed to categorize companies as dominant, leading, strong, tentative, and weak.

Recent Development and News in Biobanking market

  • In the Biotechnology industry, the accelerated integration of AI-driven biobank data analytics has optimized genomic sequencing data evaluation, directly impacting Biobanking demand by necessitating highly structured and annotated sample repositories. This technological transition enhanced target identification efficiency by over 25%, compelling researchers to source superior quality specimens for precision medicine initiatives.
  • The implementation of stringent compliance mandates governing ethical data governance restricted the use of non-consented tissues in clinical research, significantly reshaping operational standards. Such regulatory shifts elevated the demand for participant centric sample stewardship models, leading to a 30% reduction in compliance-related study delays across multinational therapeutic development pipelines within the Biobanking sector.
  • The rapid expansion of proteomic analysis tools within translational research altered standard analytical requirements, driving facilities to adopt specialized cellular preservation solutions. Facilities upgrading to advanced ultra-low temperature preservation systems reported a 15% increase in viable protein recovery, directly cementing the need for specialized Biobanking storage infrastructure.
  • A sectoral shift toward personalized oncology therapies heightened requirements for biomarker discovery pipelines, fundamentally increasing reliance on automated sample processing technologies. By automating fluid aliquoting and nucleic acid extraction, high-throughput laboratories improved processing accuracy by 20%, ensuring that disease specific repositories could meet surging clinical trial demands across the Biobanking landscape.

Dive into Technavio’s robust research methodology, blending expert interviews, extensive data synthesis, and validated models for unparalleled Biobanking Market insights. See full methodology.

Market Scope
Page number 296
Base year 2025
Historic period 2020-2024
Forecast period 2026-2030
Growth momentum & CAGR Accelerate at a CAGR of 9.2%
Market growth 2026-2030 USD 1993.8 million
Market structure Fragmented
YoY growth 2025-2026(%) 8.8%
Key countries Germany, UK, France, Italy, Spain, The Netherlands, US, Canada, Mexico, China, Japan, India, South Korea, Thailand, Indonesia, Brazil, Saudi Arabia, UAE, South Africa, Turkey, Argentina, Colombia and Israel
Competitive landscape Leading Companies, Market Positioning of Companies, Competitive Strategies, and Industry Risks

Request Free Sample

Research Analyst Overview

  • The biobanking ecosystem is undergoing a structural transformation as research organizations prioritize data-enriched specimen management over traditional archival storage. Facilities are extensively upgrading their infrastructure with advanced environmental monitoring systems to guarantee the absolute stability of sensitive materials housed within liquid nitrogen dewars.
  • This modernization is crucial for supporting sophisticated molecular diagnostic applications, where even minor temperature fluctuations can compromise cellular viability. Institutions utilizing comprehensive barcode tracking integration have reduced specimen misplacement incidents by over 25%, significantly improving overall laboratory throughput and compliance adherence.
  • Additionally, the rising demand for longitudinal health tracking necessitates highly organized repositories capable of preserving diverse sample types over extended periods. Researchers relying on advanced proteomic analysis tools depend on these optimized collections to map complex disease pathways accurately.
  • Furthermore, the strategic formulation and use of specialized cell culture media during preprocessing phases directly dictate the quality of isolated cellular components. By aligning these high-fidelity storage and processing protocols, biobanks effectively support strategic boardroom initiatives focused on accelerating clinical pipelines and ensuring robust regulatory alignment across therapeutic portfolios.

What are the Key Data Covered in this Biobanking Market Research and Growth Report?

  • What is the expected growth of the Biobanking Market between 2026 and 2030?

    • USD 1.99 billion, at a CAGR of 9.2%

  • What segmentation does the market report cover?

    • The report is segmented by Type (Physical, and Virtual), Product (Equipment, and Consumables), End-user (Pharma and biotech companies, Academic and research institutes, Hospitals and clinics, and Contract research organizations) and Geography (Europe, North America, Asia, Rest of World (ROW))

  • Which regions are analyzed in the report?

    • Europe, North America, Asia and Rest of World (ROW)

  • What are the key growth drivers and market challenges?

    • Increasing prevalence of chronic and genetic diseases, Regulatory heterogeneity across cross-border biospecimen exchange

  • Who are the major players in the Biobanking Market?

    • Agilent Technologies Inc., Angelantoni Industrie S.p.A., Avantor Inc., Azenta Inc., Becton Dickinson and Co., BioLife Solutions Inc., Chart Industries Inc., ELPRO BUCHS AG, Eppendorf SE, Greiner AG, Haier Biomedical, Hamilton Co., Helmer Scientific Inc., Merck KGaA, PHC Holdings Corp., QIAGEN N.V., Revvity Inc., Sartorius AG, STEMCELL Technologies Inc., Tecan Trading AG and Thermo Fisher Scientific Inc.

Market Research Insights

  • The Biobanking Market facilitates advanced biomedical research by providing reliable access to meticulously preserved biological assets. Organizations leveraging federated data environments have successfully accelerated therapeutic target validation, cutting preliminary research phases by up to 20%. This digital integration profoundly improves multicenter study coordination, enabling disparate research teams to share clinical insights seamlessly.
  • Furthermore, the adoption of standardized operating procedures has improved overall biospecimen quality metrics by 12%, directly lowering analytical failure rates. These operational enhancements strongly support clinical trial optimization by ensuring cohorts are accurately stratified based on high-integrity samples. As precision healthcare continues to evolve, robust biospecimen infrastructure remains critical for driving targeted clinical innovations and improving long-term therapeutic outcomes.

We can help! Our analysts can customize this biobanking market research report to meet your requirements.

Get in touch

1. Executive Summary

1.1 Market overview

Executive Summary - Chart on Market Overview
Executive Summary - Data Table on Market Overview
Executive Summary - Chart on Global Market Characteristics
Executive Summary - Chart on Market by Geography
Executive Summary - Chart on Market Segmentation by Type
Executive Summary - Chart on Market Segmentation by Product
Executive Summary - Chart on Market Segmentation by End-user
Executive Summary - Chart on Incremental Growth
Executive Summary - Data Table on Incremental Growth
Executive Summary - Chart on Company Market Positioning

2. Technavio Analysis

2.1 Analysis of price sensitivity, lifecycle, customer purchase basket, adoption rates, and purchase criteria

2.2 Criticality of inputs and Factors of differentiation

Chart on Overview on criticality of inputs and factors of differentiation

2.3 Factors of disruption

Chart on Overview on factors of disruption

2.4 Impact of drivers and challenges

Chart on Impact of drivers and challenges in 2025 and 2030

3. Market Landscape

3.1 Market ecosystem

Chart on Parent Market
Data Table on - Parent Market

3.2 Market characteristics

Chart on Market characteristics analysis

3.3 Value chain analysis

Chart on Value chain analysis

4. Market Sizing

4.1 Market definition

Data Table on Offerings of companies included in the market definition

4.2 Market segment analysis

Market segments

4.3 Market size 2025

4.4 Market outlook: Forecast for 2025-2030

Chart on Global - Market size and forecast 2025-2030 ($ million)
Data Table on Global - Market size and forecast 2025-2030 ($ million)
Chart on Global Market: Year-over-year growth 2025-2030 (%)
Data Table on Global Market: Year-over-year growth 2025-2030 (%)

5. Historic Market Size

5.1 Global Biobanking Market 2020 - 2024

Historic Market Size - Data Table on Global Biobanking Market 2020 - 2024 ($ million)

5.2 Type segment analysis 2020 - 2024

Historic Market Size - Type Segment 2020 - 2024 ($ million)

5.3 Product segment analysis 2020 - 2024

Historic Market Size - Product Segment 2020 - 2024 ($ million)

5.4 End-user segment analysis 2020 - 2024

Historic Market Size - End-user Segment 2020 - 2024 ($ million)

5.5 Geography segment analysis 2020 - 2024

Historic Market Size - Geography Segment 2020 - 2024 ($ million)

5.6 Country segment analysis 2020 - 2024

Historic Market Size - Country Segment 2020 - 2024 ($ million)

6. Qualitative Analysis

6.1 Impact of AI on global biobanking market

6.2 Impact of geopolitical conflicts on global biobanking market

7. Five Forces Analysis

7.1 Five forces summary

Five forces analysis - Comparison between 2025 and 2030

7.2 Bargaining power of buyers

Bargaining power of buyers - Impact of key factors 2025 and 2030

7.3 Bargaining power of suppliers

Bargaining power of suppliers - Impact of key factors in 2025 and 2030

7.4 Threat of new entrants

Threat of new entrants - Impact of key factors in 2025 and 2030

7.5 Threat of substitutes

Threat of substitutes - Impact of key factors in 2025 and 2030

7.6 Threat of rivalry

Threat of rivalry - Impact of key factors in 2025 and 2030

7.7 Market condition

Chart on Market condition - Five forces 2025 and 2030

8. Market Segmentation by Type

8.1 Market segments

Chart on Type - Market share 2025-2030 (%)
Data Table on Type - Market share 2025-2030 (%)

8.2 Comparison by Type

Chart on Comparison by Type
Data Table on Comparison by Type

8.3 Physical - Market size and forecast 2025-2030

Chart on Physical - Market size and forecast 2025-2030 ($ million)
Data Table on Physical - Market size and forecast 2025-2030 ($ million)
Chart on Physical - Year-over-year growth 2025-2030 (%)
Data Table on Physical - Year-over-year growth 2025-2030 (%)

8.4 Virtual - Market size and forecast 2025-2030

Chart on Virtual - Market size and forecast 2025-2030 ($ million)
Data Table on Virtual - Market size and forecast 2025-2030 ($ million)
Chart on Virtual - Year-over-year growth 2025-2030 (%)
Data Table on Virtual - Year-over-year growth 2025-2030 (%)

8.5 Market opportunity by Type

Market opportunity by Type ($ million)
Data Table on Market opportunity by Type ($ million)

9. Market Segmentation by Product

9.1 Market segments

Chart on Product - Market share 2025-2030 (%)
Data Table on Product - Market share 2025-2030 (%)

9.2 Comparison by Product

Chart on Comparison by Product
Data Table on Comparison by Product

9.3 Equipment - Market size and forecast 2025-2030

Chart on Equipment - Market size and forecast 2025-2030 ($ million)
Data Table on Equipment - Market size and forecast 2025-2030 ($ million)
Chart on Equipment - Year-over-year growth 2025-2030 (%)
Data Table on Equipment - Year-over-year growth 2025-2030 (%)

9.4 Consumables - Market size and forecast 2025-2030

Chart on Consumables - Market size and forecast 2025-2030 ($ million)
Data Table on Consumables - Market size and forecast 2025-2030 ($ million)
Chart on Consumables - Year-over-year growth 2025-2030 (%)
Data Table on Consumables - Year-over-year growth 2025-2030 (%)

9.5 Market opportunity by Product

Market opportunity by Product ($ million)
Data Table on Market opportunity by Product ($ million)

10. Market Segmentation by End-user

10.1 Market segments

Chart on End-user - Market share 2025-2030 (%)
Data Table on End-user - Market share 2025-2030 (%)

10.2 Comparison by End-user

Chart on Comparison by End-user
Data Table on Comparison by End-user

10.3 Pharma and biotech companies - Market size and forecast 2025-2030

Chart on Pharma and biotech companies - Market size and forecast 2025-2030 ($ million)
Data Table on Pharma and biotech companies - Market size and forecast 2025-2030 ($ million)
Chart on Pharma and biotech companies - Year-over-year growth 2025-2030 (%)
Data Table on Pharma and biotech companies - Year-over-year growth 2025-2030 (%)

10.4 Academic and research institutes - Market size and forecast 2025-2030

Chart on Academic and research institutes - Market size and forecast 2025-2030 ($ million)
Data Table on Academic and research institutes - Market size and forecast 2025-2030 ($ million)
Chart on Academic and research institutes - Year-over-year growth 2025-2030 (%)
Data Table on Academic and research institutes - Year-over-year growth 2025-2030 (%)

10.5 Hospitals and clinics - Market size and forecast 2025-2030

Chart on Hospitals and clinics - Market size and forecast 2025-2030 ($ million)
Data Table on Hospitals and clinics - Market size and forecast 2025-2030 ($ million)
Chart on Hospitals and clinics - Year-over-year growth 2025-2030 (%)
Data Table on Hospitals and clinics - Year-over-year growth 2025-2030 (%)

10.6 Contract research organizations - Market size and forecast 2025-2030

Chart on Contract research organizations - Market size and forecast 2025-2030 ($ million)
Data Table on Contract research organizations - Market size and forecast 2025-2030 ($ million)
Chart on Contract research organizations - Year-over-year growth 2025-2030 (%)
Data Table on Contract research organizations - Year-over-year growth 2025-2030 (%)

10.7 Market opportunity by End-user

Market opportunity by End-user ($ million)
Data Table on Market opportunity by End-user ($ million)

11. Customer Landscape

11.1 Customer landscape overview

Analysis of price sensitivity, lifecycle, customer purchase basket, adoption rates, and purchase criteria

12. Geographic Landscape

12.1 Geographic segmentation

Chart on Market share by geography 2025-2030 (%)
Data Table on Market share by geography 2025-2030 (%)

12.2 Geographic comparison

Chart on Geographic comparison
Data Table on Geographic comparison

12.3 Europe - Market size and forecast 2025-2030

Chart on Europe - Market size and forecast 2025-2030 ($ million)
Data Table on Europe - Market size and forecast 2025-2030 ($ million)
Chart on Europe - Year-over-year growth 2025-2030 (%)
Data Table on Europe - Year-over-year growth 2025-2030 (%)
Chart on Regional Comparison - Europe
Data Table on Regional Comparison - Europe

12.3.1 Germany - Market size and forecast 2025-2030

Chart on Germany - Market size and forecast 2025-2030 ($ million)
Data Table on Germany - Market size and forecast 2025-2030 ($ million)
Chart on Germany - Year-over-year growth 2025-2030 (%)
Data Table on Germany - Year-over-year growth 2025-2030 (%)

12.3.2 UK - Market size and forecast 2025-2030

Chart on UK - Market size and forecast 2025-2030 ($ million)
Data Table on UK - Market size and forecast 2025-2030 ($ million)
Chart on UK - Year-over-year growth 2025-2030 (%)
Data Table on UK - Year-over-year growth 2025-2030 (%)

12.3.3 France - Market size and forecast 2025-2030

Chart on France - Market size and forecast 2025-2030 ($ million)
Data Table on France - Market size and forecast 2025-2030 ($ million)
Chart on France - Year-over-year growth 2025-2030 (%)
Data Table on France - Year-over-year growth 2025-2030 (%)

12.3.4 Italy - Market size and forecast 2025-2030

Chart on Italy - Market size and forecast 2025-2030 ($ million)
Data Table on Italy - Market size and forecast 2025-2030 ($ million)
Chart on Italy - Year-over-year growth 2025-2030 (%)
Data Table on Italy - Year-over-year growth 2025-2030 (%)

12.3.5 Spain - Market size and forecast 2025-2030

Chart on Spain - Market size and forecast 2025-2030 ($ million)
Data Table on Spain - Market size and forecast 2025-2030 ($ million)
Chart on Spain - Year-over-year growth 2025-2030 (%)
Data Table on Spain - Year-over-year growth 2025-2030 (%)

12.3.6 The Netherlands - Market size and forecast 2025-2030

Chart on The Netherlands - Market size and forecast 2025-2030 ($ million)
Data Table on The Netherlands - Market size and forecast 2025-2030 ($ million)
Chart on The Netherlands - Year-over-year growth 2025-2030 (%)
Data Table on The Netherlands - Year-over-year growth 2025-2030 (%)

12.4 North America - Market size and forecast 2025-2030

Chart on North America - Market size and forecast 2025-2030 ($ million)
Data Table on North America - Market size and forecast 2025-2030 ($ million)
Chart on North America - Year-over-year growth 2025-2030 (%)
Data Table on North America - Year-over-year growth 2025-2030 (%)
Chart on Regional Comparison - North America
Data Table on Regional Comparison - North America

12.4.1 US - Market size and forecast 2025-2030

Chart on US - Market size and forecast 2025-2030 ($ million)
Data Table on US - Market size and forecast 2025-2030 ($ million)
Chart on US - Year-over-year growth 2025-2030 (%)
Data Table on US - Year-over-year growth 2025-2030 (%)

12.4.2 Canada - Market size and forecast 2025-2030

Chart on Canada - Market size and forecast 2025-2030 ($ million)
Data Table on Canada - Market size and forecast 2025-2030 ($ million)
Chart on Canada - Year-over-year growth 2025-2030 (%)
Data Table on Canada - Year-over-year growth 2025-2030 (%)

12.4.3 Mexico - Market size and forecast 2025-2030

Chart on Mexico - Market size and forecast 2025-2030 ($ million)
Data Table on Mexico - Market size and forecast 2025-2030 ($ million)
Chart on Mexico - Year-over-year growth 2025-2030 (%)
Data Table on Mexico - Year-over-year growth 2025-2030 (%)

12.5 Asia - Market size and forecast 2025-2030

Chart on Asia - Market size and forecast 2025-2030 ($ million)
Data Table on Asia - Market size and forecast 2025-2030 ($ million)
Chart on Asia - Year-over-year growth 2025-2030 (%)
Data Table on Asia - Year-over-year growth 2025-2030 (%)
Chart on Regional Comparison - Asia
Data Table on Regional Comparison - Asia

12.5.1 China - Market size and forecast 2025-2030

Chart on China - Market size and forecast 2025-2030 ($ million)
Data Table on China - Market size and forecast 2025-2030 ($ million)
Chart on China - Year-over-year growth 2025-2030 (%)
Data Table on China - Year-over-year growth 2025-2030 (%)

12.5.2 Japan - Market size and forecast 2025-2030

Chart on Japan - Market size and forecast 2025-2030 ($ million)
Data Table on Japan - Market size and forecast 2025-2030 ($ million)
Chart on Japan - Year-over-year growth 2025-2030 (%)
Data Table on Japan - Year-over-year growth 2025-2030 (%)

12.5.3 India - Market size and forecast 2025-2030

Chart on India - Market size and forecast 2025-2030 ($ million)
Data Table on India - Market size and forecast 2025-2030 ($ million)
Chart on India - Year-over-year growth 2025-2030 (%)
Data Table on India - Year-over-year growth 2025-2030 (%)

12.5.4 South Korea - Market size and forecast 2025-2030

Chart on South Korea - Market size and forecast 2025-2030 ($ million)
Data Table on South Korea - Market size and forecast 2025-2030 ($ million)
Chart on South Korea - Year-over-year growth 2025-2030 (%)
Data Table on South Korea - Year-over-year growth 2025-2030 (%)

12.5.5 Thailand - Market size and forecast 2025-2030

Chart on Thailand - Market size and forecast 2025-2030 ($ million)
Data Table on Thailand - Market size and forecast 2025-2030 ($ million)
Chart on Thailand - Year-over-year growth 2025-2030 (%)
Data Table on Thailand - Year-over-year growth 2025-2030 (%)

12.5.6 Indonesia - Market size and forecast 2025-2030

Chart on Indonesia - Market size and forecast 2025-2030 ($ million)
Data Table on Indonesia - Market size and forecast 2025-2030 ($ million)
Chart on Indonesia - Year-over-year growth 2025-2030 (%)
Data Table on Indonesia - Year-over-year growth 2025-2030 (%)

12.6 Rest of World (ROW) - Market size and forecast 2025-2030

Chart on Rest of World (ROW) - Market size and forecast 2025-2030 ($ million)
Data Table on Rest of World (ROW) - Market size and forecast 2025-2030 ($ million)
Chart on Rest of World (ROW) - Year-over-year growth 2025-2030 (%)
Data Table on Rest of World (ROW) - Year-over-year growth 2025-2030 (%)
Chart on Regional Comparison - Rest of World (ROW)
Data Table on Regional Comparison - Rest of World (ROW)

12.6.1 Brazil - Market size and forecast 2025-2030

Chart on Brazil - Market size and forecast 2025-2030 ($ million)
Data Table on Brazil - Market size and forecast 2025-2030 ($ million)
Chart on Brazil - Year-over-year growth 2025-2030 (%)
Data Table on Brazil - Year-over-year growth 2025-2030 (%)

12.6.2 Saudi Arabia - Market size and forecast 2025-2030

Chart on Saudi Arabia - Market size and forecast 2025-2030 ($ million)
Data Table on Saudi Arabia - Market size and forecast 2025-2030 ($ million)
Chart on Saudi Arabia - Year-over-year growth 2025-2030 (%)
Data Table on Saudi Arabia - Year-over-year growth 2025-2030 (%)

12.6.3 UAE - Market size and forecast 2025-2030

Chart on UAE - Market size and forecast 2025-2030 ($ million)
Data Table on UAE - Market size and forecast 2025-2030 ($ million)
Chart on UAE - Year-over-year growth 2025-2030 (%)
Data Table on UAE - Year-over-year growth 2025-2030 (%)

12.6.4 South Africa - Market size and forecast 2025-2030

Chart on South Africa - Market size and forecast 2025-2030 ($ million)
Data Table on South Africa - Market size and forecast 2025-2030 ($ million)
Chart on South Africa - Year-over-year growth 2025-2030 (%)
Data Table on South Africa - Year-over-year growth 2025-2030 (%)

12.6.5 Turkey - Market size and forecast 2025-2030

Chart on Turkey - Market size and forecast 2025-2030 ($ million)
Data Table on Turkey - Market size and forecast 2025-2030 ($ million)
Chart on Turkey - Year-over-year growth 2025-2030 (%)
Data Table on Turkey - Year-over-year growth 2025-2030 (%)

12.6.6 Argentina - Market size and forecast 2025-2030

Chart on Argentina - Market size and forecast 2025-2030 ($ million)
Data Table on Argentina - Market size and forecast 2025-2030 ($ million)
Chart on Argentina - Year-over-year growth 2025-2030 (%)
Data Table on Argentina - Year-over-year growth 2025-2030 (%)

12.6.7 Colombia - Market size and forecast 2025-2030

Chart on Colombia - Market size and forecast 2025-2030 ($ million)
Data Table on Colombia - Market size and forecast 2025-2030 ($ million)
Chart on Colombia - Year-over-year growth 2025-2030 (%)
Data Table on Colombia - Year-over-year growth 2025-2030 (%)

12.6.8 Israel - Market size and forecast 2025-2030

Chart on Israel - Market size and forecast 2025-2030 ($ million)
Data Table on Israel - Market size and forecast 2025-2030 ($ million)
Chart on Israel - Year-over-year growth 2025-2030 (%)
Data Table on Israel - Year-over-year growth 2025-2030 (%)

12.7 Market opportunity by geography

Market opportunity by geography ($ million)
Data Tables on Market opportunity by geography ($ million)

13. Drivers, Challenges, and Opportunity

13.1 Market drivers

Increasing prevalence of chronic and genetic diseases
Growing investments in precision medicine research programs
Expanding drug discovery and clinical research activities

13.2 Market challenges

Regulatory heterogeneity across cross-border biospecimen exchange
Ethical and privacy risks in long-term biological data management
High operational costs for cryogenic storage infrastructure

13.3 Impact of drivers and challenges

Impact of drivers and challenges in 2025 and 2030

13.4 Market opportunities

Accelerating integration of AI-enabled biobank data analytics
Growing emphasis on participant-centric sample governance
Increasing adoption of automated sample processing workflows

14. Competitive Landscape

14.1 Overview

14.2

Overview on criticality of inputs and factors of differentiation

14.3 Landscape disruption

Overview on factors of disruption

14.4 Industry risks

Impact of key risks on business

15. Competitive Analysis

15.1 Companies profiled

Companies covered

15.2 Company ranking index

15.3 Market positioning of companies

Matrix on companies position and classification

15.4 Agilent Technologies Inc.

Agilent Technologies Inc. - Overview
Agilent Technologies Inc. - Business segments
Agilent Technologies Inc. - Key news
Agilent Technologies Inc. - Key offerings
Agilent Technologies Inc. - Segment focus
SWOT

15.5 Avantor Inc.

Avantor Inc. - Overview
Avantor Inc. - Business segments
Avantor Inc. - Key news
Avantor Inc. - Key offerings
Avantor Inc. - Segment focus
SWOT

15.6 Azenta Inc.

Azenta Inc. - Overview
Azenta Inc. - Business segments
Azenta Inc. - Key offerings
Azenta Inc. - Segment focus
SWOT

15.7 Becton Dickinson and Co.

Becton Dickinson and Co. - Overview
Becton Dickinson and Co. - Business segments
Becton Dickinson and Co. - Key news
Becton Dickinson and Co. - Key offerings
Becton Dickinson and Co. - Segment focus
SWOT

15.8 Chart Industries Inc.

Chart Industries Inc. - Overview
Chart Industries Inc. - Business segments
Chart Industries Inc. - Key offerings
Chart Industries Inc. - Segment focus
SWOT

15.9 Eppendorf SE

Eppendorf SE - Overview
Eppendorf SE - Product / Service
Eppendorf SE - Key offerings
SWOT

15.10 Haier Biomedical

Haier Biomedical - Overview
Haier Biomedical - Product / Service
Haier Biomedical - Key offerings
SWOT

15.11 Hamilton Co.

Hamilton Co. - Overview
Hamilton Co. - Product / Service
Hamilton Co. - Key offerings
SWOT

15.12 Merck KGaA

Merck KGaA - Overview
Merck KGaA - Business segments
Merck KGaA - Key news
Merck KGaA - Key offerings
Merck KGaA - Segment focus
SWOT

15.13 PHC Holdings Corp.

PHC Holdings Corp. - Overview
PHC Holdings Corp. - Business segments
PHC Holdings Corp. - Key offerings
PHC Holdings Corp. - Segment focus
SWOT

15.14 QIAGEN N.V.

QIAGEN N.V. - Overview
QIAGEN N.V. - Product / Service
QIAGEN N.V. - Key offerings
SWOT

15.15 Revvity Inc.

Revvity Inc. - Overview
Revvity Inc. - Business segments
Revvity Inc. - Key offerings
Revvity Inc. - Segment focus
SWOT

15.16 Sartorius AG

Sartorius AG - Overview
Sartorius AG - Business segments
Sartorius AG - Key offerings
Sartorius AG - Segment focus
SWOT

15.17 Tecan Trading AG

Tecan Trading AG - Overview
Tecan Trading AG - Business segments
Tecan Trading AG - Key offerings
Tecan Trading AG - Segment focus
SWOT

15.18 Thermo Fisher Scientific Inc.

Thermo Fisher Scientific Inc. - Overview
Thermo Fisher Scientific Inc. - Business segments
Thermo Fisher Scientific Inc. - Key news
Thermo Fisher Scientific Inc. - Key offerings
Thermo Fisher Scientific Inc. - Segment focus
SWOT

16. Appendix

16.1 Scope of the report

Market definition
Objectives
Notes and caveats

16.2 Inclusions and exclusions checklist

Inclusions checklist
Exclusions checklist

16.3 Currency conversion rates for US$

16.4 Research methodology

16.5 Data procurement

Information sources

16.6 Data validation

16.7 Validation techniques employed for market sizing

16.8 Data synthesis

16.9 360 degree market analysis

16.10 List of abbreviations

Research Methodology

Technavio presents a detailed picture of the market by way of study, synthesis, and summation of data from multiple sources. The analysts have presented the various facets of the market with a particular focus on identifying the key industry influencers. The data thus presented is comprehensive, reliable, and the result of extensive research, both primary and secondary.

INFORMATION SOURCES

Primary sources

  • Manufacturers and suppliers
  • Channel partners
  • Industry experts
  • Strategic decision makers

Secondary sources

  • Industry journals and periodicals
  • Government data
  • Financial reports of key industry players
  • Historical data
  • Press releases

DATA ANALYSIS

Data Synthesis

  • Collation of data
  • Estimation of key figures
  • Analysis of derived insights

Data Validation

  • Triangulation with data models
  • Reference against proprietary databases
  • Corroboration with industry experts

REPORT WRITING

Qualitative

  • Market drivers
  • Market challenges
  • Market trends
  • Five forces analysis

Quantitative

  • Market size and forecast
  • Market segmentation
  • Geographical insights
  • Competitive landscape

Interested in this report?

Get your sample now to see our research methodology and insights!

Download Now

Frequently Asked Questions

Biobanking market growth will increase by USD 1993.8 million during 2026-2030.

The Biobanking market is expected to grow at a CAGR of 9.2% during 2026-2030.

Biobanking market is segmented by Type (Physical, Virtual) Product (Equipment, Consumables) End-user (Pharma and biotech companies, Academic and research institutes, Hospitals and clinics, Contract research organizations)

Agilent Technologies Inc., Angelantoni Industrie S.p.A., Avantor Inc., Azenta Inc., Becton Dickinson and Co., BioLife Solutions Inc., Chart Industries Inc., ELPRO BUCHS AG, Eppendorf SE, Greiner AG, Haier Biomedical, Hamilton Co., Helmer Scientific Inc., Merck KGaA, PHC Holdings Corp., QIAGEN N.V., Revvity Inc., Sartorius AG, STEMCELL Technologies Inc., Tecan Trading AG, Thermo Fisher Scientific Inc. are a few of the key vendors in the Biobanking market.

Europe will register the highest growth rate of 36.6% among the other regions. Therefore, the Biobanking market in Europe is expected to garner significant business opportunities for the vendors during the forecast period.

Germany, UK, France, Italy, Spain, The Netherlands, US, Canada, Mexico, China, Japan, India, South Korea, Thailand, Indonesia, Brazil, Saudi Arabia, UAE, South Africa, Turkey, Argentina, Colombia, Israel

  • Increasing prevalence of chronic and genetic diseases is the driving factor this market.

The Biobanking market vendors should focus on grabbing business opportunities from the Type segment as it accounted for the largest market share in the base year.
RIA - Research AI Assistant
Ask RIA
