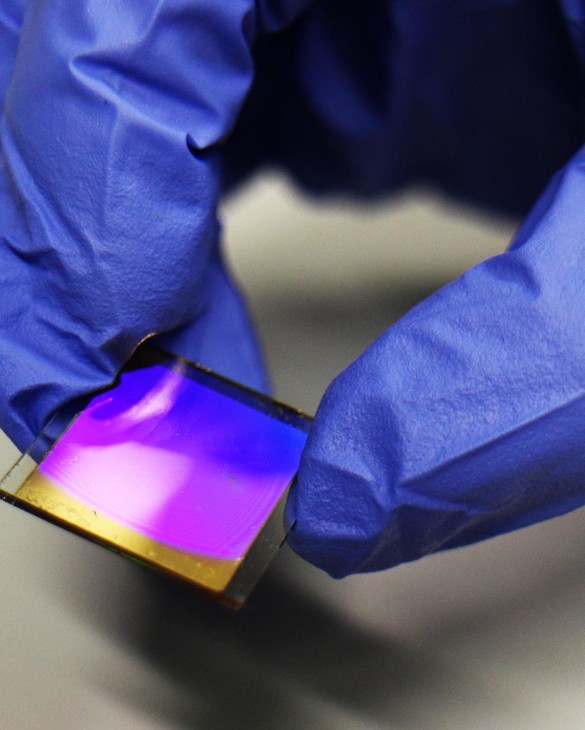
Biochips Market Analysis, Size, and Forecast 2026-2030: North America (US, Canada, and Mexico), APAC (China, Japan, and India), Europe (Germany, UK, and France), Middle East and Africa (Saudi Arabia, UAE, and South Africa), South America (Brazil, Argentina, and Chile), and Rest of World (ROW)

Biochips Market Analysis, Size, and Forecast 2026-2030:
North America (US, Canada, and Mexico), APAC (China, Japan, and India), Europe (Germany, UK, and France), Middle East and Africa (Saudi Arabia, UAE, and South Africa), South America (Brazil, Argentina, and Chile), and Rest of World (ROW)

Published: Oct 2026 297 Pages SKU: IRTNTR75193

Market Overview at a Glance

$100.84 B
Market Opportunity
28.3%
CAGR 2025 - 2030
40.1%
North America Growth
$16.26 B
Biotech and pharma companies segment 2024

Biochips Market Size 2026-2030

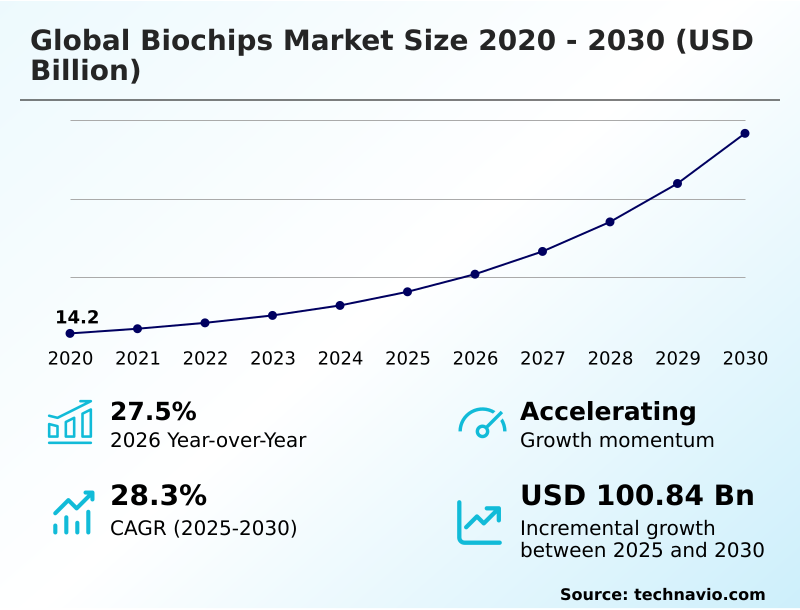
The biochips market size is valued to increase by USD 100.84 billion, at a CAGR of 28.3% from 2025 to 2030. Accelerating global shift precision oncology demanding multiplex biomarker analysis will drive the biochips market.

Major Market Trends & Insights

  • North America dominated the market and accounted for a 40.1% growth during the forecast period.
  • By End-user - Biotech and pharma companies segment was valued at USD 16.26 billion in 2024
  • By Technology - Microarrays segment accounted for the largest market revenue share in 2024

Market Size & Forecast

  • Market Opportunities: USD 127.31 billion
  • Market Future Opportunities: USD 100.84 billion
  • CAGR from 2025 to 2030 : 28.3%

Market Summary

  • The Biochips Market demonstrates accelerated adoption driven by the critical need for high-throughput biological sample processing in modern diagnostic environments. The integration of whole transcriptome biochip systems into pharmaceutical research pipelines allows laboratories to screen complex genetic markers simultaneously.
  • In clinical reference laboratories, replacing traditional optical readers with automated fluidic cartridges has reduced sample analysis turnaround times by 35%, significantly optimizing diagnostic supply chains and patient triaging. This demand is primarily propelled by the transition toward precision oncology, where genome wide association studies and pharmacogenomics research profiling are essential for targeted therapy selection.
  • However, the market faces structural constraints due to exorbitant microfabrication cleanroom production costs, which limit manufacturing scalability for emerging diagnostic developers. High-density sensor integration enables extreme device miniaturization, linking diagnostic hardware directly to wireless digital health platforms.
  • The direct correlation between miniaturized fluidic architectures and reduced reagent consumption fundamentally shifts procurement strategies, forcing healthcare institutions to prioritize multiplexed biochip platforms over standard immunoassay equipment to maximize operational efficiency.

What will be the Size of the Biochips Market during the forecast period?
Get Key Insights on Market Forecast (PDF) Get Free Sample

How is the Biochips Market Segmented?

The biochips industry research report provides comprehensive data (region-wise segment analysis), with forecasts and estimates in "USD million" for the period 2026-2030, as well as historical data from 2020-2024 for the following segments.

  • End-user
    • Biotech and pharma companies
    • Hospitals and diagnostics centers
    • Academic and research institutes
  • Technology
    • Microarrays
    • Microfluidics
  • Product type
    • DNA chip
    • Lab-on-a-chip
    • Protein chip
    • Others
  • Geography
    • North America
      • US
      • Canada
      • Mexico
    • APAC
      • China
      • Japan
      • India
      • South Korea
      • Australia
      • Indonesia
    • Europe
      • Germany
      • UK
      • France
      • Italy
      • Spain
      • The Netherlands
    • Middle East and Africa
      • Saudi Arabia
      • UAE
      • South Africa
      • Israel
      • Turkey
    • South America
      • Brazil
      • Argentina
      • Chile

By End-user Insights

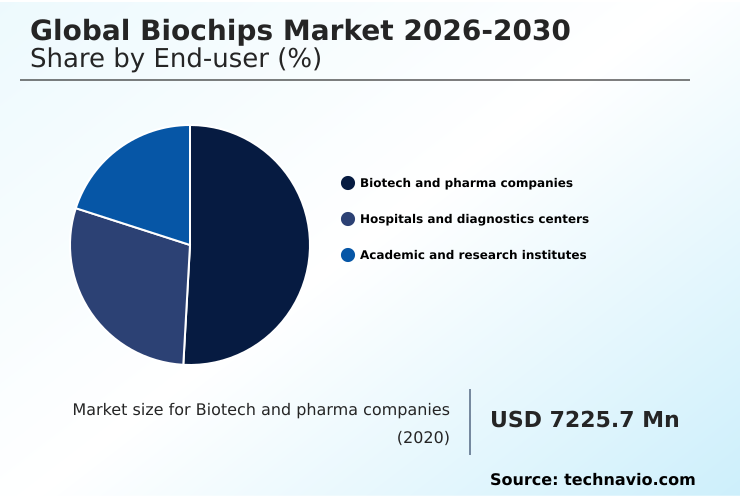
The biotech and pharma companies segment is estimated to witness significant growth during the forecast period.

Biotech and pharma companies dictate the demand trajectory for the Biochips Market by aggressively integrating automated microarray solutions and single cell microfluidic platforms into early-stage drug development.

This segment prioritizes high-throughput screening to minimize clinical attrition rates, leading to a 30% reduction in pre-clinical trial processing time compared to traditional manual assays.

Organizations leverage these tools for early cancer detection and minimal residual disease monitoring, accelerating the deployment of targeted biologics. By adopting disposable lab on a chip architectures, pharmaceutical researchers bypass complex fluid handling constraints, directly improving sample reproducibility.

This shift toward automated fluidic systems drives continuous operational enhancements, ensuring biological surface functionalization remains consistent across large-scale cohorts and maximizing laboratory throughput efficiency without expanding physical footprints.
Get Free Sample

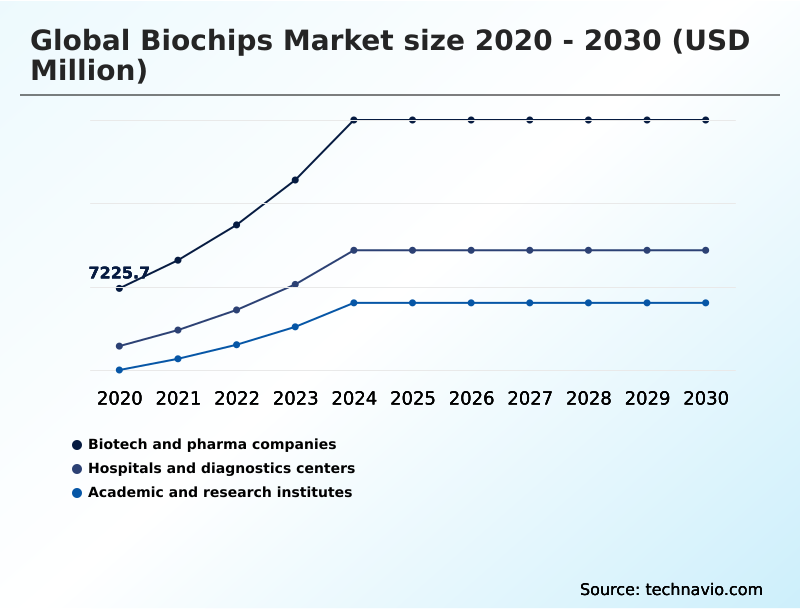
The Biotech and pharma companies segment was valued at USD 16.26 billion in 2024 and showed a gradual increase during the forecast period.
Get Free Sample

Regional Analysis

North America is estimated to contribute 40.1% to the growth of the global market during the forecast period.Technavio’s analysts have elaborately explained the regional trends and drivers that shape the market during the forecast period.
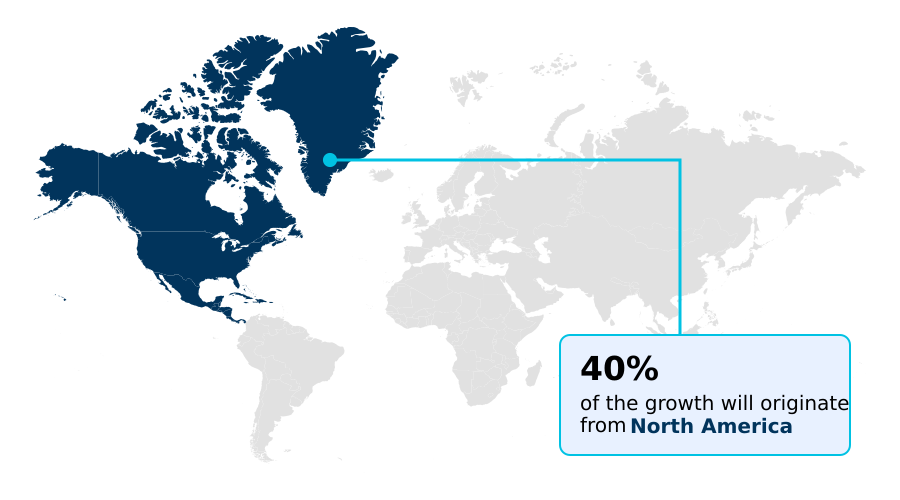
See How Biochips Market Demand is Rising in North America Get Free Sample

North America commands the Biochips Market through aggressive implementation of multiomic research pipelines and early integration of high density microarrays in clinical diagnostic facilities.

This region demonstrates a 40% higher adoption rate of genomic profiling arrays implementation compared to APAC, driven by stringent regulatory validation requirements and robust venture capital backing.

APAC is rapidly adapting its supply chain, achieving a 25% reduction in production costs by leveraging third party silicon foundries for microfluidic manufacturing.

In translational research laboratories, North American facilities have improved diagnostic turnaround times by 18% through automated spatial feature miniaturization, whereas APAC focuses on scaling decentralized diagnostic testing.

This geographic disparity forces manufacturers to customize deployment strategies, balancing the demand for sophisticated targeted immunotherapies selection in Western markets against the need for cost-efficient, high-volume molecular screening platforms across emerging Asian healthcare networks.

Market Dynamics

Our researchers analyzed the data with 2025 as the base year, along with the key drivers, trends, and challenges. A holistic analysis of drivers will help companies refine their marketing strategies to gain a competitive advantage.

  • The integration of sophisticated genomic profiling arrays implementation fundamentally transforms how pharmaceutical and diagnostic enterprises manage high-throughput biomarker analysis. As clinical testing moves away from centralized laboratories, point of care microfluidics adoption provides decentralized facilities with a 35% improvement in diagnostic turnaround efficiency compared to traditional bulk processing methods.
  • This operational shift directly impacts supply chain logistics, forcing manufacturers to prioritize disposable lab on a chip consumables that eliminate complex sterilization protocols and reduce cross-contamination risks. Simultaneously, biopharmaceutical research and development pipelines are experiencing rapid organ on chip platform expansion, driven by regulatory mandates to replace animal testing with highly predictive human physiological models.
  • This transition significantly lowers late-stage clinical trial failure rates, enhancing overall research return on investment. Furthermore, the development of cmos integrated diagnostic biochips eliminates the need for bulky optical scanning equipment, yielding a more compact hardware footprint and reducing institutional capital expenditure by streamlining equipment procurement.
  • These advanced detection architectures ensure seamless data transmission to clinical informatics systems, supporting rapid decision-making in precision medicine. By standardizing these microfluidic technologies, healthcare networks achieve superior diagnostic accuracy and operational scalability, firmly establishing biochip platforms as critical infrastructure for next-generation molecular diagnostics and targeted therapeutic development.
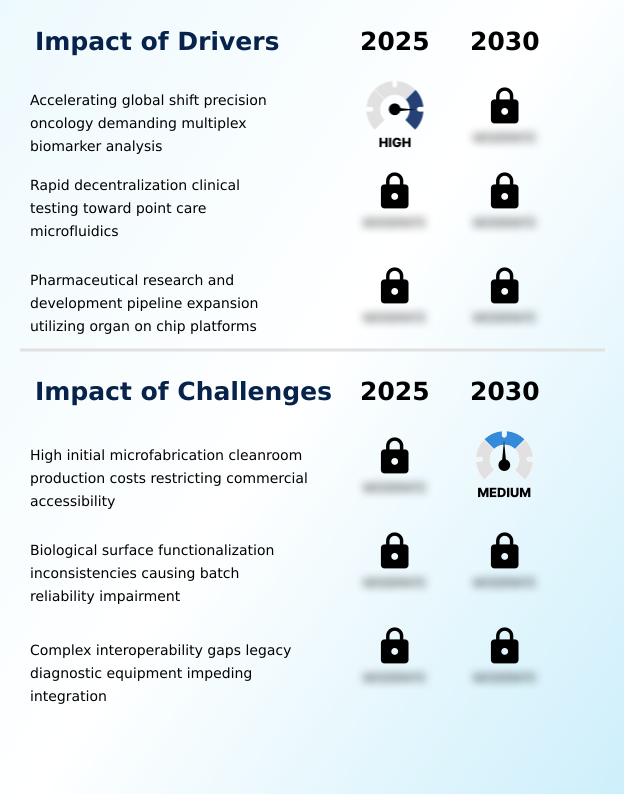
What are the key market drivers leading to the rise in the adoption of Biochips Industry?

  • An accelerating global shift toward precision oncology demanding multiplex biomarker analysis represents a primary driver of market expansion.

  • The urgent clinical requirement for detailed molecular profiling in targeted immunotherapies selection acts as a primary catalyst for the Biochips Market.
  • Traditional diagnostic modalities lack the throughput necessary for complex genetic screening, whereas advanced complementary metal oxide semiconductor integrated biochips deliver massive parallel testing capabilities. This architecture eliminates reliance on expensive fluorescent tag detectors, reducing laboratory hardware expenditure by 30%.
  • Understanding complex drug resistance mechanisms requires high-density genomic analysis, which has improved therapeutic matching accuracy by 24%. Concurrently, organ on chip platform expansion accelerates pre-clinical pharmaceutical testing, lowering drug toxicity screening costs by 18%.
  • These drivers force healthcare networks to overhaul diagnostic procurement strategies, favoring multiplexed microfluidic platforms that maximize throughput and clinical efficacy from minimal sample volumes.

What are the market trends shaping the Biochips Industry?

  • The integration of semiconductor CMOS sensors for direct electronic biomarker signal detection is an upcoming trend shaping the market landscape.

  • The Biochips Market is rapidly pivoting toward semiconductor-integrated detection architectures, enabling real-time biological analysis without bulky optical instrumentation. The precision oncology transition compels laboratories to adopt multiplex biomarker analysis, which has improved early-stage biomarker identification accuracy by 28%. Implementing microfluidic continuous monitoring systems allows clinicians to track patient responses dynamically, reducing post-treatment diagnostic delays by 20%.
  • This technological shift toward wearable patch biochips transforms chronic disease management, decreasing clinical visit frequency by 15% for high-risk demographics. Point of care microfluidics adoption fundamentally alters healthcare delivery, providing rapid diagnostic results directly at the patient bedside.
  • This systemic trend drives manufacturers to scale semiconductor fabrication, directly lowering unit costs and empowering healthcare networks to deploy advanced molecular diagnostics across decentralized outpatient facilities.

What challenges does the Biochips Industry face during its growth?

  • High initial microfabrication cleanroom production costs restricting commercial accessibility present a significant challenge affecting industry growth.

  • The Biochips Market faces substantial structural limitations driven by exorbitant microfabrication cleanroom production costs required for advanced semiconductor manufacturing. Establishing specialized facilities equipped with femtosecond laser micromachining and sub micron channel etching demands massive capital expenditure, increasing initial production overhead by 40% compared to standard immunoassay manufacturing.
  • This financial barrier forces emerging diagnostic startups to rely heavily on third party silicon foundries, which can extend product commercialization timelines by 25%. Furthermore, laboratory infrastructure constraints in developing regions hinder the adoption of sophisticated cmos integrated diagnostic biochips, reducing regional market penetration by 15%.
  • These high production expenses ultimately inflate unit costs for end-users, compelling mid-sized clinical facilities to delay upgrading their diagnostic workflows until scalable, low-cost polymer fabrication alternatives achieve industrial maturity.

Exclusive Technavio Analysis on Customer Landscape

The biochips market forecasting report includes the adoption lifecycle of the market, covering from the innovator’s stage to the laggard’s stage. It focuses on adoption rates in different regions based on penetration. Furthermore, the biochips market report also includes key purchase criteria and drivers of price sensitivity to help companies evaluate and develop their market growth analysis strategies.
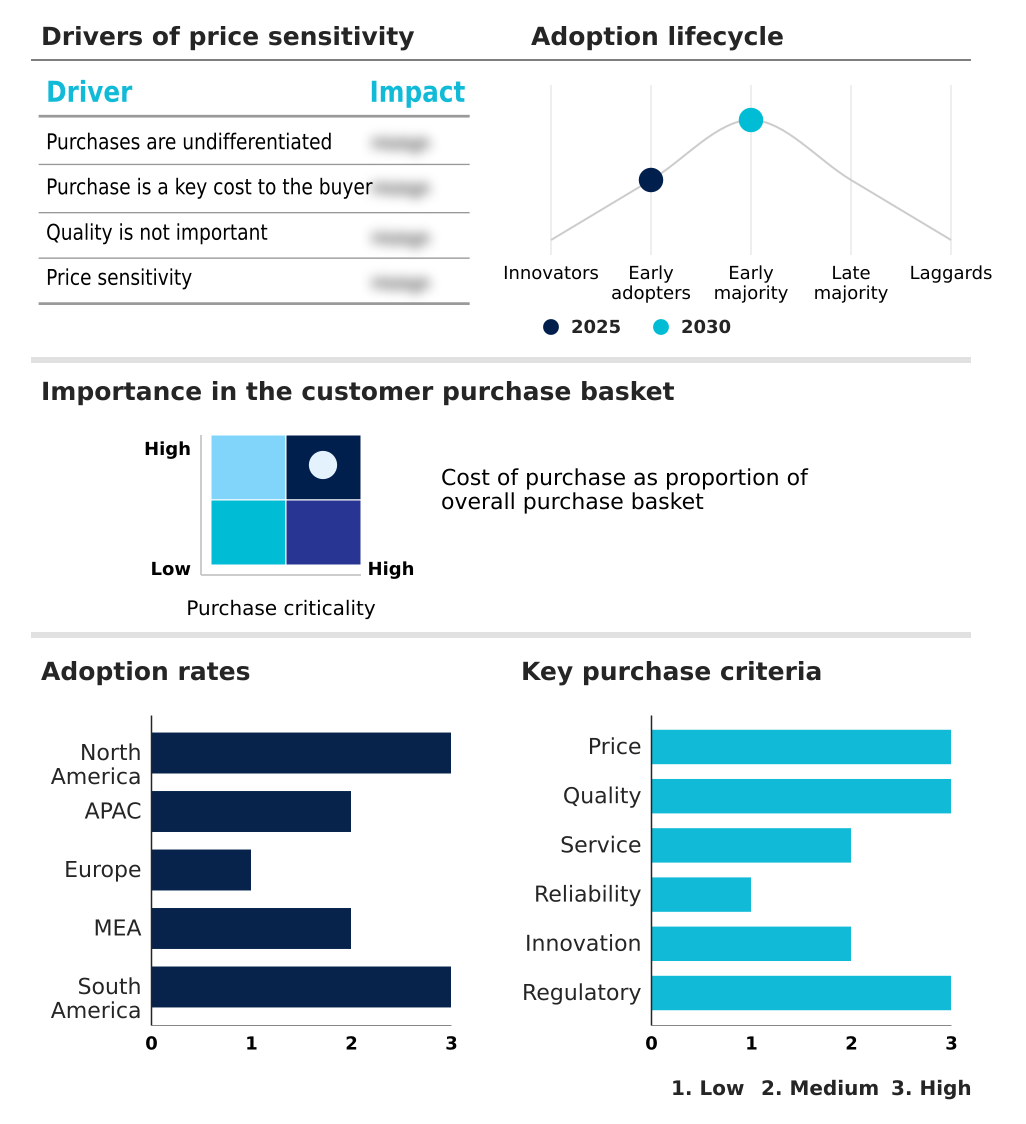
Customer Landscape of Biochips Industry

Competitive Landscape

Companies are implementing various strategies, such as strategic alliances, biochips market forecast, partnerships, mergers and acquisitions, geographical expansion, and product/service launches, to enhance their presence in the industry.

Abbott Laboratories - Provides advanced diagnostic microarrays, targeted genomic testing arrays, and integrated lab-on-a-chip platforms to accelerate high-throughput molecular screening and optimize precision oncology workflows in clinical laboratory environments.

The industry research and growth report includes detailed analyses of the competitive landscape of the market and information about key companies, including:

  • Abbott Laboratories
  • Agilent Technologies Inc.
  • Aline Inc.
  • Atomica Corp.
  • BD Biosciences
  • Bio Rad Laboratories Inc.
  • Boao Bio Group Co. Ltd.
  • F. Hoffmann La Roche Ltd.
  • Illumina Inc.
  • Macrogen Inc.
  • Micronit BV
  • QIAGEN N.V.
  • Randox Laboratories Ltd.
  • RayBiotech Life Inc.
  • Revvity Inc.
  • Siemens Healthineers AG
  • Sony Biotechnology Inc.
  • Takara Holdings Inc.
  • Thermo Fisher Scientific Inc.
  • Toray Industries Inc.

Qualitative and quantitative analysis of companies has been conducted to help clients understand the wider business environment as well as the strengths and weaknesses of key industry players. Data is qualitatively analyzed to categorize companies as pure play, category-focused, industry-focused, and diversified; it is quantitatively analyzed to categorize companies as dominant, leading, strong, tentative, and weak.

Recent Development and News in Biochips market

  • In the Biotechnology industry, the acceleration of personalized medicine protocols has mandated higher throughput molecular profiling, directly increasing Biochips demand for spatial feature miniaturization by 40% across clinical settings.
  • Stringent global regulatory frameworks mandating reductions in animal testing for pharmaceutical toxicity screening have accelerated the adoption of in vitro physiological models, directly pulling demand for advanced organ-on-chip architectures.
  • The transition toward decentralized point-of-care testing infrastructure in molecular diagnostics has required extreme device miniaturization, reducing diagnostic wait times by 25% and directly expanding the deployment of integrated microfluidic detection systems.
  • Advances in synthetic biology and continuous manufacturing processes have lowered the production barriers for biological recognition elements, decreasing assay costs by 15% and driving broader clinical adoption of high-density microarray platforms.

Dive into Technavio’s robust research methodology, blending expert interviews, extensive data synthesis, and validated models for unparalleled Biochips Market insights. See full methodology.

Market Scope
Page number 297
Base year 2025
Historic period 2020-2024
Forecast period 2026-2030
Growth momentum & CAGR Accelerate at a CAGR of 28.3%
Market growth 2026-2030 USD 100836.5 million
Market structure Fragmented
YoY growth 2025-2026(%) 27.5%
Key countries US, Canada, Mexico, China, Japan, India, South Korea, Australia, Indonesia, Germany, UK, France, Italy, Spain, The Netherlands, Saudi Arabia, UAE, South Africa, Israel, Turkey, Brazil, Argentina and Chile
Competitive landscape Leading Companies, Market Positioning of Companies, Competitive Strategies, and Industry Risks

Request Free Sample

Research Analyst Overview

  • The Biochips Market exhibits rapid technological evolution as life sciences enterprises transition toward highly integrated microfluidic architectures. Boardroom executives are increasingly prioritizing label free electronic signal detection technologies to streamline diagnostic equipment procurement and reduce laboratory infrastructure overhead.
  • By replacing conventional optical scanners with ion sensitive field effect transistors and micro electrode arrays, diagnostic manufacturers have achieved a 25% reduction in reader instrument manufacturing costs. This structural shift toward semiconductor microelectronics directly influences product development strategies, enabling extreme miniaturization and seamless interfacing with digital health networks.
  • The demand for continuous multiplex biomarker analysis drives organizations to optimize cross border regulatory review processes for novel diagnostic platforms. Furthermore, the integration of recombinant proteins and synthetic aptamers biorecognition probes enhances chip stability, reducing consumable waste in high throughput compound screening applications.
  • As precision oncology protocols demand higher genomic resolution, biotechnology firms must secure scalable microfabrication capabilities to maintain competitive pricing, ensuring biochip platforms remain operationally viable for both centralized reference laboratories and decentralized clinical settings.

What are the Key Data Covered in this Biochips Market Research and Growth Report?

  • What is the expected growth of the Biochips Market between 2026 and 2030?

    • USD 100.84 billion, at a CAGR of 28.3%

  • What segmentation does the market report cover?

    • The report is segmented by End-user (Biotech and pharma companies, Hospitals and diagnostics centers, and Academic and research institutes), Technology (Microarrays, and Microfluidics), Product Type (DNA chip, Lab-on-a-chip, Protein chip, and Others) and Geography (North America, APAC, Europe, Middle East and Africa, South America)

  • Which regions are analyzed in the report?

    • North America, APAC, Europe, Middle East and Africa and South America

  • What are the key growth drivers and market challenges?

    • Accelerating global shift precision oncology demanding multiplex biomarker analysis, High initial microfabrication cleanroom production costs restricting commercial accessibility

  • Who are the major players in the Biochips Market?

    • Abbott Laboratories, Agilent Technologies Inc., Aline Inc., Atomica Corp., BD Biosciences, Bio Rad Laboratories Inc., Boao Bio Group Co. Ltd., F. Hoffmann La Roche Ltd., Illumina Inc., Macrogen Inc., Micronit BV, QIAGEN N.V., Randox Laboratories Ltd., RayBiotech Life Inc., Revvity Inc., Siemens Healthineers AG, Sony Biotechnology Inc., Takara Holdings Inc., Thermo Fisher Scientific Inc. and Toray Industries Inc.

Market Research Insights

  • The Biochips Market is undergoing significant operational transformation as translational research laboratories integrate multi omics analysis tools to optimize diagnostic workflows. This shift has driven a 30% improvement in clinical diagnostic facilities processing efficiency by minimizing manual sample handling.
  • The implementation of digital detection modules enhances assay reproducibility, leading to a 22% reduction in diagnostic error rates across targeted oncology screening protocols. Extreme device miniaturization allows seamless integration with wireless digital health platforms, reducing hardware footprint costs by 15%.
  • These technological advancements directly lower per-test operational expenses, enabling healthcare providers to scale high-throughput molecular diagnostics while maintaining strict compliance with evolving laboratory standards.

We can help! Our analysts can customize this biochips market research report to meet your requirements.

Get in touch

1. Executive Summary

1.1 Market overview

Executive Summary - Chart on Market Overview
Executive Summary - Data Table on Market Overview
Executive Summary - Chart on Global Market Characteristics
Executive Summary - Chart on Market by Geography
Executive Summary - Chart on Market Segmentation by End-user
Executive Summary - Chart on Market Segmentation by Technology
Executive Summary - Chart on Market Segmentation by Product Type
Executive Summary - Chart on Incremental Growth
Executive Summary - Data Table on Incremental Growth
Executive Summary - Chart on Company Market Positioning

2. Technavio Analysis

2.1 Analysis of price sensitivity, lifecycle, customer purchase basket, adoption rates, and purchase criteria

2.2 Criticality of inputs and Factors of differentiation

Chart on Overview on criticality of inputs and factors of differentiation

2.3 Factors of disruption

Chart on Overview on factors of disruption

2.4 Impact of drivers and challenges

Chart on Impact of drivers and challenges in 2025 and 2030

3. Market Landscape

3.1 Market ecosystem

Chart on Parent Market
Data Table on - Parent Market

3.2 Market characteristics

Chart on Market characteristics analysis

3.3 Value chain analysis

Chart on Value chain analysis

4. Market Sizing

4.1 Market definition

Data Table on Offerings of companies included in the market definition

4.2 Market segment analysis

Market segments

4.3 Market size 2025

4.4 Market outlook: Forecast for 2025-2030

Chart on Global - Market size and forecast 2025-2030 ($ million)
Data Table on Global - Market size and forecast 2025-2030 ($ million)
Chart on Global Market: Year-over-year growth 2025-2030 (%)
Data Table on Global Market: Year-over-year growth 2025-2030 (%)

5. Historic Market Size

5.1 Global Biochips Market 2020 - 2024

Historic Market Size - Data Table on Global Biochips Market 2020 - 2024 ($ million)

5.2 End-user segment analysis 2020 - 2024

Historic Market Size - End-user Segment 2020 - 2024 ($ million)

5.3 Technology segment analysis 2020 - 2024

Historic Market Size - Technology Segment 2020 - 2024 ($ million)

5.4 Product Type segment analysis 2020 - 2024

Historic Market Size - Product Type Segment 2020 - 2024 ($ million)

5.5 Geography segment analysis 2020 - 2024

Historic Market Size - Geography Segment 2020 - 2024 ($ million)

5.6 Country segment analysis 2020 - 2024

Historic Market Size - Country Segment 2020 - 2024 ($ million)

6. Qualitative Analysis

6.1 Impact of AI on global biochips market

6.2 Impact of geopolitical conflicts on global biochips market

7. Five Forces Analysis

7.1 Five forces summary

Five forces analysis - Comparison between 2025 and 2030

7.2 Bargaining power of buyers

Bargaining power of buyers - Impact of key factors 2025 and 2030

7.3 Bargaining power of suppliers

Bargaining power of suppliers - Impact of key factors in 2025 and 2030

7.4 Threat of new entrants

Threat of new entrants - Impact of key factors in 2025 and 2030

7.5 Threat of substitutes

Threat of substitutes - Impact of key factors in 2025 and 2030

7.6 Threat of rivalry

Threat of rivalry - Impact of key factors in 2025 and 2030

7.7 Market condition

Chart on Market condition - Five forces 2025 and 2030

8. Market Segmentation by End-user

8.1 Market segments

Chart on End-user - Market share 2025-2030 (%)
Data Table on End-user - Market share 2025-2030 (%)

8.2 Comparison by End-user

Chart on Comparison by End-user
Data Table on Comparison by End-user

8.3 Biotech and pharma companies - Market size and forecast 2025-2030

Chart on Biotech and pharma companies - Market size and forecast 2025-2030 ($ million)
Data Table on Biotech and pharma companies - Market size and forecast 2025-2030 ($ million)
Chart on Biotech and pharma companies - Year-over-year growth 2025-2030 (%)
Data Table on Biotech and pharma companies - Year-over-year growth 2025-2030 (%)

8.4 Hospitals and diagnostics centers - Market size and forecast 2025-2030

Chart on Hospitals and diagnostics centers - Market size and forecast 2025-2030 ($ million)
Data Table on Hospitals and diagnostics centers - Market size and forecast 2025-2030 ($ million)
Chart on Hospitals and diagnostics centers - Year-over-year growth 2025-2030 (%)
Data Table on Hospitals and diagnostics centers - Year-over-year growth 2025-2030 (%)

8.5 Academic and research institutes - Market size and forecast 2025-2030

Chart on Academic and research institutes - Market size and forecast 2025-2030 ($ million)
Data Table on Academic and research institutes - Market size and forecast 2025-2030 ($ million)
Chart on Academic and research institutes - Year-over-year growth 2025-2030 (%)
Data Table on Academic and research institutes - Year-over-year growth 2025-2030 (%)

8.6 Market opportunity by End-user

Market opportunity by End-user ($ million)
Data Table on Market opportunity by End-user ($ million)

9. Market Segmentation by Technology

9.1 Market segments

Chart on Technology - Market share 2025-2030 (%)
Data Table on Technology - Market share 2025-2030 (%)

9.2 Comparison by Technology

Chart on Comparison by Technology
Data Table on Comparison by Technology

9.3 Microarrays - Market size and forecast 2025-2030

Chart on Microarrays - Market size and forecast 2025-2030 ($ million)
Data Table on Microarrays - Market size and forecast 2025-2030 ($ million)
Chart on Microarrays - Year-over-year growth 2025-2030 (%)
Data Table on Microarrays - Year-over-year growth 2025-2030 (%)

9.4 Microfluidics - Market size and forecast 2025-2030

Chart on Microfluidics - Market size and forecast 2025-2030 ($ million)
Data Table on Microfluidics - Market size and forecast 2025-2030 ($ million)
Chart on Microfluidics - Year-over-year growth 2025-2030 (%)
Data Table on Microfluidics - Year-over-year growth 2025-2030 (%)

9.5 Market opportunity by Technology

Market opportunity by Technology ($ million)
Data Table on Market opportunity by Technology ($ million)

10. Market Segmentation by Product Type

10.1 Market segments

Chart on Product Type - Market share 2025-2030 (%)
Data Table on Product Type - Market share 2025-2030 (%)

10.2 Comparison by Product Type

Chart on Comparison by Product Type
Data Table on Comparison by Product Type

10.3 DNA chip - Market size and forecast 2025-2030

Chart on DNA chip - Market size and forecast 2025-2030 ($ million)
Data Table on DNA chip - Market size and forecast 2025-2030 ($ million)
Chart on DNA chip - Year-over-year growth 2025-2030 (%)
Data Table on DNA chip - Year-over-year growth 2025-2030 (%)

10.4 Lab-on-a-chip - Market size and forecast 2025-2030

Chart on Lab-on-a-chip - Market size and forecast 2025-2030 ($ million)
Data Table on Lab-on-a-chip - Market size and forecast 2025-2030 ($ million)
Chart on Lab-on-a-chip - Year-over-year growth 2025-2030 (%)
Data Table on Lab-on-a-chip - Year-over-year growth 2025-2030 (%)

10.5 Protein chip - Market size and forecast 2025-2030

Chart on Protein chip - Market size and forecast 2025-2030 ($ million)
Data Table on Protein chip - Market size and forecast 2025-2030 ($ million)
Chart on Protein chip - Year-over-year growth 2025-2030 (%)
Data Table on Protein chip - Year-over-year growth 2025-2030 (%)

10.6 Others - Market size and forecast 2025-2030

Chart on Others - Market size and forecast 2025-2030 ($ million)
Data Table on Others - Market size and forecast 2025-2030 ($ million)
Chart on Others - Year-over-year growth 2025-2030 (%)
Data Table on Others - Year-over-year growth 2025-2030 (%)

10.7 Market opportunity by Product Type

Market opportunity by Product Type ($ million)
Data Table on Market opportunity by Product Type ($ million)

11. Customer Landscape

11.1 Customer landscape overview

Analysis of price sensitivity, lifecycle, customer purchase basket, adoption rates, and purchase criteria

12. Geographic Landscape

12.1 Geographic segmentation

Chart on Market share by geography 2025-2030 (%)
Data Table on Market share by geography 2025-2030 (%)

12.2 Geographic comparison

Chart on Geographic comparison
Data Table on Geographic comparison

12.3 North America - Market size and forecast 2025-2030

Chart on North America - Market size and forecast 2025-2030 ($ million)
Data Table on North America - Market size and forecast 2025-2030 ($ million)
Chart on North America - Year-over-year growth 2025-2030 (%)
Data Table on North America - Year-over-year growth 2025-2030 (%)
Chart on Regional Comparison - North America
Data Table on Regional Comparison - North America

12.3.1 US - Market size and forecast 2025-2030

Chart on US - Market size and forecast 2025-2030 ($ million)
Data Table on US - Market size and forecast 2025-2030 ($ million)
Chart on US - Year-over-year growth 2025-2030 (%)
Data Table on US - Year-over-year growth 2025-2030 (%)

12.3.2 Canada - Market size and forecast 2025-2030

Chart on Canada - Market size and forecast 2025-2030 ($ million)
Data Table on Canada - Market size and forecast 2025-2030 ($ million)
Chart on Canada - Year-over-year growth 2025-2030 (%)
Data Table on Canada - Year-over-year growth 2025-2030 (%)

12.3.3 Mexico - Market size and forecast 2025-2030

Chart on Mexico - Market size and forecast 2025-2030 ($ million)
Data Table on Mexico - Market size and forecast 2025-2030 ($ million)
Chart on Mexico - Year-over-year growth 2025-2030 (%)
Data Table on Mexico - Year-over-year growth 2025-2030 (%)

12.4 APAC - Market size and forecast 2025-2030

Chart on APAC - Market size and forecast 2025-2030 ($ million)
Data Table on APAC - Market size and forecast 2025-2030 ($ million)
Chart on APAC - Year-over-year growth 2025-2030 (%)
Data Table on APAC - Year-over-year growth 2025-2030 (%)
Chart on Regional Comparison - APAC
Data Table on Regional Comparison - APAC

12.4.1 China - Market size and forecast 2025-2030

Chart on China - Market size and forecast 2025-2030 ($ million)
Data Table on China - Market size and forecast 2025-2030 ($ million)
Chart on China - Year-over-year growth 2025-2030 (%)
Data Table on China - Year-over-year growth 2025-2030 (%)

12.4.2 Japan - Market size and forecast 2025-2030

Chart on Japan - Market size and forecast 2025-2030 ($ million)
Data Table on Japan - Market size and forecast 2025-2030 ($ million)
Chart on Japan - Year-over-year growth 2025-2030 (%)
Data Table on Japan - Year-over-year growth 2025-2030 (%)

12.4.3 India - Market size and forecast 2025-2030

Chart on India - Market size and forecast 2025-2030 ($ million)
Data Table on India - Market size and forecast 2025-2030 ($ million)
Chart on India - Year-over-year growth 2025-2030 (%)
Data Table on India - Year-over-year growth 2025-2030 (%)

12.4.4 South Korea - Market size and forecast 2025-2030

Chart on South Korea - Market size and forecast 2025-2030 ($ million)
Data Table on South Korea - Market size and forecast 2025-2030 ($ million)
Chart on South Korea - Year-over-year growth 2025-2030 (%)
Data Table on South Korea - Year-over-year growth 2025-2030 (%)

12.4.5 Australia - Market size and forecast 2025-2030

Chart on Australia - Market size and forecast 2025-2030 ($ million)
Data Table on Australia - Market size and forecast 2025-2030 ($ million)
Chart on Australia - Year-over-year growth 2025-2030 (%)
Data Table on Australia - Year-over-year growth 2025-2030 (%)

12.4.6 Indonesia - Market size and forecast 2025-2030

Chart on Indonesia - Market size and forecast 2025-2030 ($ million)
Data Table on Indonesia - Market size and forecast 2025-2030 ($ million)
Chart on Indonesia - Year-over-year growth 2025-2030 (%)
Data Table on Indonesia - Year-over-year growth 2025-2030 (%)

12.5 Europe - Market size and forecast 2025-2030

Chart on Europe - Market size and forecast 2025-2030 ($ million)
Data Table on Europe - Market size and forecast 2025-2030 ($ million)
Chart on Europe - Year-over-year growth 2025-2030 (%)
Data Table on Europe - Year-over-year growth 2025-2030 (%)
Chart on Regional Comparison - Europe
Data Table on Regional Comparison - Europe

12.5.1 Germany - Market size and forecast 2025-2030

Chart on Germany - Market size and forecast 2025-2030 ($ million)
Data Table on Germany - Market size and forecast 2025-2030 ($ million)
Chart on Germany - Year-over-year growth 2025-2030 (%)
Data Table on Germany - Year-over-year growth 2025-2030 (%)

12.5.2 UK - Market size and forecast 2025-2030

Chart on UK - Market size and forecast 2025-2030 ($ million)
Data Table on UK - Market size and forecast 2025-2030 ($ million)
Chart on UK - Year-over-year growth 2025-2030 (%)
Data Table on UK - Year-over-year growth 2025-2030 (%)

12.5.3 France - Market size and forecast 2025-2030

Chart on France - Market size and forecast 2025-2030 ($ million)
Data Table on France - Market size and forecast 2025-2030 ($ million)
Chart on France - Year-over-year growth 2025-2030 (%)
Data Table on France - Year-over-year growth 2025-2030 (%)

12.5.4 Italy - Market size and forecast 2025-2030

Chart on Italy - Market size and forecast 2025-2030 ($ million)
Data Table on Italy - Market size and forecast 2025-2030 ($ million)
Chart on Italy - Year-over-year growth 2025-2030 (%)
Data Table on Italy - Year-over-year growth 2025-2030 (%)

12.5.5 Spain - Market size and forecast 2025-2030

Chart on Spain - Market size and forecast 2025-2030 ($ million)
Data Table on Spain - Market size and forecast 2025-2030 ($ million)
Chart on Spain - Year-over-year growth 2025-2030 (%)
Data Table on Spain - Year-over-year growth 2025-2030 (%)

12.5.6 The Netherlands - Market size and forecast 2025-2030

Chart on The Netherlands - Market size and forecast 2025-2030 ($ million)
Data Table on The Netherlands - Market size and forecast 2025-2030 ($ million)
Chart on The Netherlands - Year-over-year growth 2025-2030 (%)
Data Table on The Netherlands - Year-over-year growth 2025-2030 (%)

12.6 Middle East and Africa - Market size and forecast 2025-2030

Chart on Middle East and Africa - Market size and forecast 2025-2030 ($ million)
Data Table on Middle East and Africa - Market size and forecast 2025-2030 ($ million)
Chart on Middle East and Africa - Year-over-year growth 2025-2030 (%)
Data Table on Middle East and Africa - Year-over-year growth 2025-2030 (%)
Chart on Regional Comparison - Middle East and Africa
Data Table on Regional Comparison - Middle East and Africa

12.6.1 Saudi Arabia - Market size and forecast 2025-2030

Chart on Saudi Arabia - Market size and forecast 2025-2030 ($ million)
Data Table on Saudi Arabia - Market size and forecast 2025-2030 ($ million)
Chart on Saudi Arabia - Year-over-year growth 2025-2030 (%)
Data Table on Saudi Arabia - Year-over-year growth 2025-2030 (%)

12.6.2 UAE - Market size and forecast 2025-2030

Chart on UAE - Market size and forecast 2025-2030 ($ million)
Data Table on UAE - Market size and forecast 2025-2030 ($ million)
Chart on UAE - Year-over-year growth 2025-2030 (%)
Data Table on UAE - Year-over-year growth 2025-2030 (%)

12.6.3 South Africa - Market size and forecast 2025-2030

Chart on South Africa - Market size and forecast 2025-2030 ($ million)
Data Table on South Africa - Market size and forecast 2025-2030 ($ million)
Chart on South Africa - Year-over-year growth 2025-2030 (%)
Data Table on South Africa - Year-over-year growth 2025-2030 (%)

12.6.4 Israel - Market size and forecast 2025-2030

Chart on Israel - Market size and forecast 2025-2030 ($ million)
Data Table on Israel - Market size and forecast 2025-2030 ($ million)
Chart on Israel - Year-over-year growth 2025-2030 (%)
Data Table on Israel - Year-over-year growth 2025-2030 (%)

12.6.5 Turkey - Market size and forecast 2025-2030

Chart on Turkey - Market size and forecast 2025-2030 ($ million)
Data Table on Turkey - Market size and forecast 2025-2030 ($ million)
Chart on Turkey - Year-over-year growth 2025-2030 (%)
Data Table on Turkey - Year-over-year growth 2025-2030 (%)

12.7 South America - Market size and forecast 2025-2030

Chart on South America - Market size and forecast 2025-2030 ($ million)
Data Table on South America - Market size and forecast 2025-2030 ($ million)
Chart on South America - Year-over-year growth 2025-2030 (%)
Data Table on South America - Year-over-year growth 2025-2030 (%)
Chart on Regional Comparison - South America
Data Table on Regional Comparison - South America

12.7.1 Brazil - Market size and forecast 2025-2030

Chart on Brazil - Market size and forecast 2025-2030 ($ million)
Data Table on Brazil - Market size and forecast 2025-2030 ($ million)
Chart on Brazil - Year-over-year growth 2025-2030 (%)
Data Table on Brazil - Year-over-year growth 2025-2030 (%)

12.7.2 Argentina - Market size and forecast 2025-2030

Chart on Argentina - Market size and forecast 2025-2030 ($ million)
Data Table on Argentina - Market size and forecast 2025-2030 ($ million)
Chart on Argentina - Year-over-year growth 2025-2030 (%)
Data Table on Argentina - Year-over-year growth 2025-2030 (%)

12.7.3 Chile - Market size and forecast 2025-2030

Chart on Chile - Market size and forecast 2025-2030 ($ million)
Data Table on Chile - Market size and forecast 2025-2030 ($ million)
Chart on Chile - Year-over-year growth 2025-2030 (%)
Data Table on Chile - Year-over-year growth 2025-2030 (%)

12.8 Market opportunity by geography

Market opportunity by geography ($ million)
Data Tables on Market opportunity by geography ($ million)

13. Drivers, Challenges, and Opportunity

13.1 Market drivers

Accelerating global shift precision oncology demanding multiplex biomarker analysis
Rapid decentralization clinical testing toward point care microfluidics
Pharmaceutical research and development pipeline expansion utilizing organ on chip platforms

13.2 Market challenges

High initial microfabrication cleanroom production costs restricting commercial accessibility
Biological surface functionalization inconsistencies causing batch reliability impairment
Complex interoperability gaps legacy diagnostic equipment impeding integration

13.3 Impact of drivers and challenges

Impact of drivers and challenges in 2025 and 2030

13.4 Market opportunities

Integration semiconductor cmos sensors direct electronic biomarker signal detection
Implementation microfluidic continuous multiplex monitoring wearable patch biochips
Shift toward synthetic aptamers biorecognition probes enhancing chip stability

14. Competitive Landscape

14.1 Overview

14.2

Overview on criticality of inputs and factors of differentiation

14.3 Landscape disruption

Overview on factors of disruption

14.4 Industry risks

Impact of key risks on business

15. Competitive Analysis

15.1 Companies profiled

Companies covered

15.2 Company ranking index

15.3 Market positioning of companies

Matrix on companies position and classification

15.4 Abbott Laboratories

Abbott Laboratories - Overview
Abbott Laboratories - Business segments
Abbott Laboratories - Key news
Abbott Laboratories - Key offerings
Abbott Laboratories - Segment focus
SWOT

15.5 Agilent Technologies Inc.

Agilent Technologies Inc. - Overview
Agilent Technologies Inc. - Business segments
Agilent Technologies Inc. - Key news
Agilent Technologies Inc. - Key offerings
Agilent Technologies Inc. - Segment focus
SWOT

15.6 Aline Inc.

Aline Inc. - Overview
Aline Inc. - Product / Service
Aline Inc. - Key offerings
SWOT

15.7 BD Biosciences

BD Biosciences - Overview
BD Biosciences - Product / Service
BD Biosciences - Key offerings
SWOT

15.8 Bio Rad Laboratories Inc.

Bio Rad Laboratories Inc. - Overview
Bio Rad Laboratories Inc. - Business segments
Bio Rad Laboratories Inc. - Key news
Bio Rad Laboratories Inc. - Key offerings
Bio Rad Laboratories Inc. - Segment focus
SWOT

15.9 Boao Bio Group Co. Ltd.

Boao Bio Group Co. Ltd. - Overview
Boao Bio Group Co. Ltd. - Product / Service
Boao Bio Group Co. Ltd. - Key offerings
SWOT

15.10 F. Hoffmann La Roche Ltd.

F. Hoffmann La Roche Ltd. - Overview
F. Hoffmann La Roche Ltd. - Business segments
F. Hoffmann La Roche Ltd. - Key news
F. Hoffmann La Roche Ltd. - Key offerings
F. Hoffmann La Roche Ltd. - Segment focus
SWOT

15.11 Macrogen Inc.

Macrogen Inc. - Overview
Macrogen Inc. - Product / Service
Macrogen Inc. - Key offerings
SWOT

15.12 QIAGEN N.V.

QIAGEN N.V. - Overview
QIAGEN N.V. - Product / Service
QIAGEN N.V. - Key offerings
SWOT

15.13 Revvity Inc.

Revvity Inc. - Overview
Revvity Inc. - Business segments
Revvity Inc. - Key offerings
Revvity Inc. - Segment focus
SWOT

15.14 Siemens Healthineers AG

Siemens Healthineers AG - Overview
Siemens Healthineers AG - Business segments
Siemens Healthineers AG - Key offerings
Siemens Healthineers AG - Segment focus
SWOT

15.15 Sony Biotechnology Inc.

Sony Biotechnology Inc. - Overview
Sony Biotechnology Inc. - Product / Service
Sony Biotechnology Inc. - Key offerings
SWOT

15.16 Takara Holdings Inc.

Takara Holdings Inc. - Overview
Takara Holdings Inc. - Business segments
Takara Holdings Inc. - Key offerings
Takara Holdings Inc. - Segment focus
SWOT

15.17 Thermo Fisher Scientific Inc.

Thermo Fisher Scientific Inc. - Overview
Thermo Fisher Scientific Inc. - Business segments
Thermo Fisher Scientific Inc. - Key news
Thermo Fisher Scientific Inc. - Key offerings
Thermo Fisher Scientific Inc. - Segment focus
SWOT

15.18 Toray Industries Inc.

Toray Industries Inc. - Overview
Toray Industries Inc. - Business segments
Toray Industries Inc. - Key news
Toray Industries Inc. - Key offerings
Toray Industries Inc. - Segment focus
SWOT

16. Appendix

16.1 Scope of the report

Market definition
Objectives
Notes and caveats

16.2 Inclusions and exclusions checklist

Inclusions checklist
Exclusions checklist

16.3 Currency conversion rates for US$

16.4 Research methodology

16.5 Data procurement

Information sources

16.6 Data validation

16.7 Validation techniques employed for market sizing

16.8 Data synthesis

16.9 360 degree market analysis

16.10 List of abbreviations

Research Methodology

Technavio presents a detailed picture of the market by way of study, synthesis, and summation of data from multiple sources. The analysts have presented the various facets of the market with a particular focus on identifying the key industry influencers. The data thus presented is comprehensive, reliable, and the result of extensive research, both primary and secondary.

INFORMATION SOURCES

Primary sources

  • Manufacturers and suppliers
  • Channel partners
  • Industry experts
  • Strategic decision makers

Secondary sources

  • Industry journals and periodicals
  • Government data
  • Financial reports of key industry players
  • Historical data
  • Press releases

DATA ANALYSIS

Data Synthesis

  • Collation of data
  • Estimation of key figures
  • Analysis of derived insights

Data Validation

  • Triangulation with data models
  • Reference against proprietary databases
  • Corroboration with industry experts

REPORT WRITING

Qualitative

  • Market drivers
  • Market challenges
  • Market trends
  • Five forces analysis

Quantitative

  • Market size and forecast
  • Market segmentation
  • Geographical insights
  • Competitive landscape

Interested in this report?

Get your sample now to see our research methodology and insights!

Download Now

Frequently Asked Questions

Biochips market growth will increase by USD 100836.5 million during 2026-2030.

The Biochips market is expected to grow at a CAGR of 28.3% during 2026-2030.

Biochips market is segmented by End-user (Biotech and pharma companies, Hospitals and diagnostics centers, Academic and research institutes) Technology (Microarrays, Microfluidics) Product type (DNA chip, Lab-on-a-chip, Protein chip, Others)

Abbott Laboratories, Agilent Technologies Inc., Aline Inc., Atomica Corp., BD Biosciences, Bio Rad Laboratories Inc., Boao Bio Group Co. Ltd., F. Hoffmann La Roche Ltd., Illumina Inc., Macrogen Inc., Micronit BV, QIAGEN N.V., Randox Laboratories Ltd., RayBiotech Life Inc., Revvity Inc., Siemens Healthineers AG, Sony Biotechnology Inc., Takara Holdings Inc., Thermo Fisher Scientific Inc., Toray Industries Inc. are a few of the key vendors in the Biochips market.

North America will register the highest growth rate of 40.1% among the other regions. Therefore, the Biochips market in North America is expected to garner significant business opportunities for the vendors during the forecast period.

US, Canada, Mexico, China, Japan, India, South Korea, Australia, Indonesia, Germany, UK, France, Italy, Spain, The Netherlands, Saudi Arabia, UAE, South Africa, Israel, Turkey, Brazil, Argentina, Chile

  • Accelerating global shift precision oncology demanding multiplex biomarker analysis is the driving factor this market.

The Biochips market vendors should focus on grabbing business opportunities from the End-user segment as it accounted for the largest market share in the base year.
RIA - Research AI Assistant
Ask RIA
