
Biotech Market Analysis, Size, and Forecast 2026-2030: North America (US, Canada, and Mexico), Europe (Germany, UK, and France), Asia (China, India, and Japan), South America (Brazil, Argentina, and Colombia), Middle East and Africa (Saudi Arabia, UAE, and South Africa), Rest of World (ROW)

Biotech Market Analysis, Size, and Forecast 2026-2030:
North America (US, Canada, and Mexico), Europe (Germany, UK, and France), Asia (China, India, and Japan), South America (Brazil, Argentina, and Colombia), Middle East and Africa (Saudi Arabia, UAE, and South Africa), Rest of World (ROW)

Published: Oct 2026 313 Pages SKU: IRTNTR80513

Market Overview at a Glance

$967.1 B
Market Opportunity
13.2%
CAGR 2025 - 2030
46.9%
North America Growth
$304.3 B
Biologics segment 2024

Biotech Market Size 2026-2030

The biotech market size is valued to increase by USD 967.1 billion, at a CAGR of 13.2% from 2025 to 2030. Rise of artificial intelligence in discovery will drive the biotech market.

Major Market Trends & Insights

  • North America dominated the market and accounted for a 46.9% growth during the forecast period.
  • By Product - Biologics segment was valued at USD 304.3 billion in 2024
  • By Type - Red biotechnology segment accounted for the largest market revenue share in 2024

Market Size & Forecast

  • Market Opportunities: USD 1685.14 billion
  • Market Future Opportunities: USD 967.1 billion
  • CAGR from 2025 to 2030 : 13.2%

Market Summary

  • The Biotech market operates as a highly dynamic ecosystem driven by continuous scientific breakthroughs in molecular engineering and genomic research. The rapid integration of computational biology drastically reduces the duration required for preclinical target validation, serving as a primary driver for industry expansion.
  • Because algorithmic modeling predicts protein folding structures with high accuracy, organizations can accelerate the transition of novel therapeutic candidates from laboratory benches to clinical applications. Real-world supply chain optimization demonstrates this evolution; logistics networks utilizing smart cryogenic storage reduce temperature-related batch spoilage by up to 18%, ensuring the safe delivery of sensitive personalized medicines.
  • However, the sector faces a formidable challenge in high capital requirements and financial friction. Translating theoretical discoveries into commercial therapies demands immense capital, meaning cash flow deficits frequently disrupt clinical trials before product candidates reach regulatory review. Consequently, strategic mergers and capacity expansions remain critical for long-term viability.
  • The convergence of digital infrastructure and cellular engineering fundamentally reshapes treatment protocols, establishing a versatile blueprint for future biopharmaceutical innovation and sustainable agricultural solutions.

What will be the Size of the Biotech Market during the forecast period?
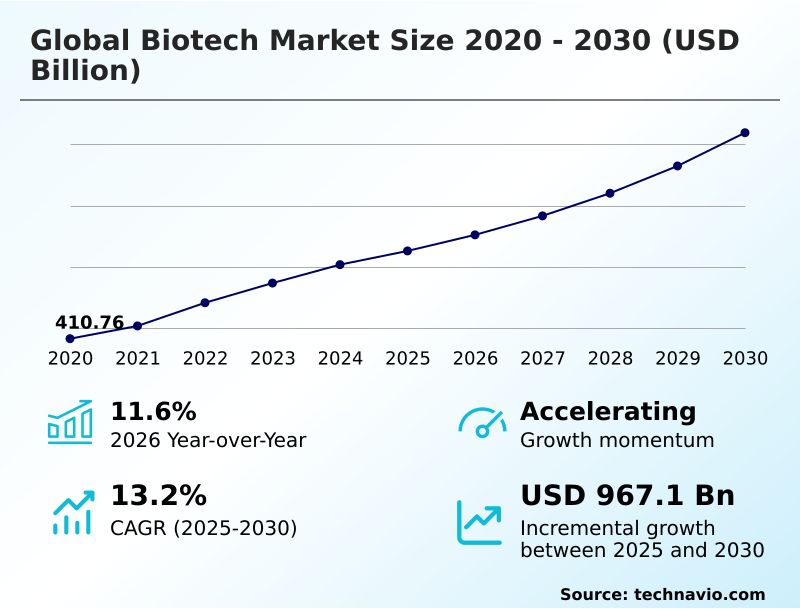
Get Key Insights on Market Forecast (PDF) Get Free Sample

How is the Biotech Market Segmented?

The biotech industry research report provides comprehensive data (region-wise segment analysis), with forecasts and estimates in "USD billion" for the period 2026-2030, as well as historical data from 2020-2024 for the following segments.

  • Product
    • Biologics
    • Therapeutics
    • Diagnostics
    • Industrial biotechnology
    • Others
  • Type
    • Red biotechnology
    • White biotechnology
    • Green biotechnology
    • Grey biotechnology
    • Others
  • Application
    • Healthcare
    • Bioinformatics
    • Agriculture
    • Industrial processing
    • Others
  • Geography
    • North America
      • US
      • Canada
      • Mexico
    • Europe
      • Germany
      • UK
      • France
      • Italy
      • Spain
      • The Netherlands
    • Asia
      • China
      • India
      • Japan
      • South Korea
      • Thailand
      • Indonesia
    • Rest of World (ROW)

By Product Insights

The biologics segment is estimated to witness significant growth during the forecast period.

The biologics segment within the Biotech market operates as a highly complex operational domain focused on manufacturing large molecule interventions.

Utilizing advanced mammalian cell cultures and microbial fermentation systems, organizations synthesize monoclonal antibodies production and fusion proteins synthesis to address severe autoimmune and oncological conditions.

Unlike traditional chemical synthesis, processing living systems requires precise environmental control and continuous monitoring, which drives significant capital expenditure into facility modernization.

Companies integrating single use bioreactors into their manufacturing lines report processing efficiency improvements of up to 25% due to reduced batch turnaround times and lower cross-contamination risks.

This structural shift toward scalable infrastructure allows contract manufacturers to meet stringent regulatory standards while accelerating the commercial deployment of targeted biological therapies.
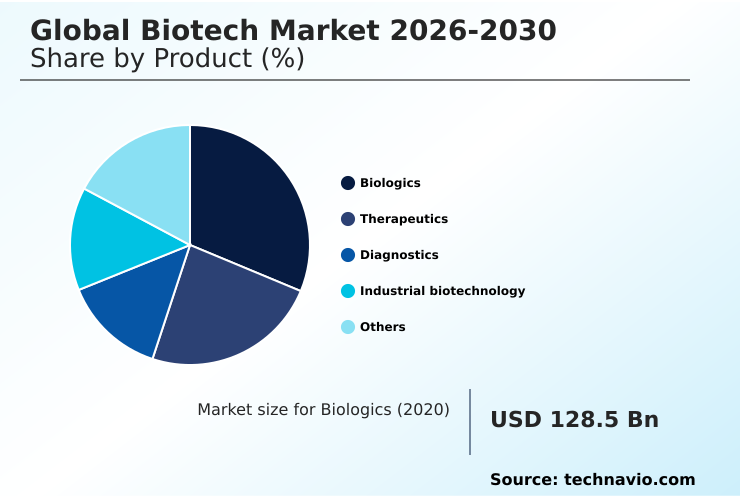
Get Free Sample

The Biologics segment was valued at USD 304.3 billion in 2024 and showed a gradual increase during the forecast period.
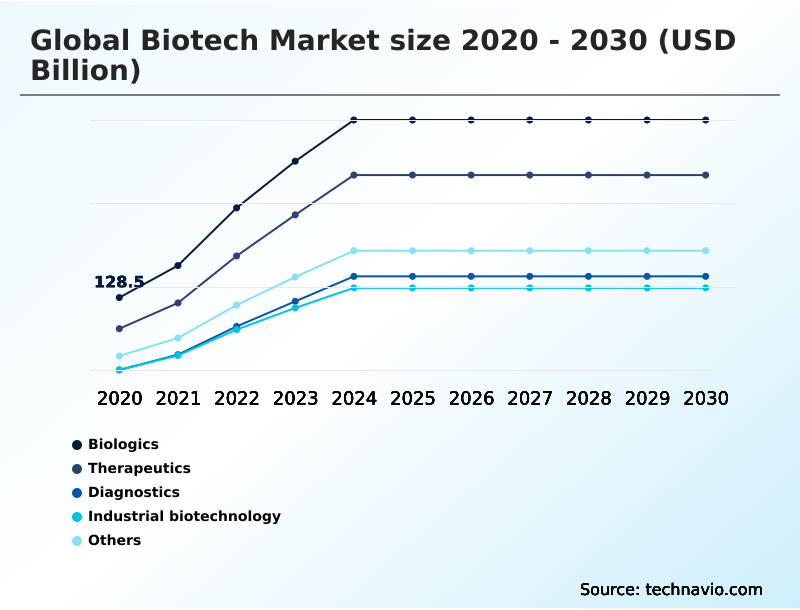
Get Free Sample

Regional Analysis

North America is estimated to contribute 46.9% to the growth of the global market during the forecast period.Technavio’s analysts have elaborately explained the regional trends and drivers that shape the market during the forecast period.
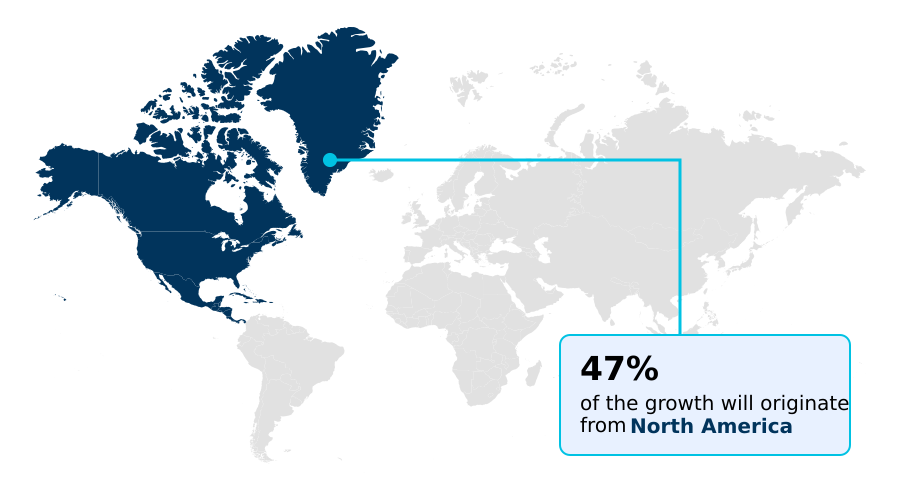
See How Biotech Market Demand is Rising in North America Get Free Sample

The geographic landscape of the Biotech market demonstrates significant regional divergence in the adoption of recombinant dna technology and gene therapies formulation.

North America maintains a mature operational environment, where integration of biomarker companion diagnostics improves clinical trial patient stratification accuracy by 22%.

In contrast, the rapidly industrializing APAC region focuses heavily on scaling manufacturing output, driving a 35% higher adoption rate of precision fermentation technology compared to European counterparts.

This disparity highlights how businesses adapt strategies; Western organizations prioritize specialized molecular profiling systems to navigate complex genomic sequencing workflows, while APAC enterprises optimize cost-efficient volume production.

Additionally, the decentralization of manufacturing infrastructure across emerging economies has lowered regional supply chain logistics costs by approximately 14%, accelerating the commercial availability of advanced biological interventions worldwide.

Market Dynamics

Our researchers analyzed the data with 2025 as the base year, along with the key drivers, trends, and challenges. A holistic analysis of drivers will help companies refine their marketing strategies to gain a competitive advantage.

  • The continuous evolution of the Biotech market demands rigorous operational adaptation to remain competitive in a highly regulated global environment. As therapeutic complexities increase, organizations are prioritizing advanced bioprocessing infrastructure optimization to ensure seamless transitions from pilot testing to commercial-scale manufacturing.
  • This shift heavily relies on computational modeling in drug discovery, which allows researchers to simulate molecular interactions and bypass the lengthy trial-and-error phases historically associated with small-molecule development. Compared to traditional generalized treatment protocols, precision medicine requires significantly higher diagnostic resolution.
  • Consequently, single cell diagnostic platform adoption has surged, enabling clinicians to identify rare cell populations and tailor interventions directly to individual genetic profiles. The commercial maturation of these targeted interventions mirrors the messenger rna platform therapeutic expansion, which has successfully transitioned from urgent viral protection applications into robust oncology and personalized disease management pipelines.
  • To sustain this momentum, manufacturers must address historical bottlenecks in purification and yield. Implementing continuous downstream processing scalability yields an estimated 20% improvement in overall facility throughput, far outpacing the efficiency gains of legacy batch-based systems. This indirect operational comparison highlights a critical business function: maintaining supply chain resilience and minimizing production costs without compromising product sterility.
  • By harmonizing digital analytics with flexible manufacturing hardware, industry leaders secure a definitive advantage in translating advanced biological science into accessible, life-saving commercial therapies.
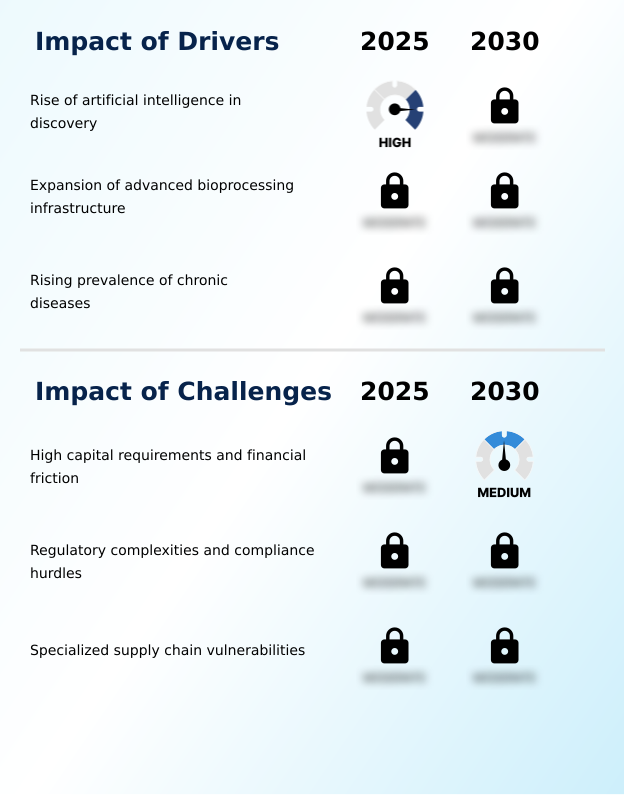
What are the key market drivers leading to the rise in the adoption of Biotech Industry?

  • The rapid integration of artificial intelligence in drug discovery serves as a primary market driver by drastically reducing preclinical validation timelines.

  • The escalating global burden of chronic and rare genetic illnesses acts as a primary driver propelling the Biotech market.
  • Because conventional pharmaceutical interventions often provide only generalized symptom management, there is a surging clinical demand for genetic engineering processes and recombinant dna technology.
  • This demand compels healthcare providers to shift toward precision diagnostics, resulting in a 40% increase in the utilization of polymerase chain reaction testing to accurately identify disease biomarkers.
  • The business effect is profound; contract manufacturers are upgrading facilities with continuous downstream processing to handle complex biologic loads, which improves overall facility throughput by 18%.
  • Integrating single use bioreactors into these modernized workflows directly mitigates cross-contamination risks, ensuring that the mass production of fusion proteins synthesis remains both scalable and cost-effective.

What are the market trends shaping the Biotech Industry?

  • Advancements in messenger RNA platforms represent a transformative market trend. These innovations are reshaping the development of both prophylactic vaccines and targeted immunotherapies across the industry.

  • The Biotech market exhibits a definitive trend toward the widespread integration of bioinformatics computational modeling and mass spectrometry assays across the development lifecycle. This shift is caused by the exponential growth of biological data and the urgent need to accelerate preclinical target validation. Consequently, businesses deploying these advanced digital tools experience a 35% reduction in early-stage discovery timelines.
  • Furthermore, the transition from traditional mammalian systems to microbial cell factories for the synthesis of biobased chemical synthesis drives substantial operational impact. This agricultural and industrial adaptation lowers raw material processing costs by up to 20%, allowing organizations to scale production while meeting stringent environmental compliance mandates.
  • The rapid adoption of rna interference mechanisms and bioaugmentation remediation protocols further illustrates how cross-sector innovations optimize enterprise efficiency, translating complex genomic insights into highly scalable, commercially viable solutions.

What challenges does the Biotech Industry face during its growth?

  • High capital requirements and financial friction pose a significant challenge, restricting the ability of emerging innovators to translate preclinical research into commercial therapies.

  • Navigating the Biotech market presents severe operational challenges stemming from highly sensitive biological materials and fragmented regulatory frameworks. Because products like advanced cellular vaccines and monoclonal antibodies production are acutely vulnerable to temperature excursions, standard logistics networks are entirely inadequate. This vulnerability causes widespread supply chain bottlenecks; organizations lacking validated cryogenic infrastructure experience batch spoilage rates as high as 12%.
  • To combat this, companies must invest heavily in specialized cold-chain hardware, which drives up distribution overhead by an estimated 25%. Furthermore, inconsistent international compliance standards regarding metagenomic sequencing analysis and mammalian cell cultures force global firms to duplicate clinical trials.
  • This regulatory fragmentation extends time-to-market metrics and demands extensive legal oversight, significantly stalling the commercialization of transgenic plant expressions and advanced therapies.

Exclusive Technavio Analysis on Customer Landscape

The biotech market forecasting report includes the adoption lifecycle of the market, covering from the innovator’s stage to the laggard’s stage. It focuses on adoption rates in different regions based on penetration. Furthermore, the biotech market report also includes key purchase criteria and drivers of price sensitivity to help companies evaluate and develop their market growth analysis strategies.
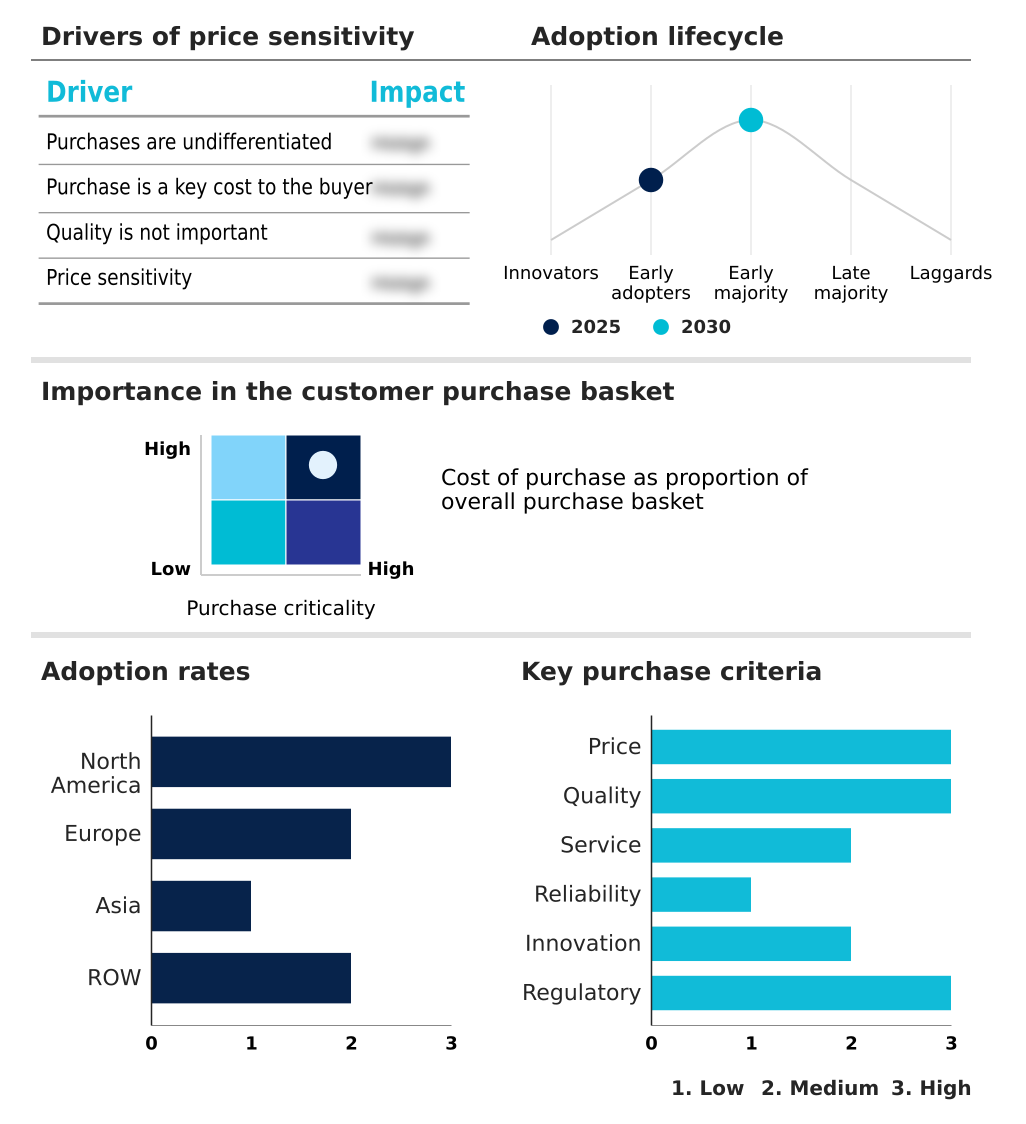
Customer Landscape of Biotech Industry

Competitive Landscape

Companies are implementing various strategies, such as strategic alliances, biotech market forecast, partnerships, mergers and acquisitions, geographical expansion, and product/service launches, to enhance their presence in the industry.

Alnylam Pharmaceuticals Inc. - The organization focuses on discovering, developing, and manufacturing innovative therapeutics, specifically delivering targeted genetic medicines to address severe human disorders.

The industry research and growth report includes detailed analyses of the competitive landscape of the market and information about key companies, including:

  • Alnylam Pharmaceuticals Inc.
  • Amgen Inc.
  • argenx SE
  • Be One Medicines AG
  • Beam Therapeutics Inc.
  • Biogen Inc.
  • BioMarin Pharmaceutical Inc.
  • BioNTech SE
  • CRISPR Therapeutics AG
  • Editas Medicine Inc.
  • Exelixis Inc.
  • Gilead Sciences Inc.
  • Incyte Corp.
  • Intellia Therapeutics Inc.
  • Ionis Pharmaceuticals Inc.
  • Kymera Therapeutics Inc.
  • Legend Biotech Corp.
  • Moderna Inc.
  • Neurocrine Biosciences Inc.
  • Recursion Pharmaceuticals Inc.
  • Regeneron Pharmaceuticals Inc.
  • Vertex Pharmaceuticals Inc.
  • Vervetx Inc.

Qualitative and quantitative analysis of companies has been conducted to help clients understand the wider business environment as well as the strengths and weaknesses of key industry players. Data is qualitatively analyzed to categorize companies as pure play, category-focused, industry-focused, and diversified; it is quantitatively analyzed to categorize companies as dominant, leading, strong, tentative, and weak.

Recent Development and News in Biotech market

  • In the Biotechnology industry, the integration of artificial intelligence algorithms into target discovery has reduced preclinical screening phases by up to 40%, accelerating clinical trial execution and driving downstream demand for scalable Biotech market solutions.
  • Stringent environmental regulations targeting chemical waste have forced a 30% increase in the adoption of circular bioeconomy models, directly expanding the Biotech market application of sustainable industrial processing and environmental remediation strategies.
  • The harmonization of regulatory approval pathways across European and North American jurisdictions has shortened the time-to-market for cell therapies by approximately 15%, increasing reliance on contract development manufacturing within the Biotech market supply chain.
  • Shifts toward precision healthcare have stimulated a 50% rise in the utilization of multi omics datasets, which necessitates advanced cloud based bioinformatics and fundamentally transforms personalized medicine approaches across the Biotech market sector.

Dive into Technavio’s robust research methodology, blending expert interviews, extensive data synthesis, and validated models for unparalleled Biotech Market insights. See full methodology.

Market Scope
Page number 313
Base year 2025
Historic period 2020-2024
Forecast period 2026-2030
Growth momentum & CAGR Accelerate at a CAGR of 13.2%
Market growth 2026-2030 USD 967.1 billion
Market structure Fragmented
YoY growth 2025-2026(%) 11.6%
Key countries US, Canada, Mexico, Germany, UK, France, Italy, Spain, The Netherlands, China, India, Japan, South Korea, Thailand, Indonesia, Brazil, Saudi Arabia, UAE, Argentina, South Africa, Turkey, Colombia and Israel
Competitive landscape Leading Companies, Market Positioning of Companies, Competitive Strategies, and Industry Risks

Request Free Sample

Research Analyst Overview

  • The Biotech market is undergoing a rapid structural transformation driven by the integration of synthetic biology platforms and metabolic engineering pathways. A defining trend is the accelerated adoption of chimeric antigen receptor frameworks and advanced cellular vaccines, which fundamentally alters board-level decisions regarding product strategy and capital allocation.
  • Executives are increasingly pivoting budgets away from conventional chemical synthesis to fund targeted therapeutics development, ensuring long-term competitiveness in an era of personalized medicine. Implementing advanced cellular cultivation systems directly impacts operational efficiency; facilities transitioning to these modernized frameworks have achieved a 30% reduction in processing time per commercial batch.
  • This efficiency gain allows developers to scale the production of messenger ribonucleic acid interventions while maintaining strict compliance with evolving regulatory standards. Furthermore, the strategic deployment of next generation sequencing tools minimizes downstream clinical risks by ensuring precise patient stratification.
  • Organizations that successfully harmonize these complex biological innovations with scalable manufacturing hardware secure a dominant position, redefining therapeutic efficacy and reshaping the economics of global healthcare delivery.

What are the Key Data Covered in this Biotech Market Research and Growth Report?

  • What is the expected growth of the Biotech Market between 2026 and 2030?

    • USD 967.1 billion, at a CAGR of 13.2%

  • What segmentation does the market report cover?

    • The report is segmented by Product (Biologics, Therapeutics, Diagnostics, Industrial biotechnology, and Others), Type (Red biotechnology, White biotechnology, Green biotechnology, Grey biotechnology, and Others), Application (Healthcare, Bioinformatics, Agriculture, Industrial processing, and Others) and Geography (North America, Europe, Asia, Rest of World (ROW))

  • Which regions are analyzed in the report?

    • North America, Europe, Asia and Rest of World (ROW)

  • What are the key growth drivers and market challenges?

    • Rise of artificial intelligence in discovery, High capital requirements and financial friction

  • Who are the major players in the Biotech Market?

    • Alnylam Pharmaceuticals Inc., Amgen Inc., argenx SE, Be One Medicines AG, Beam Therapeutics Inc., Biogen Inc., BioMarin Pharmaceutical Inc., BioNTech SE, CRISPR Therapeutics AG, Editas Medicine Inc., Exelixis Inc., Gilead Sciences Inc., Incyte Corp., Intellia Therapeutics Inc., Ionis Pharmaceuticals Inc., Kymera Therapeutics Inc., Legend Biotech Corp., Moderna Inc., Neurocrine Biosciences Inc., Recursion Pharmaceuticals Inc., Regeneron Pharmaceuticals Inc., Vertex Pharmaceuticals Inc. and Vervetx Inc.

Market Research Insights

  • The Biotech market functions as a critical nexus of scientific innovation and industrial application, fundamentally transforming personalized medicine approaches. As therapeutic modalities shift toward complex biologics, organizations prioritizing bioprocess engineering optimization report production yield improvements of up to 25%.
  • The integration of machine learning analytics into preclinical screening further enhances operational efficiency, reducing late-stage clinical trial failures by an estimated 15%. To manage these sophisticated pipelines, companies are increasingly deploying decentralized biomanufacturing facilities to mitigate supply chain disruptions and lower distribution costs by 12%.
  • This strategic realignment ensures rapid scaling of advanced interventions, solidifying the vital role of high throughput screening in maintaining competitive agility within a highly regulated global health ecosystem.

We can help! Our analysts can customize this biotech market research report to meet your requirements.

Get in touch

1. Executive Summary

1.1 Market overview

Executive Summary - Chart on Market Overview
Executive Summary - Data Table on Market Overview
Executive Summary - Chart on Global Market Characteristics
Executive Summary - Chart on Market by Geography
Executive Summary - Chart on Market Segmentation by Product
Executive Summary - Chart on Market Segmentation by Type
Executive Summary - Chart on Market Segmentation by Application
Executive Summary - Chart on Incremental Growth
Executive Summary - Data Table on Incremental Growth
Executive Summary - Chart on Company Market Positioning

2. Technavio Analysis

2.1 Analysis of price sensitivity, lifecycle, customer purchase basket, adoption rates, and purchase criteria

2.2 Criticality of inputs and Factors of differentiation

Chart on Overview on criticality of inputs and factors of differentiation

2.3 Factors of disruption

Chart on Overview on factors of disruption

2.4 Impact of drivers and challenges

Chart on Impact of drivers and challenges in 2025 and 2030

3. Market Landscape

3.1 Market ecosystem

Chart on Parent Market
Data Table on - Parent Market

3.2 Market characteristics

Chart on Market characteristics analysis

3.3 Value chain analysis

Chart on Value chain analysis

4. Market Sizing

4.1 Market definition

Data Table on Offerings of companies included in the market definition

4.2 Market segment analysis

Market segments

4.3 Market size 2025

4.4 Market outlook: Forecast for 2025-2030

Chart on Global - Market size and forecast 2025-2030 ($ billion)
Data Table on Global - Market size and forecast 2025-2030 ($ billion)
Chart on Global Market: Year-over-year growth 2025-2030 (%)
Data Table on Global Market: Year-over-year growth 2025-2030 (%)

5. Historic Market Size

5.1 Global Biotech Market 2020 - 2024

Historic Market Size - Data Table on Global Biotech Market 2020 - 2024 ($ billion)

5.2 Product segment analysis 2020 - 2024

Historic Market Size - Product Segment 2020 - 2024 ($ billion)

5.3 Type segment analysis 2020 - 2024

Historic Market Size - Type Segment 2020 - 2024 ($ billion)

5.4 Application segment analysis 2020 - 2024

Historic Market Size - Application Segment 2020 - 2024 ($ billion)

5.5 Geography segment analysis 2020 - 2024

Historic Market Size - Geography Segment 2020 - 2024 ($ billion)

5.6 Country segment analysis 2020 - 2024

Historic Market Size - Country Segment 2020 - 2024 ($ billion)

6. Qualitative Analysis

6.1 Impact of AI on Global Biotech Market

6.2 Impact of geopolitical conflicts on Global Biotech Market

7. Five Forces Analysis

7.1 Five forces summary

Five forces analysis - Comparison between 2025 and 2030

7.2 Bargaining power of buyers

Bargaining power of buyers - Impact of key factors 2025 and 2030

7.3 Bargaining power of suppliers

Bargaining power of suppliers - Impact of key factors in 2025 and 2030

7.4 Threat of new entrants

Threat of new entrants - Impact of key factors in 2025 and 2030

7.5 Threat of substitutes

Threat of substitutes - Impact of key factors in 2025 and 2030

7.6 Threat of rivalry

Threat of rivalry - Impact of key factors in 2025 and 2030

7.7 Market condition

Chart on Market condition - Five forces 2025 and 2030

8. Market Segmentation by Product

8.1 Market segments

Chart on Product - Market share 2025-2030 (%)
Data Table on Product - Market share 2025-2030 (%)

8.2 Comparison by Product

Chart on Comparison by Product
Data Table on Comparison by Product

8.3 Biologics - Market size and forecast 2025-2030

Chart on Biologics - Market size and forecast 2025-2030 ($ billion)
Data Table on Biologics - Market size and forecast 2025-2030 ($ billion)
Chart on Biologics - Year-over-year growth 2025-2030 (%)
Data Table on Biologics - Year-over-year growth 2025-2030 (%)

8.4 Therapeutics - Market size and forecast 2025-2030

Chart on Therapeutics - Market size and forecast 2025-2030 ($ billion)
Data Table on Therapeutics - Market size and forecast 2025-2030 ($ billion)
Chart on Therapeutics - Year-over-year growth 2025-2030 (%)
Data Table on Therapeutics - Year-over-year growth 2025-2030 (%)

8.5 Diagnostics - Market size and forecast 2025-2030

Chart on Diagnostics - Market size and forecast 2025-2030 ($ billion)
Data Table on Diagnostics - Market size and forecast 2025-2030 ($ billion)
Chart on Diagnostics - Year-over-year growth 2025-2030 (%)
Data Table on Diagnostics - Year-over-year growth 2025-2030 (%)

8.6 Industrial biotechnology - Market size and forecast 2025-2030

Chart on Industrial biotechnology - Market size and forecast 2025-2030 ($ billion)
Data Table on Industrial biotechnology - Market size and forecast 2025-2030 ($ billion)
Chart on Industrial biotechnology - Year-over-year growth 2025-2030 (%)
Data Table on Industrial biotechnology - Year-over-year growth 2025-2030 (%)

8.7 Others - Market size and forecast 2025-2030

Chart on Others - Market size and forecast 2025-2030 ($ billion)
Data Table on Others - Market size and forecast 2025-2030 ($ billion)
Chart on Others - Year-over-year growth 2025-2030 (%)
Data Table on Others - Year-over-year growth 2025-2030 (%)

8.8 Market opportunity by Product

Market opportunity by Product ($ billion)
Data Table on Market opportunity by Product ($ billion)

9. Market Segmentation by Type

9.1 Market segments

Chart on Type - Market share 2025-2030 (%)
Data Table on Type - Market share 2025-2030 (%)

9.2 Comparison by Type

Chart on Comparison by Type
Data Table on Comparison by Type

9.3 Red biotechnology - Market size and forecast 2025-2030

Chart on Red biotechnology - Market size and forecast 2025-2030 ($ billion)
Data Table on Red biotechnology - Market size and forecast 2025-2030 ($ billion)
Chart on Red biotechnology - Year-over-year growth 2025-2030 (%)
Data Table on Red biotechnology - Year-over-year growth 2025-2030 (%)

9.4 White biotechnology - Market size and forecast 2025-2030

Chart on White biotechnology - Market size and forecast 2025-2030 ($ billion)
Data Table on White biotechnology - Market size and forecast 2025-2030 ($ billion)
Chart on White biotechnology - Year-over-year growth 2025-2030 (%)
Data Table on White biotechnology - Year-over-year growth 2025-2030 (%)

9.5 Green biotechnology - Market size and forecast 2025-2030

Chart on Green biotechnology - Market size and forecast 2025-2030 ($ billion)
Data Table on Green biotechnology - Market size and forecast 2025-2030 ($ billion)
Chart on Green biotechnology - Year-over-year growth 2025-2030 (%)
Data Table on Green biotechnology - Year-over-year growth 2025-2030 (%)

9.6 Grey biotechnology - Market size and forecast 2025-2030

Chart on Grey biotechnology - Market size and forecast 2025-2030 ($ billion)
Data Table on Grey biotechnology - Market size and forecast 2025-2030 ($ billion)
Chart on Grey biotechnology - Year-over-year growth 2025-2030 (%)
Data Table on Grey biotechnology - Year-over-year growth 2025-2030 (%)

9.7 Others - Market size and forecast 2025-2030

Chart on Others - Market size and forecast 2025-2030 ($ billion)
Data Table on Others - Market size and forecast 2025-2030 ($ billion)
Chart on Others - Year-over-year growth 2025-2030 (%)
Data Table on Others - Year-over-year growth 2025-2030 (%)

9.8 Market opportunity by Type

Market opportunity by Type ($ billion)
Data Table on Market opportunity by Type ($ billion)

10. Market Segmentation by Application

10.1 Market segments

Chart on Application - Market share 2025-2030 (%)
Data Table on Application - Market share 2025-2030 (%)

10.2 Comparison by Application

Chart on Comparison by Application
Data Table on Comparison by Application

10.3 Healthcare - Market size and forecast 2025-2030

Chart on Healthcare - Market size and forecast 2025-2030 ($ billion)
Data Table on Healthcare - Market size and forecast 2025-2030 ($ billion)
Chart on Healthcare - Year-over-year growth 2025-2030 (%)
Data Table on Healthcare - Year-over-year growth 2025-2030 (%)

10.4 Bioinformatics - Market size and forecast 2025-2030

Chart on Bioinformatics - Market size and forecast 2025-2030 ($ billion)
Data Table on Bioinformatics - Market size and forecast 2025-2030 ($ billion)
Chart on Bioinformatics - Year-over-year growth 2025-2030 (%)
Data Table on Bioinformatics - Year-over-year growth 2025-2030 (%)

10.5 Agriculture - Market size and forecast 2025-2030

Chart on Agriculture - Market size and forecast 2025-2030 ($ billion)
Data Table on Agriculture - Market size and forecast 2025-2030 ($ billion)
Chart on Agriculture - Year-over-year growth 2025-2030 (%)
Data Table on Agriculture - Year-over-year growth 2025-2030 (%)

10.6 Industrial processing - Market size and forecast 2025-2030

Chart on Industrial processing - Market size and forecast 2025-2030 ($ billion)
Data Table on Industrial processing - Market size and forecast 2025-2030 ($ billion)
Chart on Industrial processing - Year-over-year growth 2025-2030 (%)
Data Table on Industrial processing - Year-over-year growth 2025-2030 (%)

10.7 Others - Market size and forecast 2025-2030

Chart on Others - Market size and forecast 2025-2030 ($ billion)
Data Table on Others - Market size and forecast 2025-2030 ($ billion)
Chart on Others - Year-over-year growth 2025-2030 (%)
Data Table on Others - Year-over-year growth 2025-2030 (%)

10.8 Market opportunity by Application

Market opportunity by Application ($ billion)
Data Table on Market opportunity by Application ($ billion)

11. Customer Landscape

11.1 Customer landscape overview

Analysis of price sensitivity, lifecycle, customer purchase basket, adoption rates, and purchase criteria

12. Geographic Landscape

12.1 Geographic segmentation

Chart on Market share by geography 2025-2030 (%)
Data Table on Market share by geography 2025-2030 (%)

12.2 Geographic comparison

Chart on Geographic comparison
Data Table on Geographic comparison

12.3 North America - Market size and forecast 2025-2030

Chart on North America - Market size and forecast 2025-2030 ($ billion)
Data Table on North America - Market size and forecast 2025-2030 ($ billion)
Chart on North America - Year-over-year growth 2025-2030 (%)
Data Table on North America - Year-over-year growth 2025-2030 (%)
Chart on Regional Comparison - North America
Data Table on Regional Comparison - North America

12.3.1 US - Market size and forecast 2025-2030

Chart on US - Market size and forecast 2025-2030 ($ billion)
Data Table on US - Market size and forecast 2025-2030 ($ billion)
Chart on US - Year-over-year growth 2025-2030 (%)
Data Table on US - Year-over-year growth 2025-2030 (%)

12.3.2 Canada - Market size and forecast 2025-2030

Chart on Canada - Market size and forecast 2025-2030 ($ billion)
Data Table on Canada - Market size and forecast 2025-2030 ($ billion)
Chart on Canada - Year-over-year growth 2025-2030 (%)
Data Table on Canada - Year-over-year growth 2025-2030 (%)

12.3.3 Mexico - Market size and forecast 2025-2030

Chart on Mexico - Market size and forecast 2025-2030 ($ billion)
Data Table on Mexico - Market size and forecast 2025-2030 ($ billion)
Chart on Mexico - Year-over-year growth 2025-2030 (%)
Data Table on Mexico - Year-over-year growth 2025-2030 (%)

12.4 Europe - Market size and forecast 2025-2030

Chart on Europe - Market size and forecast 2025-2030 ($ billion)
Data Table on Europe - Market size and forecast 2025-2030 ($ billion)
Chart on Europe - Year-over-year growth 2025-2030 (%)
Data Table on Europe - Year-over-year growth 2025-2030 (%)
Chart on Regional Comparison - Europe
Data Table on Regional Comparison - Europe

12.4.1 Germany - Market size and forecast 2025-2030

Chart on Germany - Market size and forecast 2025-2030 ($ billion)
Data Table on Germany - Market size and forecast 2025-2030 ($ billion)
Chart on Germany - Year-over-year growth 2025-2030 (%)
Data Table on Germany - Year-over-year growth 2025-2030 (%)

12.4.2 UK - Market size and forecast 2025-2030

Chart on UK - Market size and forecast 2025-2030 ($ billion)
Data Table on UK - Market size and forecast 2025-2030 ($ billion)
Chart on UK - Year-over-year growth 2025-2030 (%)
Data Table on UK - Year-over-year growth 2025-2030 (%)

12.4.3 France - Market size and forecast 2025-2030

Chart on France - Market size and forecast 2025-2030 ($ billion)
Data Table on France - Market size and forecast 2025-2030 ($ billion)
Chart on France - Year-over-year growth 2025-2030 (%)
Data Table on France - Year-over-year growth 2025-2030 (%)

12.4.4 Italy - Market size and forecast 2025-2030

Chart on Italy - Market size and forecast 2025-2030 ($ billion)
Data Table on Italy - Market size and forecast 2025-2030 ($ billion)
Chart on Italy - Year-over-year growth 2025-2030 (%)
Data Table on Italy - Year-over-year growth 2025-2030 (%)

12.4.5 Spain - Market size and forecast 2025-2030

Chart on Spain - Market size and forecast 2025-2030 ($ billion)
Data Table on Spain - Market size and forecast 2025-2030 ($ billion)
Chart on Spain - Year-over-year growth 2025-2030 (%)
Data Table on Spain - Year-over-year growth 2025-2030 (%)

12.4.6 The Netherlands - Market size and forecast 2025-2030

Chart on The Netherlands - Market size and forecast 2025-2030 ($ billion)
Data Table on The Netherlands - Market size and forecast 2025-2030 ($ billion)
Chart on The Netherlands - Year-over-year growth 2025-2030 (%)
Data Table on The Netherlands - Year-over-year growth 2025-2030 (%)

12.5 Asia - Market size and forecast 2025-2030

Chart on Asia - Market size and forecast 2025-2030 ($ billion)
Data Table on Asia - Market size and forecast 2025-2030 ($ billion)
Chart on Asia - Year-over-year growth 2025-2030 (%)
Data Table on Asia - Year-over-year growth 2025-2030 (%)
Chart on Regional Comparison - Asia
Data Table on Regional Comparison - Asia

12.5.1 China - Market size and forecast 2025-2030

Chart on China - Market size and forecast 2025-2030 ($ billion)
Data Table on China - Market size and forecast 2025-2030 ($ billion)
Chart on China - Year-over-year growth 2025-2030 (%)
Data Table on China - Year-over-year growth 2025-2030 (%)

12.5.2 India - Market size and forecast 2025-2030

Chart on India - Market size and forecast 2025-2030 ($ billion)
Data Table on India - Market size and forecast 2025-2030 ($ billion)
Chart on India - Year-over-year growth 2025-2030 (%)
Data Table on India - Year-over-year growth 2025-2030 (%)

12.5.3 Japan - Market size and forecast 2025-2030

Chart on Japan - Market size and forecast 2025-2030 ($ billion)
Data Table on Japan - Market size and forecast 2025-2030 ($ billion)
Chart on Japan - Year-over-year growth 2025-2030 (%)
Data Table on Japan - Year-over-year growth 2025-2030 (%)

12.5.4 South Korea - Market size and forecast 2025-2030

Chart on South Korea - Market size and forecast 2025-2030 ($ billion)
Data Table on South Korea - Market size and forecast 2025-2030 ($ billion)
Chart on South Korea - Year-over-year growth 2025-2030 (%)
Data Table on South Korea - Year-over-year growth 2025-2030 (%)

12.5.5 Thailand - Market size and forecast 2025-2030

Chart on Thailand - Market size and forecast 2025-2030 ($ billion)
Data Table on Thailand - Market size and forecast 2025-2030 ($ billion)
Chart on Thailand - Year-over-year growth 2025-2030 (%)
Data Table on Thailand - Year-over-year growth 2025-2030 (%)

12.5.6 Indonesia - Market size and forecast 2025-2030

Chart on Indonesia - Market size and forecast 2025-2030 ($ billion)
Data Table on Indonesia - Market size and forecast 2025-2030 ($ billion)
Chart on Indonesia - Year-over-year growth 2025-2030 (%)
Data Table on Indonesia - Year-over-year growth 2025-2030 (%)

12.6 Rest of World (ROW) - Market size and forecast 2025-2030

Chart on Rest of World (ROW) - Market size and forecast 2025-2030 ($ billion)
Data Table on Rest of World (ROW) - Market size and forecast 2025-2030 ($ billion)
Chart on Rest of World (ROW) - Year-over-year growth 2025-2030 (%)
Data Table on Rest of World (ROW) - Year-over-year growth 2025-2030 (%)
Chart on Regional Comparison - Rest of World (ROW)
Data Table on Regional Comparison - Rest of World (ROW)

12.6.1 Brazil - Market size and forecast 2025-2030

Chart on Brazil - Market size and forecast 2025-2030 ($ billion)
Data Table on Brazil - Market size and forecast 2025-2030 ($ billion)
Chart on Brazil - Year-over-year growth 2025-2030 (%)
Data Table on Brazil - Year-over-year growth 2025-2030 (%)

12.6.2 Saudi Arabia - Market size and forecast 2025-2030

Chart on Saudi Arabia - Market size and forecast 2025-2030 ($ billion)
Data Table on Saudi Arabia - Market size and forecast 2025-2030 ($ billion)
Chart on Saudi Arabia - Year-over-year growth 2025-2030 (%)
Data Table on Saudi Arabia - Year-over-year growth 2025-2030 (%)

12.6.3 UAE - Market size and forecast 2025-2030

Chart on UAE - Market size and forecast 2025-2030 ($ billion)
Data Table on UAE - Market size and forecast 2025-2030 ($ billion)
Chart on UAE - Year-over-year growth 2025-2030 (%)
Data Table on UAE - Year-over-year growth 2025-2030 (%)

12.6.4 Argentina - Market size and forecast 2025-2030

Chart on Argentina - Market size and forecast 2025-2030 ($ billion)
Data Table on Argentina - Market size and forecast 2025-2030 ($ billion)
Chart on Argentina - Year-over-year growth 2025-2030 (%)
Data Table on Argentina - Year-over-year growth 2025-2030 (%)

12.6.5 South Africa - Market size and forecast 2025-2030

Chart on South Africa - Market size and forecast 2025-2030 ($ billion)
Data Table on South Africa - Market size and forecast 2025-2030 ($ billion)
Chart on South Africa - Year-over-year growth 2025-2030 (%)
Data Table on South Africa - Year-over-year growth 2025-2030 (%)

12.6.6 Turkey - Market size and forecast 2025-2030

Chart on Turkey - Market size and forecast 2025-2030 ($ billion)
Data Table on Turkey - Market size and forecast 2025-2030 ($ billion)
Chart on Turkey - Year-over-year growth 2025-2030 (%)
Data Table on Turkey - Year-over-year growth 2025-2030 (%)

12.6.7 Colombia - Market size and forecast 2025-2030

Chart on Colombia - Market size and forecast 2025-2030 ($ billion)
Data Table on Colombia - Market size and forecast 2025-2030 ($ billion)
Chart on Colombia - Year-over-year growth 2025-2030 (%)
Data Table on Colombia - Year-over-year growth 2025-2030 (%)

12.6.8 Israel - Market size and forecast 2025-2030

Chart on Israel - Market size and forecast 2025-2030 ($ billion)
Data Table on Israel - Market size and forecast 2025-2030 ($ billion)
Chart on Israel - Year-over-year growth 2025-2030 (%)
Data Table on Israel - Year-over-year growth 2025-2030 (%)

12.7 Market opportunity by geography

Market opportunity by geography ($ billion)
Data Tables on Market opportunity by geography ($ billion)

13. Drivers, Challenges, and Opportunity

13.1 Market drivers

Rise of artificial intelligence in discovery
Expansion of advanced bioprocessing infrastructure
Rising prevalence of chronic diseases

13.2 Market challenges

High capital requirements and financial friction
Regulatory complexities and compliance hurdles
Specialized supply chain vulnerabilities

13.3 Impact of drivers and challenges

Impact of drivers and challenges in 2025 and 2030

13.4 Market opportunities

Advancements in messenger RNA platforms
Expansion of plant molecular farming
Adoption of single-cell diagnostics

14. Competitive Landscape

14.1 Overview

14.2

Overview on criticality of inputs and factors of differentiation

14.3 Landscape disruption

Overview on factors of disruption

14.4 Industry risks

Impact of key risks on business

15. Competitive Analysis

15.1 Companies profiled

Companies covered

15.2 Company ranking index

15.3 Market positioning of companies

Matrix on companies position and classification

15.4 Alnylam Pharmaceuticals Inc.

Alnylam Pharmaceuticals Inc. - Overview
Alnylam Pharmaceuticals Inc. - Product / Service
Alnylam Pharmaceuticals Inc. - Key offerings
SWOT

15.5 Amgen Inc.

Amgen Inc. - Overview
Amgen Inc. - Product / Service
Amgen Inc. - Key news
Amgen Inc. - Key offerings
SWOT

15.6 argenx SE

argenx SE - Overview
argenx SE - Product / Service
argenx SE - Key offerings
SWOT

15.7 Be One Medicines AG

Be One Medicines AG - Overview
Be One Medicines AG - Product / Service
Be One Medicines AG - Key offerings
SWOT

15.8 Biogen Inc.

Biogen Inc. - Overview
Biogen Inc. - Product / Service
Biogen Inc. - Key news
Biogen Inc. - Key offerings
SWOT

15.9 BioMarin Pharmaceutical Inc.

BioMarin Pharmaceutical Inc. - Overview
BioMarin Pharmaceutical Inc. - Business segments
BioMarin Pharmaceutical Inc. - Key offerings
BioMarin Pharmaceutical Inc. - Segment focus
SWOT

15.10 BioNTech SE

BioNTech SE - Overview
BioNTech SE - Product / Service
BioNTech SE - Key offerings
SWOT

15.11 Exelixis Inc.

Exelixis Inc. - Overview
Exelixis Inc. - Product / Service
Exelixis Inc. - Key offerings
SWOT

15.12 Gilead Sciences Inc.

Gilead Sciences Inc. - Overview
Gilead Sciences Inc. - Business segments
Gilead Sciences Inc. - Key news
Gilead Sciences Inc. - Key offerings
Gilead Sciences Inc. - Segment focus
SWOT

15.13 Incyte Corp.

Incyte Corp. - Overview
Incyte Corp. - Product / Service
Incyte Corp. - Key news
Incyte Corp. - Key offerings
SWOT

15.14 Legend Biotech Corp.

Legend Biotech Corp. - Overview
Legend Biotech Corp. - Product / Service
Legend Biotech Corp. - Key offerings
SWOT

15.15 Moderna Inc.

Moderna Inc. - Overview
Moderna Inc. - Product / Service
Moderna Inc. - Key offerings
SWOT

15.16 Neurocrine Biosciences Inc.

Neurocrine Biosciences Inc. - Overview
Neurocrine Biosciences Inc. - Product / Service
Neurocrine Biosciences Inc. - Key offerings
SWOT

15.17 Regeneron Pharmaceuticals Inc.

Regeneron Pharmaceuticals Inc. - Overview
Regeneron Pharmaceuticals Inc. - Product / Service
Regeneron Pharmaceuticals Inc. - Key news
Regeneron Pharmaceuticals Inc. - Key offerings
SWOT

15.18 Vertex Pharmaceuticals Inc.

Vertex Pharmaceuticals Inc. - Overview
Vertex Pharmaceuticals Inc. - Product / Service
Vertex Pharmaceuticals Inc. - Key offerings
SWOT

16. Appendix

16.1 Scope of the report

Market definition
Objectives
Notes and caveats

16.2 Inclusions and exclusions checklist

Inclusions checklist
Exclusions checklist

16.3 Currency conversion rates for US$

16.4 Research methodology

16.5 Data procurement

Information sources

16.6 Data validation

16.7 Validation techniques employed for market sizing

16.8 Data synthesis

16.9 360 degree market analysis

16.10 List of abbreviations

Research Methodology

Technavio presents a detailed picture of the market by way of study, synthesis, and summation of data from multiple sources. The analysts have presented the various facets of the market with a particular focus on identifying the key industry influencers. The data thus presented is comprehensive, reliable, and the result of extensive research, both primary and secondary.

INFORMATION SOURCES

Primary sources

  • Manufacturers and suppliers
  • Channel partners
  • Industry experts
  • Strategic decision makers

Secondary sources

  • Industry journals and periodicals
  • Government data
  • Financial reports of key industry players
  • Historical data
  • Press releases

DATA ANALYSIS

Data Synthesis

  • Collation of data
  • Estimation of key figures
  • Analysis of derived insights

Data Validation

  • Triangulation with data models
  • Reference against proprietary databases
  • Corroboration with industry experts

REPORT WRITING

Qualitative

  • Market drivers
  • Market challenges
  • Market trends
  • Five forces analysis

Quantitative

  • Market size and forecast
  • Market segmentation
  • Geographical insights
  • Competitive landscape

Interested in this report?

Get your sample now to see our research methodology and insights!

Download Now

Frequently Asked Questions

Biotech market growth will increase by USD 967.1 billion during 2026-2030.

The Biotech market is expected to grow at a CAGR of 13.2% during 2026-2030.

Biotech market is segmented by Product (Biologics, Therapeutics, Diagnostics, Industrial biotechnology, Others) Type (Red biotechnology, White biotechnology, Green biotechnology, Grey biotechnology, Others) Application (Healthcare, Bioinformatics, Agriculture, Industrial processing, Others)

Alnylam Pharmaceuticals Inc., Amgen Inc., argenx SE, Be One Medicines AG, Beam Therapeutics Inc., Biogen Inc., BioMarin Pharmaceutical Inc., BioNTech SE, CRISPR Therapeutics AG, Editas Medicine Inc., Exelixis Inc., Gilead Sciences Inc., Incyte Corp., Intellia Therapeutics Inc., Ionis Pharmaceuticals Inc., Kymera Therapeutics Inc., Legend Biotech Corp., Moderna Inc., Neurocrine Biosciences Inc., Recursion Pharmaceuticals Inc., Regeneron Pharmaceuticals Inc., Vertex Pharmaceuticals Inc., Vervetx Inc. are a few of the key vendors in the Biotech market.

North America will register the highest growth rate of 46.9% among the other regions. Therefore, the Biotech market in North America is expected to garner significant business opportunities for the vendors during the forecast period.

US, Canada, Mexico, Germany, UK, France, Italy, Spain, The Netherlands, China, India, Japan, South Korea, Thailand, Indonesia, Brazil, Saudi Arabia, UAE, Argentina, South Africa, Turkey, Colombia, Israel

  • Rise of artificial intelligence in discovery is the driving factor this market.

The Biotech market vendors should focus on grabbing business opportunities from the Product segment as it accounted for the largest market share in the base year.
RIA - Research AI Assistant
Ask RIA
