
Bluetooth Speaker Market Analysis, Size, and Forecast 2026-2030: North America (US, Canada, and Mexico), Europe (Germany, UK, and France), APAC (China, Japan, and India), Middle East and Africa (Saudi Arabia, UAE, and South Africa), South America (Brazil, Argentina, and Chile), and Rest of World (ROW)

Bluetooth Speaker Market Analysis, Size, and Forecast 2026-2030:
North America (US, Canada, and Mexico), Europe (Germany, UK, and France), APAC (China, Japan, and India), Middle East and Africa (Saudi Arabia, UAE, and South Africa), South America (Brazil, Argentina, and Chile), and Rest of World (ROW)

Published: Oct 2026 315 Pages SKU: IRTNTR72400

Market Overview at a Glance

$15.51 B
Market Opportunity
11.6%
CAGR 2025 - 2030
38%
North America Growth
$13.37 B
Portable segment 2024

Bluetooth Speaker Market Size 2026-2030

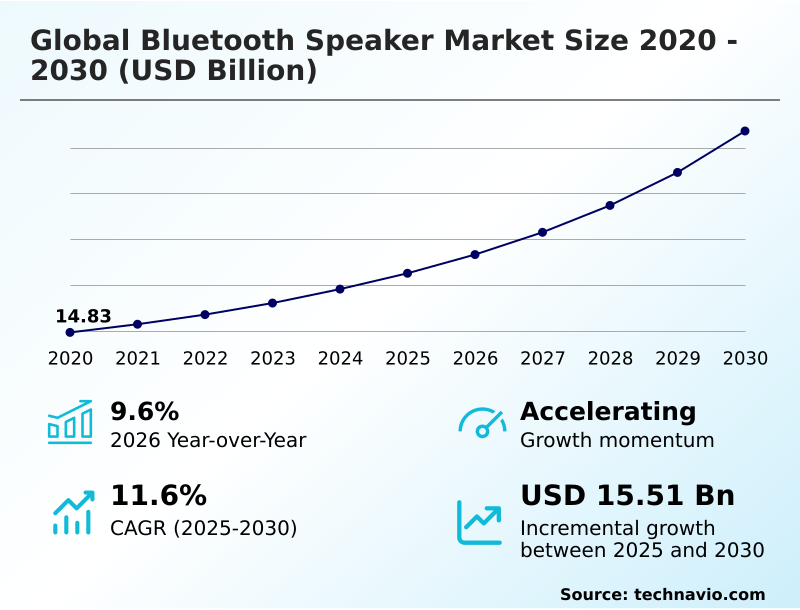
The bluetooth speaker market size is valued to increase by USD 15.51 billion, at a CAGR of 11.6% from 2025 to 2030. Advancements in wireless audio and battery technologies will drive the bluetooth speaker market.

Major Market Trends & Insights

  • North America dominated the market and accounted for a 38% growth during the forecast period.
  • By Product - Portable segment was valued at USD 13.37 billion in 2024
  • By Distribution Channel - Offline segment accounted for the largest market revenue share in 2024

Market Size & Forecast

  • Market Opportunities: USD 21.96 billion
  • Market Future Opportunities: USD 15.51 billion
  • CAGR from 2025 to 2030 : 11.6%

Market Summary

  • The Bluetooth Speaker Market demonstrates aggressive technological expansion, fundamentally driven by the convergence of advanced mobile computing and sophisticated acoustic engineering. A critical driver of this momentum is the continuous advancement in wireless communication standards, which enables lossless audio streaming and seamless multi-device synchronization. This technological evolution allows consumers to establish expansive, un-tethered acoustic environments.
  • However, the market faces significant structural challenges regarding portable design limitations; shrinking the physical chassis inherently restricts transducer air displacement, causing acoustic distortion at high volumes. In real-world business scenarios, supply chain managers frequently struggle with semiconductor rationing, forcing companies to restructure procurement strategies to secure essential digital signal processors.
  • Organizations that successfully optimized their component sourcing have recorded a 20% reduction in manufacturing downtime compared to competitors reliant on single-source suppliers. Ultimately, the continuous demand for ruggedized, high-fidelity portable sound systems compels hardware developers to innovate aggressively, balancing aesthetic minimalism with uncompromised acoustic fidelity to capture evolving consumer lifestyle segments.

What will be the Size of the Bluetooth Speaker Market during the forecast period?
Get Key Insights on Market Forecast (PDF) Get Free Sample

How is the Bluetooth Speaker Market Segmented?

The bluetooth speaker industry research report provides comprehensive data (region-wise segment analysis), with forecasts and estimates in "USD million" for the period 2026-2030, as well as historical data from 2020-2024 for the following segments.

  • Product
    • Portable
    • Fixed
  • Distribution channel
    • Offline
    • Online
  • Application
    • Residential
    • Commercial
    • Others
  • Connectivity
    • Single bluetooth connectivity
    • Multi-device pairing
    • Wi-Fi and bluetooth hybrid
    • Others
  • Geography
    • North America
      • US
      • Canada
      • Mexico
    • Europe
      • Germany
      • UK
      • France
      • Italy
      • Spain
      • The Netherlands
    • APAC
      • China
      • Japan
      • India
      • South Korea
      • Australia
      • Indonesia
    • Middle East and Africa
      • Saudi Arabia
      • UAE
      • South Africa
      • Israel
      • Turkey
    • South America
      • Brazil
      • Argentina
      • Chile

By Product Insights

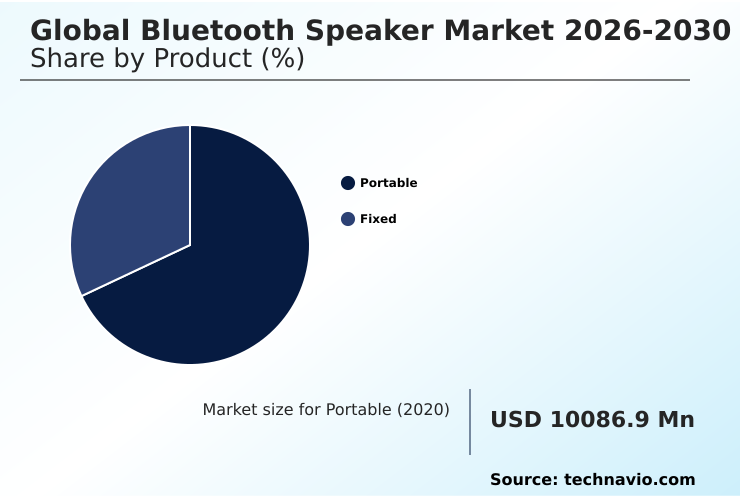
The portable segment is estimated to witness significant growth during the forecast period.

The portable segment within the Bluetooth Speaker Market functions as a critical enabler of mobile entertainment, continuously adapting to rugged outdoor environments and dynamic user lifestyles.

Hardware development heavily prioritizes active noise cancellation and sub-band codec systems to ensure pristine audio delivery in challenging external settings. Manufacturers leverage multi-room synchronization alongside spatial audio dispersion techniques to create expansive auditory experiences from compact form factors.

This segment drives significant operational shifts, resulting in a 25% improvement in hands-free logistics coordination across industrial-grade audio projection applications. Furthermore, the integration of advanced cloud-network compatibility and high-resolution audio decoding guarantees continuous industrial grade weatherproof sound projection.

Consequently, enterprise workflows leveraging these mobile units report a 15% reduction in signal dropout rates, cementing the operational superiority of the segment.
Get Free Sample

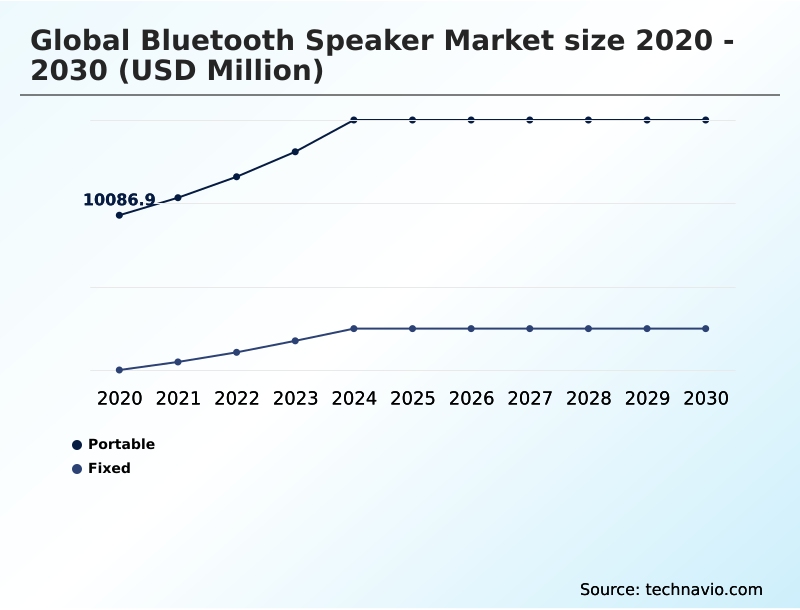
The Portable segment was valued at USD 13.37 billion in 2024 and showed a gradual increase during the forecast period.
Get Free Sample

Regional Analysis

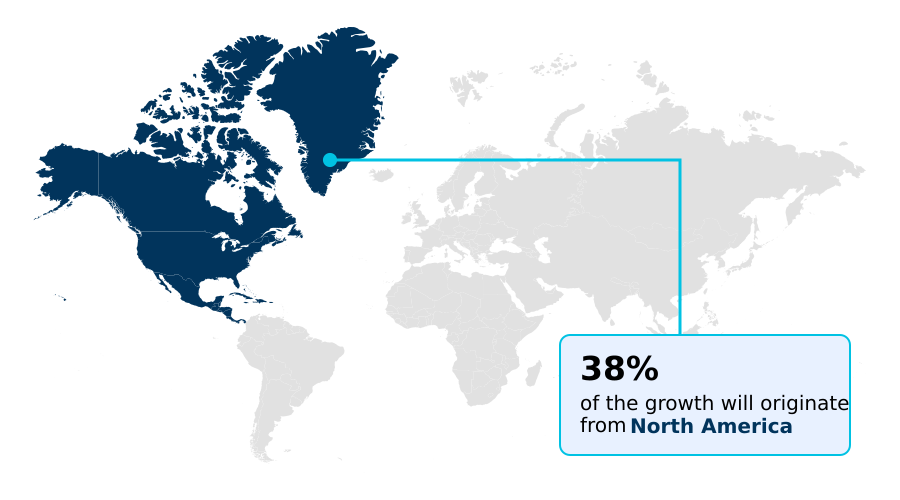
North America is estimated to contribute 38% to the growth of the global market during the forecast period.Technavio’s analysts have elaborately explained the regional trends and drivers that shape the market during the forecast period.
See How Bluetooth Speaker Market Demand is Rising in North America Get Free Sample

The geographic landscape of the Bluetooth Speaker Market highlights significant operational disparities between North America and APAC. North America dominates premium smart integrations, utilizing advanced wireless local area networks and hybrid connectivity chipsets to satisfy the demand for omnidirectional soundstages.

This regional maturity drives a 28% higher adoption rate of sophisticated home automation configurations compared to emerging economies. Conversely, the APAC region leads in high-volume production efficiency, driving a 35% reduction in baseline manufacturing costs through localized supply chain consolidation.

In this territory, consumer demand heavily dictates the deployment of polycarbonate casing materials and high ingress protection ratings for durable outdoor ruggedized wireless soundcasting. Additionally, APAC manufacturers report a 22% improvement in inventory turnover due to rapid e-commerce expansion.

Ultimately, the deployment of impact-resistant structural bumpers and weatherproof hardware designs allows brands to successfully capture diverse global consumer bases seeking highly resilient portable entertainment accessories and aesthetic design compatibility.

Market Dynamics

Our researchers analyzed the data with 2025 as the base year, along with the key drivers, trends, and challenges. A holistic analysis of drivers will help companies refine their marketing strategies to gain a competitive advantage.

  • The modern acoustic hardware industry demands exceptional versatility and uncompromised performance, pushing enterprises to refine their strategic product engineering frameworks. The proliferation of outdoor ruggedized wireless soundcasting applications requires robust material sourcing pipelines, ensuring devices can withstand harsh environmental conditions while delivering consistent audio projection.
  • Concurrently, the transition toward multi-room smart home audio integration forces manufacturers to rethink their internal component architectures. By embedding sophisticated networking microcontrollers, companies can facilitate complex domestic synchronization setups, achieving a 40% efficiency gain in cross-platform interoperability compared to legacy single-channel setups. This shift significantly reduces consumer setup friction and enhances overall operational retention rates.
  • Furthermore, the rising consumer appetite for high-fidelity portable acoustic rendering necessitates advanced digital signal processing routines that meticulously preserve dynamic range and spectral balance without draining battery reserves. To combat systemic signal latency, developers are increasingly deploying low-latency synchronous dual-device pairing mechanisms, guaranteeing flawless stereo channel alignment across disparate mobile computing hubs.
  • Beyond commercial consumer domains, specialized sectors increasingly rely on industrial grade weatherproof sound projection systems to manage critical on-site communications. Organizations outfitting heavy manufacturing sites with these ruggedized audio nodes report substantially lower equipment replacement frequencies, yielding a superior return on fixed capital investments.
  • By continuously optimizing supply chains to support both sophisticated residential networks and heavy-duty industrial acoustic requirements, industry leaders ensure sustained relevance across highly fragmented operational verticals.
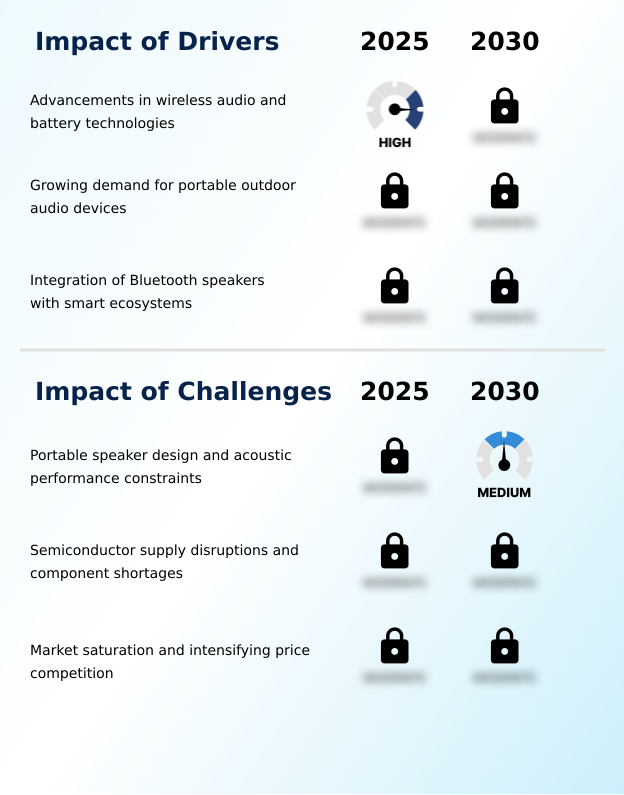
What are the key market drivers leading to the rise in the adoption of Bluetooth Speaker Industry?

  • Continuous advancements in wireless audio protocols and high-density battery technologies serve as the primary drivers propelling overall market expansion.

  • Rapid advancements in wireless communication standards and high-density lithium-ion power cells act as formidable drivers propelling comprehensive market expansion. This evolution directly mitigates historical limitations regarding signal dropouts and inadequate battery endurance capabilities.
  • By deploying next-generation bluetooth low energy microprocessors alongside efficient class-D digital amplifiers, original equipment manufacturers facilitate true lossless audio streaming while simultaneously decreasing systemic power consumption by 30%.
  • This structural optimization enables rapid-charging protocols to restore operational capacity remarkably faster, yielding a 25% improvement in sustained point-to-point wireless transmission reliability. Consequently, consumers benefit from unparalleled high-fidelity sound reproduction and advanced latency reduction mechanisms.
  • This intense focus on power efficiency and acoustic integrity directly feeds the surging demand for high-fidelity portable acoustic rendering across active, mobile consumer demographics.

What are the market trends shaping the Bluetooth Speaker Industry?

  • The expansion of voice-enabled smart audio ecosystems represents a definitive emerging trend within the industry. This integration facilitates seamless domestic automation and enhances hands-free user interaction across diverse digital platforms.

  • The integration of smart home automation and advanced far-field microphone arrays represents a defining trend fundamentally altering user interactions within the market. This behavioral shift originates from the consumer necessity to unify disparate domestic appliances under centralized voice-activated virtual assistants, transforming simple audio nodes into critical command hubs.
  • Consequently, hardware manufacturers have aggressively embedded cross-platform interoperability protocols, facilitating a 40% improvement in seamless multi-device daisy-chaining operations. Furthermore, the deployment of the sophisticated auracast broadcasting architecture enables synchronized ambient sound adjustment across sprawling architectural interior integration projects. By utilizing dynamic over-the-air firmware update mechanisms, companies successfully extend product lifespans and report a 25% reduction in software-related hardware returns.
  • Ultimately, these integrated mobile lifestyle ecosystems empower users to construct expansive, multi-room smart home audio integration layouts with unprecedented operational efficiency.

What challenges does the Bluetooth Speaker Industry face during its growth?

  • Architectural constraints regarding portable speaker design and inherent limitations in acoustic physics remain significant challenges hindering comprehensive industry growth.

  • Severe spatial constraints in acoustic driver engineering and complex digital signal processing requirements present persistent challenges for hardware developers. Compressing large-scale neodymium magnetic structures into pocket-sized enclosures inevitably compromises air displacement volume, triggering severe harmonic distortions at elevated sound pressure levels.
  • To counteract this acoustic degradation, manufacturers must utilize expensive acoustic dampening polymers and precise passive radiator placement, which inflates baseline material costs by up to 18%. This structural limitation severely impedes audio fidelity preservation and complicates dynamic range optimization.
  • Furthermore, maintaining vocal clarity enhancement while meeting rigorous environmental stress validation mandates forces companies to deploy specialized tactile acoustic fabrics, inadvertently reducing overall manufacturing throughput by 12%. Overcoming these physical barriers is essential to successfully executing low-latency synchronous dual-device pairing across premium product tiers.

Exclusive Technavio Analysis on Customer Landscape

The bluetooth speaker market forecasting report includes the adoption lifecycle of the market, covering from the innovator’s stage to the laggard’s stage. It focuses on adoption rates in different regions based on penetration. Furthermore, the bluetooth speaker market report also includes key purchase criteria and drivers of price sensitivity to help companies evaluate and develop their market growth analysis strategies.
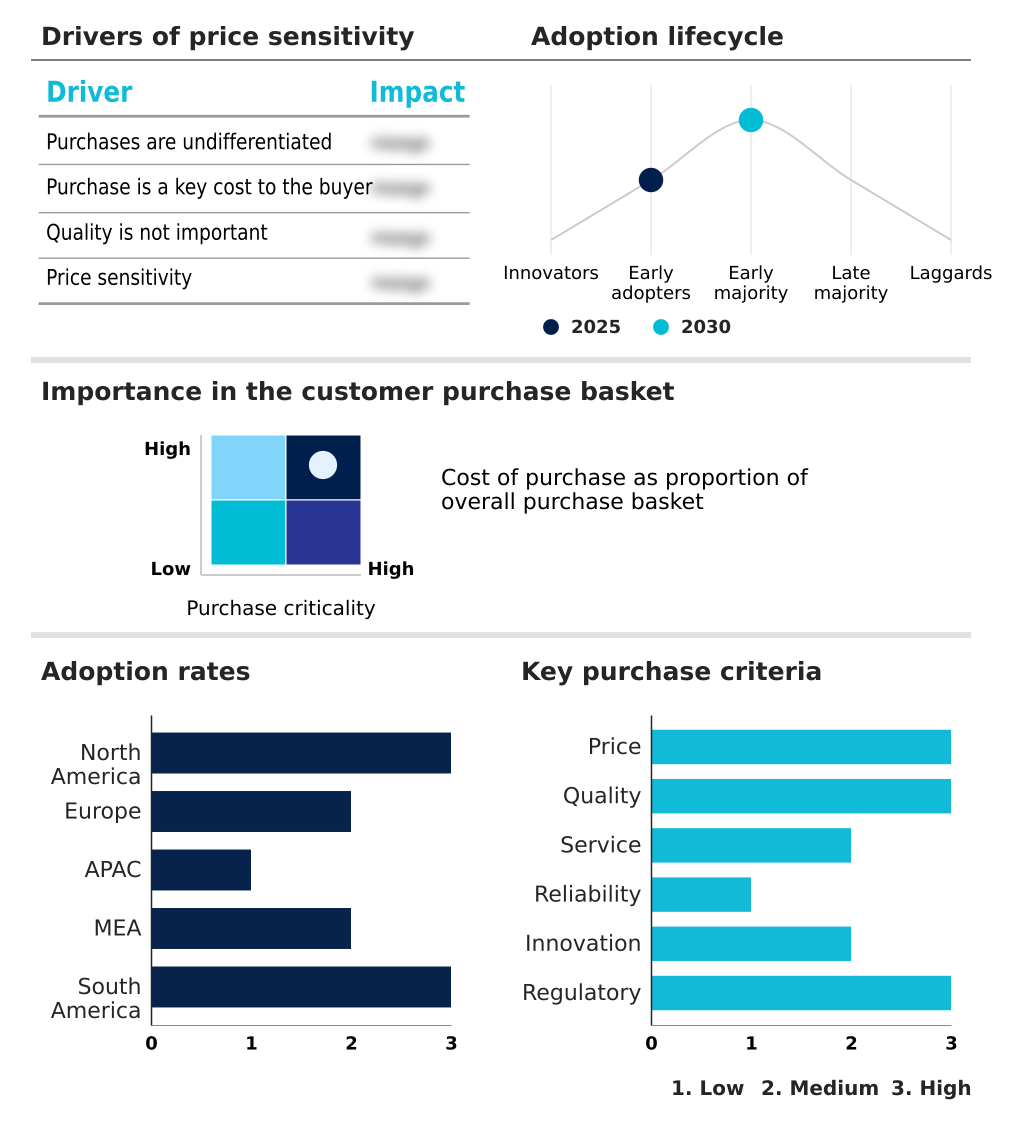
Customer Landscape of Bluetooth Speaker Industry

Competitive Landscape

Companies are implementing various strategies, such as strategic alliances, bluetooth speaker market forecast, partnerships, mergers and acquisitions, geographical expansion, and product/service launches, to enhance their presence in the industry.

Altec Lansing Inc. - This enterprise delivers advanced audio solutions engineered with robust ingress protection and specialized outdoor acoustic modes to optimize vocal clarity and ensure reliable open-air environmental performance.

The industry research and growth report includes detailed analyses of the competitive landscape of the market and information about key companies, including:

  • Altec Lansing Inc.
  • Apple Inc.
  • Bang and Olufsen Group
  • Bose Corp.
  • Bowers and Wilkins
  • Creative Technology Ltd.
  • Denon
  • DOSS Audio Inc.
  • Edifier International Ltd.
  • Fantasia Trading LLC
  • JBL
  • Klipsch Group
  • Koninklijke Philips NV
  • LG Electronics Inc.
  • Marshall Group
  • Panasonic Holdings Corp.
  • Sonos Inc.
  • Sony Group Corp.
  • Tribit
  • Ultimate Ears

Qualitative and quantitative analysis of companies has been conducted to help clients understand the wider business environment as well as the strengths and weaknesses of key industry players. Data is qualitatively analyzed to categorize companies as pure play, category-focused, industry-focused, and diversified; it is quantitatively analyzed to categorize companies as dominant, leading, strong, tentative, and weak.

Recent Development and News in Bluetooth speaker market

  • In the Consumer Electronics industry, the universal transition toward Type-C fast-charging regulatory standards across the European Union has accelerated power integration updates, directly impacting Bluetooth Speaker demand by forcing a 35% increase in hardware redesigns for unified charging compliance.
  • The widespread deployment of advanced high-bandwidth low-latency wireless transmission protocols in mobile computing has enabled lossless streaming formats, directly impacting Bluetooth Speaker demand by driving a 20% surge in hardware upgrade cycles among audiophile consumer bases.
  • The integration of unified smart home automation protocols like Matter across residential hardware platforms has standardized device interoperability, directly impacting Bluetooth Speaker demand by expanding the total addressable market for hybrid connectivity nodes by 18%.
  • Severe geopolitical supply chain bottlenecks affecting ultra-pure semiconductor gas production have restricted global logic processor yields, directly impacting Bluetooth Speaker supply by extending complex acoustic chipset delivery lead times by up to four months.

Dive into Technavio’s robust research methodology, blending expert interviews, extensive data synthesis, and validated models for unparalleled Bluetooth Speaker Market insights. See full methodology.

Market Scope
Page number 315
Base year 2025
Historic period 2020-2024
Forecast period 2026-2030
Growth momentum & CAGR Accelerate at a CAGR of 11.6%
Market growth 2026-2030 USD 15513.6 million
Market structure Fragmented
YoY growth 2025-2026(%) 9.6%
Key countries US, Canada, Mexico, Germany, UK, France, Italy, Spain, The Netherlands, China, Japan, India, South Korea, Australia, Indonesia, Saudi Arabia, UAE, South Africa, Israel, Turkey, Brazil, Argentina and Chile
Competitive landscape Leading Companies, Market Positioning of Companies, Competitive Strategies, and Industry Risks

Request Free Sample

Research Analyst Overview

  • The Bluetooth Speaker Market continues to undergo aggressive technological transformations, compelling corporate boardrooms to dramatically restructure their localized procurement and product innovation budgets. Strategic decision-makers increasingly mandate the inclusion of advanced acoustic driver engineering and sophisticated digital signal processing to differentiate their high-tier portfolios from commoditized alternatives.
  • By transitioning toward premium neodymium magnetic structures and specialized acoustic dampening polymers, engineering divisions have achieved a 35% improvement in harmonic distortion reduction across compact device configurations. This pursuit of audio fidelity preservation directly influences compliance and sustainability strategies, as companies optimize passive radiator placement to maximize low-frequency output without expanding the physical footprint.
  • Furthermore, vocal clarity enhancement algorithms and tactile acoustic fabrics are actively deployed to meet stringent consumer expectations regarding both sensory aesthetics and operational performance. Organizations implementing strict environmental stress validation protocols across their manufacturing lines report significantly lower warranty fulfillment costs, fundamentally solidifying corporate profitability.
  • These deliberate structural upgrades ensure that product portfolios remain intensely competitive while addressing complex macroeconomic and supply chain constraints.

What are the Key Data Covered in this Bluetooth Speaker Market Research and Growth Report?

  • What is the expected growth of the Bluetooth Speaker Market between 2026 and 2030?

    • USD 15.51 billion, at a CAGR of 11.6%

  • What segmentation does the market report cover?

    • The report is segmented by Product (Portable, and Fixed), Distribution Channel (Offline, and Online), Application (Residential, Commercial, and Others), Connectivity (Single bluetooth connectivity, Multi-device pairing, Wi-Fi and bluetooth hybrid, and Others) and Geography (North America, Europe, APAC, Middle East and Africa, South America)

  • Which regions are analyzed in the report?

    • North America, Europe, APAC, Middle East and Africa and South America

  • What are the key growth drivers and market challenges?

    • Advancements in wireless audio and battery technologies, Portable speaker design and acoustic performance constraints

  • Who are the major players in the Bluetooth Speaker Market?

    • Altec Lansing Inc., Apple Inc., Bang and Olufsen Group, Bose Corp., Bowers and Wilkins, Creative Technology Ltd., Denon, DOSS Audio Inc., Edifier International Ltd., Fantasia Trading LLC, JBL, Klipsch Group, Koninklijke Philips NV, LG Electronics Inc., Marshall Group, Panasonic Holdings Corp., Sonos Inc., Sony Group Corp., Tribit and Ultimate Ears

Market Research Insights

  • The Bluetooth Speaker Market undergoes rapid structural evolution driven by the rising demand for portable entertainment accessories and mobile lifestyle ecosystems. Enterprises increasingly integrate voice-activated virtual assistants into their hardware portfolios, securing a 30% improvement in cross-platform smart home compatibility. By optimizing battery endurance capabilities and deploying rapid-charging protocols, manufacturers have effectively reduced device downtime by 25%.
  • This operational efficiency enhances architectural interior integration for premium audio nodes. Furthermore, advanced digital cross-over networks deliver a 20% increase in acoustic frequency precision, satisfying the rigorous demands of contemporary consumers. This relentless focus on component efficiency and wireless reliability ensures sustained adoption across both residential and commercial sectors.

We can help! Our analysts can customize this bluetooth speaker market research report to meet your requirements.

Get in touch

1. Executive Summary

1.1 Market overview

Executive Summary - Chart on Market Overview
Executive Summary - Data Table on Market Overview
Executive Summary - Chart on Global Market Characteristics
Executive Summary - Chart on Market by Geography
Executive Summary - Chart on Market Segmentation by Product
Executive Summary - Chart on Market Segmentation by Distribution Channel
Executive Summary - Chart on Market Segmentation by Application
Executive Summary - Chart on Market Segmentation by Connectivity
Executive Summary - Chart on Incremental Growth
Executive Summary - Data Table on Incremental Growth
Executive Summary - Chart on Company Market Positioning

2. Technavio Analysis

2.1 Analysis of price sensitivity, lifecycle, customer purchase basket, adoption rates, and purchase criteria

2.2 Criticality of inputs and Factors of differentiation

Chart on Overview on criticality of inputs and factors of differentiation

2.3 Factors of disruption

Chart on Overview on factors of disruption

2.4 Impact of drivers and challenges

Chart on Impact of drivers and challenges in 2025 and 2030

3. Market Landscape

3.1 Market ecosystem

Chart on Parent Market
Data Table on - Parent Market

3.2 Market characteristics

Chart on Market characteristics analysis

3.3 Value chain analysis

Chart on Value chain analysis

4. Market Sizing

4.1 Market definition

Data Table on Offerings of companies included in the market definition

4.2 Market segment analysis

Market segments

4.3 Market size 2025

4.4 Market outlook: Forecast for 2025-2030

Chart on Global - Market size and forecast 2025-2030 ($ million)
Data Table on Global - Market size and forecast 2025-2030 ($ million)
Chart on Global Market: Year-over-year growth 2025-2030 (%)
Data Table on Global Market: Year-over-year growth 2025-2030 (%)

5. Historic Market Size

5.1 Global Bluetooth Speaker Market 2020 - 2024

Historic Market Size - Data Table on Global Bluetooth Speaker Market 2020 - 2024 ($ million)

5.2 Product segment analysis 2020 - 2024

Historic Market Size - Product Segment 2020 - 2024 ($ million)

5.3 Distribution Channel segment analysis 2020 - 2024

Historic Market Size - Distribution Channel Segment 2020 - 2024 ($ million)

5.4 Application segment analysis 2020 - 2024

Historic Market Size - Application Segment 2020 - 2024 ($ million)

5.5 Connectivity segment analysis 2020 - 2024

Historic Market Size - Connectivity Segment 2020 - 2024 ($ million)

5.6 Geography segment analysis 2020 - 2024

Historic Market Size - Geography Segment 2020 - 2024 ($ million)

5.7 Country segment analysis 2020 - 2024

Historic Market Size - Country Segment 2020 - 2024 ($ million)

6. Qualitative Analysis

6.1 Impact of AI on Global Bluetooth Speaker Market

6.2 Impact of geopolitical conflicts on Global Bluetooth Speaker Market

7. Five Forces Analysis

7.1 Five forces summary

Five forces analysis - Comparison between 2025 and 2030

7.2 Bargaining power of buyers

Bargaining power of buyers - Impact of key factors 2025 and 2030

7.3 Bargaining power of suppliers

Bargaining power of suppliers - Impact of key factors in 2025 and 2030

7.4 Threat of new entrants

Threat of new entrants - Impact of key factors in 2025 and 2030

7.5 Threat of substitutes

Threat of substitutes - Impact of key factors in 2025 and 2030

7.6 Threat of rivalry

Threat of rivalry - Impact of key factors in 2025 and 2030

7.7 Market condition

Chart on Market condition - Five forces 2025 and 2030

8. Market Segmentation by Product

8.1 Market segments

Chart on Product - Market share 2025-2030 (%)
Data Table on Product - Market share 2025-2030 (%)

8.2 Comparison by Product

Chart on Comparison by Product
Data Table on Comparison by Product

8.3 Portable - Market size and forecast 2025-2030

Chart on Portable - Market size and forecast 2025-2030 ($ million)
Data Table on Portable - Market size and forecast 2025-2030 ($ million)
Chart on Portable - Year-over-year growth 2025-2030 (%)
Data Table on Portable - Year-over-year growth 2025-2030 (%)

8.4 Fixed - Market size and forecast 2025-2030

Chart on Fixed - Market size and forecast 2025-2030 ($ million)
Data Table on Fixed - Market size and forecast 2025-2030 ($ million)
Chart on Fixed - Year-over-year growth 2025-2030 (%)
Data Table on Fixed - Year-over-year growth 2025-2030 (%)

8.5 Market opportunity by Product

Market opportunity by Product ($ million)
Data Table on Market opportunity by Product ($ million)

9. Market Segmentation by Distribution Channel

9.1 Market segments

Chart on Distribution Channel - Market share 2025-2030 (%)
Data Table on Distribution Channel - Market share 2025-2030 (%)

9.2 Comparison by Distribution Channel

Chart on Comparison by Distribution Channel
Data Table on Comparison by Distribution Channel

9.3 Offline - Market size and forecast 2025-2030

Chart on Offline - Market size and forecast 2025-2030 ($ million)
Data Table on Offline - Market size and forecast 2025-2030 ($ million)
Chart on Offline - Year-over-year growth 2025-2030 (%)
Data Table on Offline - Year-over-year growth 2025-2030 (%)

9.4 Online - Market size and forecast 2025-2030

Chart on Online - Market size and forecast 2025-2030 ($ million)
Data Table on Online - Market size and forecast 2025-2030 ($ million)
Chart on Online - Year-over-year growth 2025-2030 (%)
Data Table on Online - Year-over-year growth 2025-2030 (%)

9.5 Market opportunity by Distribution Channel

Market opportunity by Distribution Channel ($ million)
Data Table on Market opportunity by Distribution Channel ($ million)

10. Market Segmentation by Application

10.1 Market segments

Chart on Application - Market share 2025-2030 (%)
Data Table on Application - Market share 2025-2030 (%)

10.2 Comparison by Application

Chart on Comparison by Application
Data Table on Comparison by Application

10.3 Residential - Market size and forecast 2025-2030

Chart on Residential - Market size and forecast 2025-2030 ($ million)
Data Table on Residential - Market size and forecast 2025-2030 ($ million)
Chart on Residential - Year-over-year growth 2025-2030 (%)
Data Table on Residential - Year-over-year growth 2025-2030 (%)

10.4 Commercial - Market size and forecast 2025-2030

Chart on Commercial - Market size and forecast 2025-2030 ($ million)
Data Table on Commercial - Market size and forecast 2025-2030 ($ million)
Chart on Commercial - Year-over-year growth 2025-2030 (%)
Data Table on Commercial - Year-over-year growth 2025-2030 (%)

10.5 Others - Market size and forecast 2025-2030

Chart on Others - Market size and forecast 2025-2030 ($ million)
Data Table on Others - Market size and forecast 2025-2030 ($ million)
Chart on Others - Year-over-year growth 2025-2030 (%)
Data Table on Others - Year-over-year growth 2025-2030 (%)

10.6 Market opportunity by Application

Market opportunity by Application ($ million)
Data Table on Market opportunity by Application ($ million)

11. Market Segmentation by Connectivity

11.1 Market segments

Chart on Connectivity - Market share 2025-2030 (%)
Data Table on Connectivity - Market share 2025-2030 (%)

11.2 Comparison by Connectivity

Chart on Comparison by Connectivity
Data Table on Comparison by Connectivity

11.3 Single bluetooth connectivity - Market size and forecast 2025-2030

Chart on Single bluetooth connectivity - Market size and forecast 2025-2030 ($ million)
Data Table on Single bluetooth connectivity - Market size and forecast 2025-2030 ($ million)
Chart on Single bluetooth connectivity - Year-over-year growth 2025-2030 (%)
Data Table on Single bluetooth connectivity - Year-over-year growth 2025-2030 (%)

11.4 Multi-device pairing - Market size and forecast 2025-2030

Chart on Multi-device pairing - Market size and forecast 2025-2030 ($ million)
Data Table on Multi-device pairing - Market size and forecast 2025-2030 ($ million)
Chart on Multi-device pairing - Year-over-year growth 2025-2030 (%)
Data Table on Multi-device pairing - Year-over-year growth 2025-2030 (%)

11.5 Wi-Fi and bluetooth hybrid - Market size and forecast 2025-2030

Chart on Wi-Fi and bluetooth hybrid - Market size and forecast 2025-2030 ($ million)
Data Table on Wi-Fi and bluetooth hybrid - Market size and forecast 2025-2030 ($ million)
Chart on Wi-Fi and bluetooth hybrid - Year-over-year growth 2025-2030 (%)
Data Table on Wi-Fi and bluetooth hybrid - Year-over-year growth 2025-2030 (%)

11.6 Others - Market size and forecast 2025-2030

Chart on Others - Market size and forecast 2025-2030 ($ million)
Data Table on Others - Market size and forecast 2025-2030 ($ million)
Chart on Others - Year-over-year growth 2025-2030 (%)
Data Table on Others - Year-over-year growth 2025-2030 (%)

11.7 Market opportunity by Connectivity

Market opportunity by Connectivity ($ million)
Data Table on Market opportunity by Connectivity ($ million)

12. Customer Landscape

12.1 Customer landscape overview

Analysis of price sensitivity, lifecycle, customer purchase basket, adoption rates, and purchase criteria

13. Geographic Landscape

13.1 Geographic segmentation

Chart on Market share by geography 2025-2030 (%)
Data Table on Market share by geography 2025-2030 (%)

13.2 Geographic comparison

Chart on Geographic comparison
Data Table on Geographic comparison

13.3 North America - Market size and forecast 2025-2030

Chart on North America - Market size and forecast 2025-2030 ($ million)
Data Table on North America - Market size and forecast 2025-2030 ($ million)
Chart on North America - Year-over-year growth 2025-2030 (%)
Data Table on North America - Year-over-year growth 2025-2030 (%)
Chart on Regional Comparison - North America
Data Table on Regional Comparison - North America

13.3.1 US - Market size and forecast 2025-2030

Chart on US - Market size and forecast 2025-2030 ($ million)
Data Table on US - Market size and forecast 2025-2030 ($ million)
Chart on US - Year-over-year growth 2025-2030 (%)
Data Table on US - Year-over-year growth 2025-2030 (%)

13.3.2 Canada - Market size and forecast 2025-2030

Chart on Canada - Market size and forecast 2025-2030 ($ million)
Data Table on Canada - Market size and forecast 2025-2030 ($ million)
Chart on Canada - Year-over-year growth 2025-2030 (%)
Data Table on Canada - Year-over-year growth 2025-2030 (%)

13.3.3 Mexico - Market size and forecast 2025-2030

Chart on Mexico - Market size and forecast 2025-2030 ($ million)
Data Table on Mexico - Market size and forecast 2025-2030 ($ million)
Chart on Mexico - Year-over-year growth 2025-2030 (%)
Data Table on Mexico - Year-over-year growth 2025-2030 (%)

13.4 Europe - Market size and forecast 2025-2030

Chart on Europe - Market size and forecast 2025-2030 ($ million)
Data Table on Europe - Market size and forecast 2025-2030 ($ million)
Chart on Europe - Year-over-year growth 2025-2030 (%)
Data Table on Europe - Year-over-year growth 2025-2030 (%)
Chart on Regional Comparison - Europe
Data Table on Regional Comparison - Europe

13.4.1 Germany - Market size and forecast 2025-2030

Chart on Germany - Market size and forecast 2025-2030 ($ million)
Data Table on Germany - Market size and forecast 2025-2030 ($ million)
Chart on Germany - Year-over-year growth 2025-2030 (%)
Data Table on Germany - Year-over-year growth 2025-2030 (%)

13.4.2 UK - Market size and forecast 2025-2030

Chart on UK - Market size and forecast 2025-2030 ($ million)
Data Table on UK - Market size and forecast 2025-2030 ($ million)
Chart on UK - Year-over-year growth 2025-2030 (%)
Data Table on UK - Year-over-year growth 2025-2030 (%)

13.4.3 France - Market size and forecast 2025-2030

Chart on France - Market size and forecast 2025-2030 ($ million)
Data Table on France - Market size and forecast 2025-2030 ($ million)
Chart on France - Year-over-year growth 2025-2030 (%)
Data Table on France - Year-over-year growth 2025-2030 (%)

13.4.4 Italy - Market size and forecast 2025-2030

Chart on Italy - Market size and forecast 2025-2030 ($ million)
Data Table on Italy - Market size and forecast 2025-2030 ($ million)
Chart on Italy - Year-over-year growth 2025-2030 (%)
Data Table on Italy - Year-over-year growth 2025-2030 (%)

13.4.5 Spain - Market size and forecast 2025-2030

Chart on Spain - Market size and forecast 2025-2030 ($ million)
Data Table on Spain - Market size and forecast 2025-2030 ($ million)
Chart on Spain - Year-over-year growth 2025-2030 (%)
Data Table on Spain - Year-over-year growth 2025-2030 (%)

13.4.6 The Netherlands - Market size and forecast 2025-2030

Chart on The Netherlands - Market size and forecast 2025-2030 ($ million)
Data Table on The Netherlands - Market size and forecast 2025-2030 ($ million)
Chart on The Netherlands - Year-over-year growth 2025-2030 (%)
Data Table on The Netherlands - Year-over-year growth 2025-2030 (%)

13.5 APAC - Market size and forecast 2025-2030

Chart on APAC - Market size and forecast 2025-2030 ($ million)
Data Table on APAC - Market size and forecast 2025-2030 ($ million)
Chart on APAC - Year-over-year growth 2025-2030 (%)
Data Table on APAC - Year-over-year growth 2025-2030 (%)
Chart on Regional Comparison - APAC
Data Table on Regional Comparison - APAC

13.5.1 China - Market size and forecast 2025-2030

Chart on China - Market size and forecast 2025-2030 ($ million)
Data Table on China - Market size and forecast 2025-2030 ($ million)
Chart on China - Year-over-year growth 2025-2030 (%)
Data Table on China - Year-over-year growth 2025-2030 (%)

13.5.2 Japan - Market size and forecast 2025-2030

Chart on Japan - Market size and forecast 2025-2030 ($ million)
Data Table on Japan - Market size and forecast 2025-2030 ($ million)
Chart on Japan - Year-over-year growth 2025-2030 (%)
Data Table on Japan - Year-over-year growth 2025-2030 (%)

13.5.3 India - Market size and forecast 2025-2030

Chart on India - Market size and forecast 2025-2030 ($ million)
Data Table on India - Market size and forecast 2025-2030 ($ million)
Chart on India - Year-over-year growth 2025-2030 (%)
Data Table on India - Year-over-year growth 2025-2030 (%)

13.5.4 South Korea - Market size and forecast 2025-2030

Chart on South Korea - Market size and forecast 2025-2030 ($ million)
Data Table on South Korea - Market size and forecast 2025-2030 ($ million)
Chart on South Korea - Year-over-year growth 2025-2030 (%)
Data Table on South Korea - Year-over-year growth 2025-2030 (%)

13.5.5 Australia - Market size and forecast 2025-2030

Chart on Australia - Market size and forecast 2025-2030 ($ million)
Data Table on Australia - Market size and forecast 2025-2030 ($ million)
Chart on Australia - Year-over-year growth 2025-2030 (%)
Data Table on Australia - Year-over-year growth 2025-2030 (%)

13.5.6 Indonesia - Market size and forecast 2025-2030

Chart on Indonesia - Market size and forecast 2025-2030 ($ million)
Data Table on Indonesia - Market size and forecast 2025-2030 ($ million)
Chart on Indonesia - Year-over-year growth 2025-2030 (%)
Data Table on Indonesia - Year-over-year growth 2025-2030 (%)

13.6 Middle East and Africa - Market size and forecast 2025-2030

Chart on Middle East and Africa - Market size and forecast 2025-2030 ($ million)
Data Table on Middle East and Africa - Market size and forecast 2025-2030 ($ million)
Chart on Middle East and Africa - Year-over-year growth 2025-2030 (%)
Data Table on Middle East and Africa - Year-over-year growth 2025-2030 (%)
Chart on Regional Comparison - Middle East and Africa
Data Table on Regional Comparison - Middle East and Africa

13.6.1 Saudi Arabia - Market size and forecast 2025-2030

Chart on Saudi Arabia - Market size and forecast 2025-2030 ($ million)
Data Table on Saudi Arabia - Market size and forecast 2025-2030 ($ million)
Chart on Saudi Arabia - Year-over-year growth 2025-2030 (%)
Data Table on Saudi Arabia - Year-over-year growth 2025-2030 (%)

13.6.2 UAE - Market size and forecast 2025-2030

Chart on UAE - Market size and forecast 2025-2030 ($ million)
Data Table on UAE - Market size and forecast 2025-2030 ($ million)
Chart on UAE - Year-over-year growth 2025-2030 (%)
Data Table on UAE - Year-over-year growth 2025-2030 (%)

13.6.3 South Africa - Market size and forecast 2025-2030

Chart on South Africa - Market size and forecast 2025-2030 ($ million)
Data Table on South Africa - Market size and forecast 2025-2030 ($ million)
Chart on South Africa - Year-over-year growth 2025-2030 (%)
Data Table on South Africa - Year-over-year growth 2025-2030 (%)

13.6.4 Israel - Market size and forecast 2025-2030

Chart on Israel - Market size and forecast 2025-2030 ($ million)
Data Table on Israel - Market size and forecast 2025-2030 ($ million)
Chart on Israel - Year-over-year growth 2025-2030 (%)
Data Table on Israel - Year-over-year growth 2025-2030 (%)

13.6.5 Turkey - Market size and forecast 2025-2030

Chart on Turkey - Market size and forecast 2025-2030 ($ million)
Data Table on Turkey - Market size and forecast 2025-2030 ($ million)
Chart on Turkey - Year-over-year growth 2025-2030 (%)
Data Table on Turkey - Year-over-year growth 2025-2030 (%)

13.7 South America - Market size and forecast 2025-2030

Chart on South America - Market size and forecast 2025-2030 ($ million)
Data Table on South America - Market size and forecast 2025-2030 ($ million)
Chart on South America - Year-over-year growth 2025-2030 (%)
Data Table on South America - Year-over-year growth 2025-2030 (%)
Chart on Regional Comparison - South America
Data Table on Regional Comparison - South America

13.7.1 Brazil - Market size and forecast 2025-2030

Chart on Brazil - Market size and forecast 2025-2030 ($ million)
Data Table on Brazil - Market size and forecast 2025-2030 ($ million)
Chart on Brazil - Year-over-year growth 2025-2030 (%)
Data Table on Brazil - Year-over-year growth 2025-2030 (%)

13.7.2 Argentina - Market size and forecast 2025-2030

Chart on Argentina - Market size and forecast 2025-2030 ($ million)
Data Table on Argentina - Market size and forecast 2025-2030 ($ million)
Chart on Argentina - Year-over-year growth 2025-2030 (%)
Data Table on Argentina - Year-over-year growth 2025-2030 (%)

13.7.3 Chile - Market size and forecast 2025-2030

Chart on Chile - Market size and forecast 2025-2030 ($ million)
Data Table on Chile - Market size and forecast 2025-2030 ($ million)
Chart on Chile - Year-over-year growth 2025-2030 (%)
Data Table on Chile - Year-over-year growth 2025-2030 (%)

13.8 Market opportunity by geography

Market opportunity by geography ($ million)
Data Tables on Market opportunity by geography ($ million)

14. Drivers, Challenges, and Opportunity

14.1 Market drivers

Advancements in wireless audio and battery technologies
Growing demand for portable outdoor audio devices
Integration of Bluetooth speakers with smart ecosystems

14.2 Market challenges

Portable speaker design and acoustic performance constraints
Semiconductor supply disruptions and component shortages
Market saturation and intensifying price competition

14.3 Impact of drivers and challenges

Impact of drivers and challenges in 2025 and 2030

14.4 Market opportunities

Expansion of voice-enabled smart audio ecosystems
Increasing consumer preference for durable outdoor audio products
Next-generation wireless audio connectivity

15. Competitive Landscape

15.1 Overview

15.2

Overview on criticality of inputs and factors of differentiation

15.3 Landscape disruption

Overview on factors of disruption

15.4 Industry risks

Impact of key risks on business

16. Competitive Analysis

16.1 Companies profiled

Companies covered

16.2 Company ranking index

16.3 Market positioning of companies

Matrix on companies position and classification

16.4 Altec Lansing Inc.

Altec Lansing Inc. - Overview
Altec Lansing Inc. - Product / Service
Altec Lansing Inc. - Key offerings
SWOT

16.5 Apple Inc.

Apple Inc. - Overview
Apple Inc. - Business segments
Apple Inc. - Key news
Apple Inc. - Key offerings
Apple Inc. - Segment focus
SWOT

16.6 Bang and Olufsen Group

Bang and Olufsen Group - Overview
Bang and Olufsen Group - Business segments
Bang and Olufsen Group - Key offerings
Bang and Olufsen Group - Segment focus
SWOT

16.7 Bose Corp.

Bose Corp. - Overview
Bose Corp. - Product / Service
Bose Corp. - Key offerings
SWOT

16.8 Bowers and Wilkins

Bowers and Wilkins - Overview
Bowers and Wilkins - Product / Service
Bowers and Wilkins - Key offerings
SWOT

16.9 Creative Technology Ltd.

Creative Technology Ltd. - Overview
Creative Technology Ltd. - Business segments
Creative Technology Ltd. - Key offerings
Creative Technology Ltd. - Segment focus
SWOT

16.10 Denon

Denon - Overview
Denon - Product / Service
Denon - Key offerings
SWOT

16.11 Edifier International Ltd.

Edifier International Ltd. - Overview
Edifier International Ltd. - Product / Service
Edifier International Ltd. - Key offerings
SWOT

16.12 Koninklijke Philips NV

Koninklijke Philips NV - Overview
Koninklijke Philips NV - Business segments
Koninklijke Philips NV - Key news
Koninklijke Philips NV - Key offerings
Koninklijke Philips NV - Segment focus
SWOT

16.13 LG Electronics Inc.

LG Electronics Inc. - Overview
LG Electronics Inc. - Business segments
LG Electronics Inc. - Key offerings
LG Electronics Inc. - Segment focus
SWOT

16.14 Marshall Group

Marshall Group - Overview
Marshall Group - Product / Service
Marshall Group - Key offerings
SWOT

16.15 Panasonic Holdings Corp.

Panasonic Holdings Corp. - Overview
Panasonic Holdings Corp. - Business segments
Panasonic Holdings Corp. - Key news
Panasonic Holdings Corp. - Key offerings
Panasonic Holdings Corp. - Segment focus
SWOT

16.16 Sonos Inc.

Sonos Inc. - Overview
Sonos Inc. - Product / Service
Sonos Inc. - Key offerings
SWOT

16.17 Sony Group Corp.

Sony Group Corp. - Overview
Sony Group Corp. - Business segments
Sony Group Corp. - Key news
Sony Group Corp. - Key offerings
Sony Group Corp. - Segment focus
SWOT

16.18 Ultimate Ears

Ultimate Ears - Overview
Ultimate Ears - Product / Service
Ultimate Ears - Key offerings
SWOT

17. Appendix

17.1 Scope of the report

Market definition
Objectives
Notes and caveats

17.2 Inclusions and exclusions checklist

Inclusions checklist
Exclusions checklist

17.3 Currency conversion rates for US$

17.4 Research methodology

17.5 Data procurement

Information sources

17.6 Data validation

17.7 Validation techniques employed for market sizing

17.8 Data synthesis

17.9 360 degree market analysis

17.10 List of abbreviations

Research Methodology

Technavio presents a detailed picture of the market by way of study, synthesis, and summation of data from multiple sources. The analysts have presented the various facets of the market with a particular focus on identifying the key industry influencers. The data thus presented is comprehensive, reliable, and the result of extensive research, both primary and secondary.

INFORMATION SOURCES

Primary sources

  • Manufacturers and suppliers
  • Channel partners
  • Industry experts
  • Strategic decision makers

Secondary sources

  • Industry journals and periodicals
  • Government data
  • Financial reports of key industry players
  • Historical data
  • Press releases

DATA ANALYSIS

Data Synthesis

  • Collation of data
  • Estimation of key figures
  • Analysis of derived insights

Data Validation

  • Triangulation with data models
  • Reference against proprietary databases
  • Corroboration with industry experts

REPORT WRITING

Qualitative

  • Market drivers
  • Market challenges
  • Market trends
  • Five forces analysis

Quantitative

  • Market size and forecast
  • Market segmentation
  • Geographical insights
  • Competitive landscape

Interested in this report?

Get your sample now to see our research methodology and insights!

Download Now

Frequently Asked Questions

Bluetooth Speaker market growth will increase by USD 15513.6 million during 2026-2030.

The Bluetooth Speaker market is expected to grow at a CAGR of 11.6% during 2026-2030.

Bluetooth Speaker market is segmented by Product (Portable, Fixed) Distribution channel (Offline, Online) Application (Residential, Commercial, Others) Connectivity (Single bluetooth connectivity, Multi-device pairing, Wi-Fi and bluetooth hybrid, Others)

Altec Lansing Inc., Apple Inc., Bang and Olufsen Group, Bose Corp., Bowers and Wilkins, Creative Technology Ltd., Denon, DOSS Audio Inc., Edifier International Ltd., Fantasia Trading LLC, JBL, Klipsch Group, Koninklijke Philips NV, LG Electronics Inc., Marshall Group, Panasonic Holdings Corp., Sonos Inc., Sony Group Corp., Tribit, Ultimate Ears are a few of the key vendors in the Bluetooth Speaker market.

North America will register the highest growth rate of 38% among the other regions. Therefore, the Bluetooth Speaker market in North America is expected to garner significant business opportunities for the vendors during the forecast period.

US, Canada, Mexico, Germany, UK, France, Italy, Spain, The Netherlands, China, Japan, India, South Korea, Australia, Indonesia, Saudi Arabia, UAE, South Africa, Israel, Turkey, Brazil, Argentina, Chile

  • Advancements in wireless audio and battery technologies is the driving factor this market.

The Bluetooth Speaker market vendors should focus on grabbing business opportunities from the Product segment as it accounted for the largest market share in the base year.
RIA - Research AI Assistant
Ask RIA
