
Car Sharing Market Analysis, Size, and Forecast 2026-2030: North America (US, Canada, and Mexico), Europe (Germany, UK, and France), APAC (China, Japan, and India), Middle East and Africa (Saudi Arabia, UAE, and South Africa), South America (Brazil, Argentina, and Colombia), and Rest of World (ROW)

Car Sharing Market Analysis, Size, and Forecast 2026-2030:
North America (US, Canada, and Mexico), Europe (Germany, UK, and France), APAC (China, Japan, and India), Middle East and Africa (Saudi Arabia, UAE, and South Africa), South America (Brazil, Argentina, and Colombia), and Rest of World (ROW)

Published: Oct 2026 285 Pages SKU: IRTNTR43387

Market Overview at a Glance

$13.45 B
Market Opportunity
13.2%
CAGR 2025 - 2030
32.9%
North America Growth
$7.58 B
Business segment 2024

Car Sharing Market Size 2026-2030

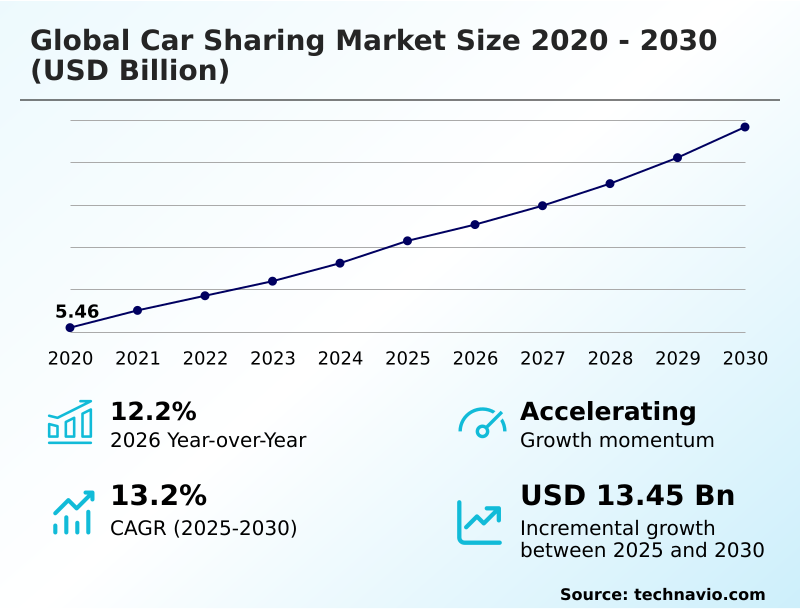
The car sharing market size is valued to increase by USD 13.45 billion, at a CAGR of 13.2% from 2025 to 2030. Escalating costs of private vehicle ownership and macroeconomic pressures will drive the car sharing market.

Major Market Trends & Insights

  • North America dominated the market and accounted for a 32.9% growth during the forecast period.
  • By End-user - Business segment was valued at USD 7.58 billion in 2024
  • By Mode of Booking - Online segment accounted for the largest market revenue share in 2024

Market Size & Forecast

  • Market Opportunities: USD 23.72 billion
  • Market Future Opportunities: USD 13.45 billion
  • CAGR from 2025 to 2030 : 13.2%

Market Summary

  • The car sharing market operates as a highly dynamic ecosystem where consumers increasingly favor flexible usage-based mobility access over traditional private vehicle ownership. Organizations and individual commuters leverage sophisticated digital platforms featuring dynamic pricing and instant keyless entry to seamlessly reserve vehicles for short-term utilization.
  • In a practical business scenario, a logistics enterprise successfully integrated shared urban fleets to bridge last-mile transit gaps, reducing baseline administrative overhead by 22% compared to maintaining a dedicated corporate motor pool.
  • The escalating financial burden of acquiring, insuring, and maintaining personal automobiles serves as a primary driver, pushing cost-conscious urban demographics toward shared networks that transform fixed capital drains into predictable variable costs. Conversely, the industry faces significant structural constraints due to high localized operational expenditures and the logistical complexities of sustaining decentralized fleet infrastructure across fragmented municipal zones.
  • As city authorities enforce stringent environmental regulations, operators are forced to rapidly adapt their fleets, navigating both expansive growth opportunities and persistent fleet optimization hurdles.

What will be the Size of the Car Sharing Market during the forecast period?
Get Key Insights on Market Forecast (PDF) Get Free Sample

How is the Car Sharing Market Segmented?

The car sharing industry research report provides comprehensive data (region-wise segment analysis), with forecasts and estimates in "USD million" for the period 2026-2030, as well as historical data from 2020-2024 for the following segments.

  • End-user
    • Business
    • Individual
  • Mode of booking
    • Online
    • Offline
  • Vehicle type
    • Economy
    • SUVs or MPVs
    • Luxury
  • Geography
    • North America
      • US
      • Canada
      • Mexico
    • Europe
      • Germany
      • UK
      • France
      • Italy
      • Spain
      • The Netherlands
    • APAC
      • China
      • Japan
      • India
      • South Korea
      • Australia
      • Singapore
    • Middle East and Africa
      • Saudi Arabia
      • UAE
      • South Africa
      • Israel
      • Turkey
    • South America
      • Brazil
      • Argentina
      • Colombia

By End-user Insights

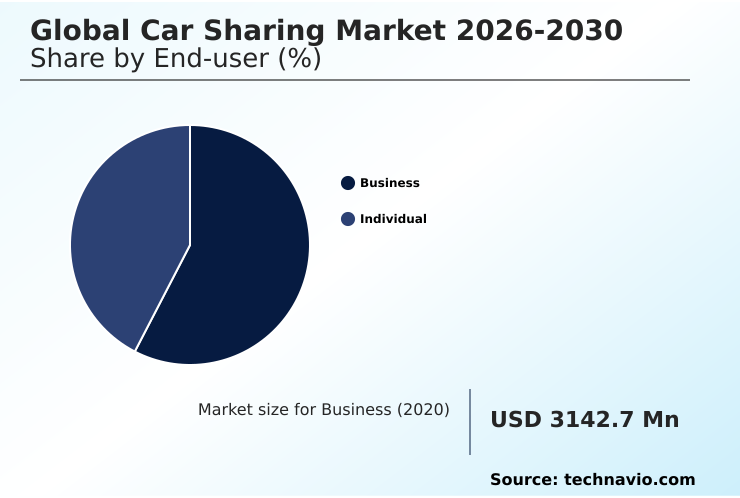
The business segment is estimated to witness significant growth during the forecast period.

Corporate entities increasingly utilize specialized mobility solutions to optimize travel expenses and fulfill strict environmental mandates. Traditionally reliant on dedicated motor pools, organizations are now transitioning toward agile transit architectures that eliminate idle time and fixed overheads.

By implementing advanced telematics and automated tracking, fleet managers can monitor usage data in real time, effectively improving asset utilization efficiency by over 30%.

This shift allows authorized personnel to seamlessly reserve and unlock a battery electric vehicle through secure digital applications, replacing outdated manual reimbursement workflows with automated billing.

The integration of predictive maintenance within these platforms minimizes unexpected mechanical downtime, ensuring continuous availability.

Furthermore, decentralized configurations like the free-floating model and peer-to-peer network provide exceptional flexibility, transforming workplace transit into a highly auditable, capital-efficient infrastructure that consistently supports corporate sustainability benchmarks.
Get Free Sample

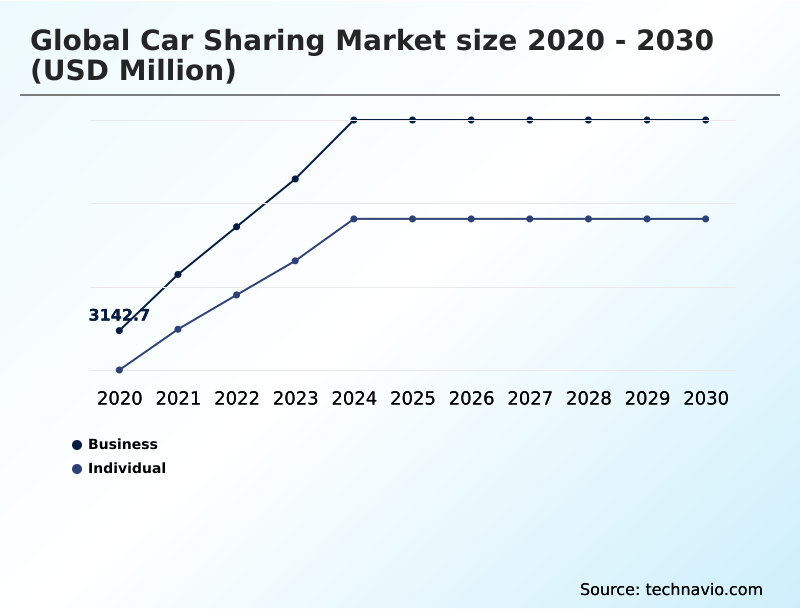
The Business segment was valued at USD 7.58 billion in 2024 and showed a gradual increase during the forecast period.
Get Free Sample

Regional Analysis

North America is estimated to contribute 32.9% to the growth of the global market during the forecast period.Technavio’s analysts have elaborately explained the regional trends and drivers that shape the market during the forecast period.
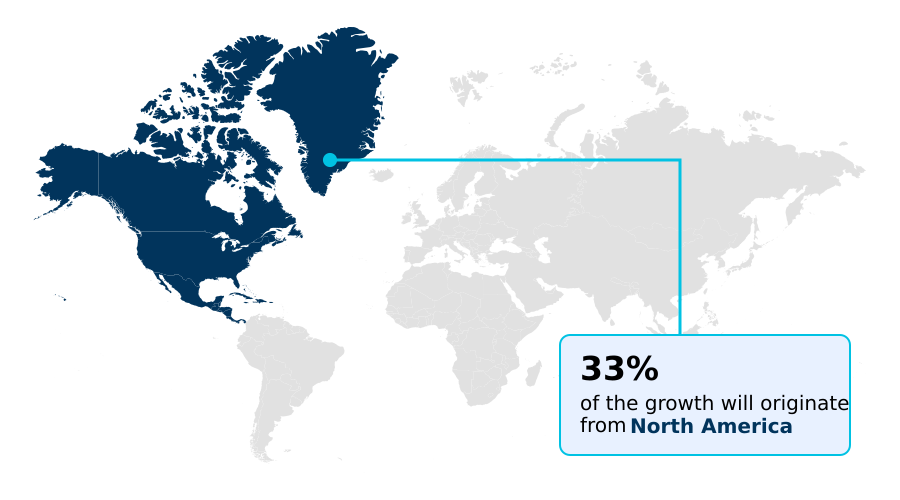
See How Car Sharing Market Demand is Rising in North America Get Free Sample

Regional dynamics within the car sharing landscape reflect divergent infrastructural priorities and regulatory environments.

Europe consistently accelerates ahead of North America in shared fleet density, achieving a 40% higher utilization rate per vehicle due to aggressive municipal traffic restrictions and expansive low-emission zones.

Driven by a stringent zero-emission target, European operators rapidly deploy battery electric vehicles within an integrated mobility-as-a-service ecosystem.

In contrast, North American platforms heavily leverage a specialized cloud-based platform to manage vast suburban distances, integrating robust digital identity verification to streamline user onboarding.

Consequently, North American corporate providers have successfully reduced localized fleet idle times by 18% through optimized routing algorithms.

While Europe thrives on high-density free-floating models, the APAC region increasingly relies on a structured station-based system, allowing regional operators to lower unexpected maintenance costs by 15% and align seamlessly with world-class public transit grids.

Market Dynamics

Our researchers analyzed the data with 2025 as the base year, along with the key drivers, trends, and challenges. A holistic analysis of drivers will help companies refine their marketing strategies to gain a competitive advantage.

  • The structural evolution of shared mobility heavily depends on the rapid deployment of sophisticated digital architectures that streamline the consumer journey and optimize back-end operations. Modern platform operators continuously upgrade their technical infrastructure, prioritizing seamless cloud native mobile application integration to ensure frictionless reservation processes and real-time vehicle telemetry tracking.
  • This technological baseline is critical for establishing a secure, highly responsive zero emission urban transport ecosystem that complies with stringent municipal environmental mandates. To mitigate the inherent risks of decentralized asset sharing, enterprises implement a robust automated user identity verification protocol, which dramatically minimizes fraudulent access and accelerates the customer onboarding sequence.
  • In the corporate sector, the transition from asset-heavy ownership models to flexible usage-based structures relies heavily on efficient station based corporate fleet management. By utilizing localized vehicle hubs, organizations have successfully reduced their overall administrative and maintenance overhead by nearly 33% compared to traditional dedicated leasing models.
  • Furthermore, optimizing vehicle placement across complex metropolitan zones requires the utilization of advanced predictive machine learning demand forecasting. This capability allows mobility providers to anticipate localized transit spikes, balance inventory distribution dynamically, and ensure that vehicles are positioned exactly where commuters need them.
  • As these interconnected technologies mature, the industry continues to deliver highly scalable, capital-efficient transportation solutions tailored for dense urban populations.
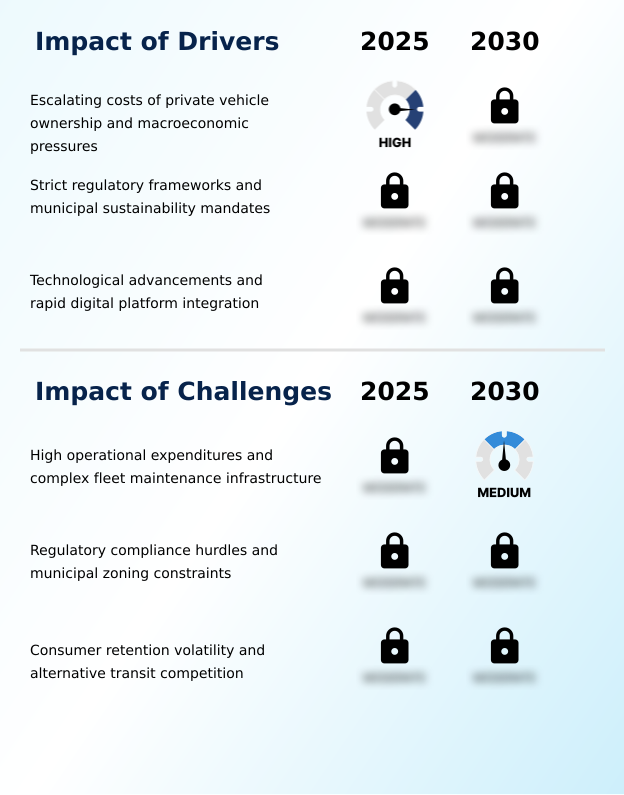
What are the key market drivers leading to the rise in the adoption of Car Sharing Industry?

  • The escalating costs associated with private vehicle ownership, coupled with mounting macroeconomic pressures, function as the primary catalysts driving market expansion.

  • Escalating capital constraints associated with private automobile maintenance heavily drive the rapid expansion of flexible usage-based mobility solutions.
  • Consumers and enterprises alike utilize these platforms to convert static asset liabilities into predictable, variable transit expenses, effectively reducing corporate travel overhead by up to 25%.
  • To facilitate seamless adoption, industry operators invest heavily in sophisticated digital trust architecture and automated fraud prevention protocol systems, which have accelerated secure user onboarding speeds by over 30%.
  • Furthermore, the implementation of cross-platform consolidation seamlessly embeds vehicular access directly into broader travel booking interfaces.
  • Coupled with integrated carbon offset tracking to satisfy stringent environmental mandates and minimize range anxiety, these innovations provide a compelling, frictionless alternative to traditional automotive ownership.

What are the market trends shaping the Car Sharing Industry?

  • The accelerating transition toward electric vehicle fleets and sustainable fleet governance represents a defining market trend. This strategic shift enables operators to significantly enhance operational compliance and environmental responsibility.

  • The rapid structural integration of platform ecosystems represents a profound trend reshaping modern urban transit functionality. Recognizing consumer preference for unified travel experiences, operators are actively prioritizing micromobility integration to establish a cohesive smart mobility hub that centralizes diverse transport modalities. This strategic consolidation has successfully reduced localized transit delays by approximately 18%.
  • Concurrently, the deployment of advanced battery swap technology and emerging vehicle-to-grid frameworks allows operators to bypass traditional charging bottlenecks, effectively boosting daily vehicle uptime by 22%. To safeguard these high-value decentralized assets, platforms frequently embed remote immobilization systems and automated parking protocols, streamlining the return process via a contactless smart card and minimizing liability risks.
  • This continuous wave of technological refinement empowers businesses to lower administrative barriers and capture broader commuter demographics within highly competitive metropolitan environments.

What challenges does the Car Sharing Industry face during its growth?

  • High operational expenditures and the logistical complexities of maintaining decentralized fleet infrastructure pose significant challenges to sustained industry growth.

  • Managing dispersed vehicular networks presents severe logistical hurdles that directly impede sustained profitability within the shared transit sector. The fundamental reliance on a decentralized asset framework drastically inflates routine maintenance and localized cleaning costs compared to traditional centralized rental operations.
  • Operators frequently struggle with restrictive municipal zoning policies and limited curb space allocation, which forces platforms to absorb exorbitant parking fees that can reduce operational profit margins by as much as 14%. Furthermore, while the implementation of a complex artificial intelligence algorithm is required to enable predictive dynamic routing, the high initial software integration costs strain capital reserves.
  • Consequently, companies operating this asset-heavy model face constant pressure to achieve hyper-efficient utilization thresholds, rendering geographic expansion into lower-density suburban zones highly precarious.

Exclusive Technavio Analysis on Customer Landscape

The car sharing market forecasting report includes the adoption lifecycle of the market, covering from the innovator’s stage to the laggard’s stage. It focuses on adoption rates in different regions based on penetration. Furthermore, the car sharing market report also includes key purchase criteria and drivers of price sensitivity to help companies evaluate and develop their market growth analysis strategies.
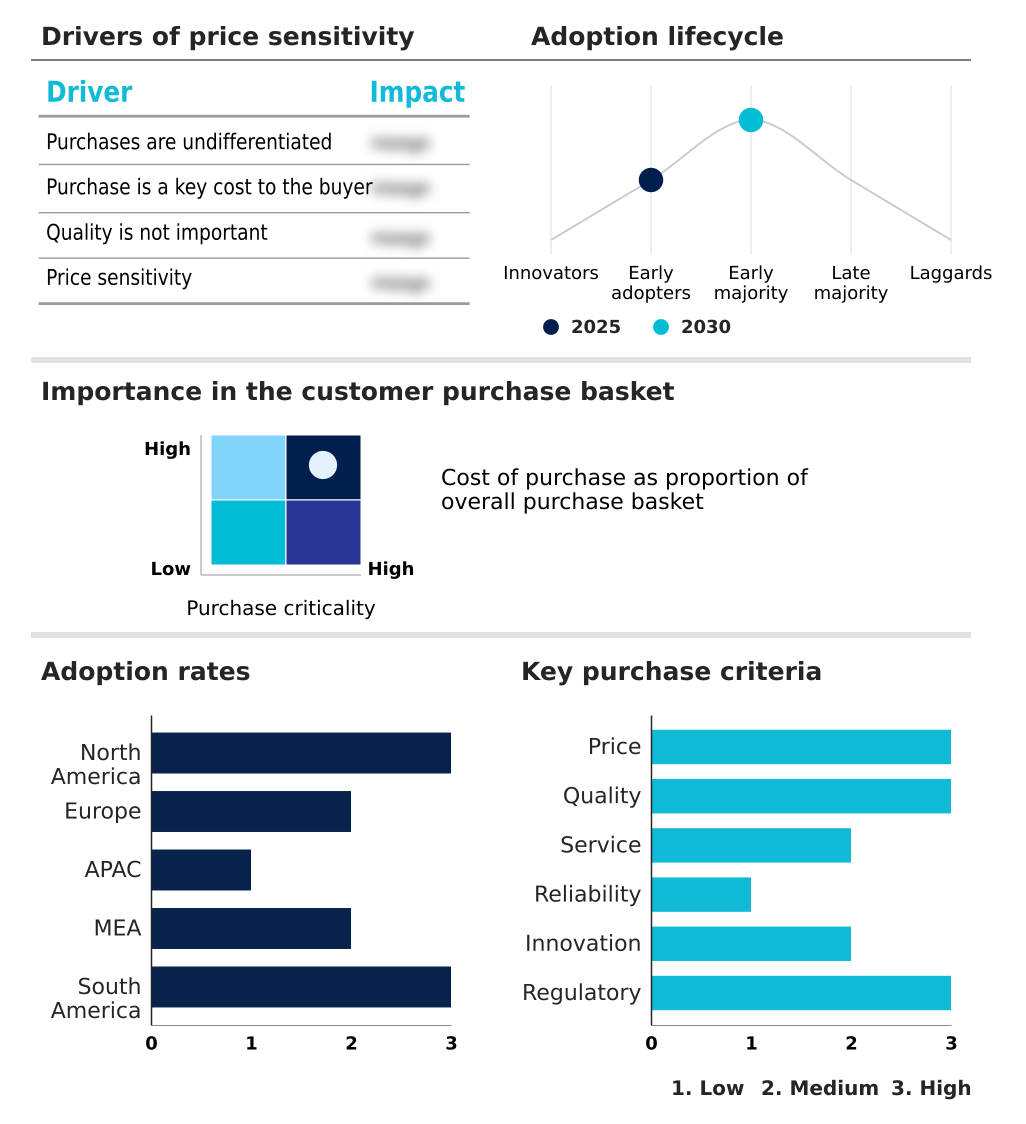
Customer Landscape of Car Sharing Industry

Competitive Landscape

Companies are implementing various strategies, such as strategic alliances, car sharing market forecast, partnerships, mergers and acquisitions, geographical expansion, and product/service launches, to enhance their presence in the industry.

cambio Mobilitatsservice GmbH - This vendor provides integrated mobility solutions featuring intuitive digital applications and specialized station-based transit networks designed to optimize urban transportation and reduce reliance on personal automobile ownership.

The industry research and growth report includes detailed analyses of the competitive landscape of the market and information about key companies, including:

  • cambio Mobilitatsservice GmbH
  • Communauto Group
  • Flinkster
  • Free2Move SAS
  • Getaround Inc.
  • GoGet
  • GreenMobility AS
  • Hertz Global Holdings Inc.
  • Hiyacar Ltd
  • Lyft Inc.
  • Mobilize Share
  • Modo Co operative
  • Myles Automotive Technologies
  • ORIX Auto Corp
  • Primemover Mobility Pvt. Ltd.
  • SOCAR Inc.
  • Times Car Share
  • Turo Inc.
  • Zipcar Inc.
  • Zoomcar India Pvt. Ltd.

Qualitative and quantitative analysis of companies has been conducted to help clients understand the wider business environment as well as the strengths and weaknesses of key industry players. Data is qualitatively analyzed to categorize companies as pure play, category-focused, industry-focused, and diversified; it is quantitatively analyzed to categorize companies as dominant, leading, strong, tentative, and weak.

Recent Development and News in Car sharing market

  • In the Passenger Ground Transportation industry, the aggressive implementation of low-emission zone policies has accelerated corporate fleet optimization, directly impacting car sharing demand by increasing utilization of electric assets by over 25%.
  • The rapid adoption of an urban transit ecosystem framework has facilitated first-mile synchronization, enhancing decentralized asset deployment across metropolitan areas and reducing transit delays by approximately 15%.
  • Advancements in mobile payment gateway systems have lowered the customer acquisition cost for operators, thereby expanding the potential user base by nearly 20% across major urban centers.
  • The introduction of cross-platform consolidation has reduced traffic congestion mitigation barriers, allowing platform operators to improve operational expenditure efficiency by an estimated 12%.

Dive into Technavio’s robust research methodology, blending expert interviews, extensive data synthesis, and validated models for unparalleled Car Sharing Market insights. See full methodology.

Market Scope
Page number 285
Base year 2025
Historic period 2020-2024
Forecast period 2026-2030
Growth momentum & CAGR Accelerate at a CAGR of 13.2%
Market growth 2026-2030 USD 13448.6 million
Market structure Fragmented
YoY growth 2025-2026(%) 12.2%
Key countries US, Canada, Mexico, Germany, UK, France, Italy, Spain, The Netherlands, China, Japan, India, South Korea, Australia, Singapore, Saudi Arabia, UAE, South Africa, Israel, Turkey, Brazil, Argentina and Colombia
Competitive landscape Leading Companies, Market Positioning of Companies, Competitive Strategies, and Industry Risks

Request Free Sample

Research Analyst Overview

  • The continuous evolution of shared mobility networks reflects a fundamental shift in how urban commuters and corporate enterprises approach transportation logistics. Industry participants aggressively modernize their operations by investing in advanced connected vehicle infrastructure to ensure high accessibility and uninterrupted service delivery.
  • Through the strategic implementation of real-time fleet tracking and dynamic geofencing, platform operators successfully monitor asset health and restrict vehicle operation within designated municipal boundaries. This technological sophistication directly supports a robust multi-modal integration strategy, allowing users to seamlessly transition between rail, bus, and shared automobile networks.
  • Consequently, operators utilizing a sophisticated load balancing algorithm have improved their overall utilization rate by an impressive 28%, significantly outperforming traditional centralized rental models. This enhanced fleet optimization directly influences boardroom-level strategic planning, enabling organizations to restructure their corporate mobility budgets and eliminate the depreciating liabilities associated with permanent vehicle ownership.
  • As macroeconomic pressures mount and traffic density intensifies, these agile, data-driven transit frameworks remain indispensable for achieving long-term environmental and operational sustainability goals.

What are the Key Data Covered in this Car Sharing Market Research and Growth Report?

  • What is the expected growth of the Car Sharing Market between 2026 and 2030?

    • USD 13.45 billion, at a CAGR of 13.2%

  • What segmentation does the market report cover?

    • The report is segmented by End-user (Business, and Individual), Mode of Booking (Online, and Offline), Vehicle Type (Economy, SUVs or MPVs, and Luxury) and Geography (North America, Europe, APAC, Middle East and Africa, South America)

  • Which regions are analyzed in the report?

    • North America, Europe, APAC, Middle East and Africa and South America

  • What are the key growth drivers and market challenges?

    • Escalating costs of private vehicle ownership and macroeconomic pressures, High operational expenditures and complex fleet maintenance infrastructure

  • Who are the major players in the Car Sharing Market?

    • cambio Mobilitatsservice GmbH, Communauto Group, Flinkster, Free2Move SAS, Getaround Inc., GoGet, GreenMobility AS, Hertz Global Holdings Inc., Hiyacar Ltd, Lyft Inc., Mobilize Share, Modo Co operative, Myles Automotive Technologies, ORIX Auto Corp, Primemover Mobility Pvt. Ltd., SOCAR Inc., Times Car Share, Turo Inc., Zipcar Inc. and Zoomcar India Pvt. Ltd.

Market Research Insights

  • The car sharing sector constitutes a highly transformative ecosystem focused on advancing usage-based mobility across densely populated metropolitan centers. By eliminating the necessity for private vehicle ownership, this framework acts as a pivotal mechanism for traffic congestion mitigation while significantly reducing localized parking constraints.
  • Operators have systematically lowered their customer acquisition cost by 15% through the deployment of streamlined digital applications that enable instant reservations. Additionally, integrating these decentralized assets with municipal rail networks for seamless first-mile synchronization has improved overall transit efficiency by 20%.
  • As enterprises increasingly leverage these platforms to minimize corporate fleet burdens, the reduction in baseline operational expenditure by up to 25% continues to drive sustained institutional adoption worldwide.

We can help! Our analysts can customize this car sharing market research report to meet your requirements.

Get in touch

1. Executive Summary

1.1 Market overview

Executive Summary - Chart on Market Overview
Executive Summary - Data Table on Market Overview
Executive Summary - Chart on Global Market Characteristics
Executive Summary - Chart on Market by Geography
Executive Summary - Chart on Market Segmentation by End-user
Executive Summary - Chart on Market Segmentation by Mode of Booking
Executive Summary - Chart on Market Segmentation by Vehicle Type
Executive Summary - Chart on Incremental Growth
Executive Summary - Data Table on Incremental Growth
Executive Summary - Chart on Company Market Positioning

2. Technavio Analysis

2.1 Analysis of price sensitivity, lifecycle, customer purchase basket, adoption rates, and purchase criteria

2.2 Criticality of inputs and Factors of differentiation

Chart on Overview on criticality of inputs and factors of differentiation

2.3 Factors of disruption

Chart on Overview on factors of disruption

2.4 Impact of drivers and challenges

Chart on Impact of drivers and challenges in 2025 and 2030

3. Market Landscape

3.1 Market ecosystem

Chart on Parent Market
Data Table on - Parent Market

3.2 Market characteristics

Chart on Market characteristics analysis

3.3 Value chain analysis

Chart on Value chain analysis

4. Market Sizing

4.1 Market definition

Data Table on Offerings of companies included in the market definition

4.2 Market segment analysis

Market segments

4.3 Market size 2025

4.4 Market outlook: Forecast for 2025-2030

Chart on Global - Market size and forecast 2025-2030 ($ million)
Data Table on Global - Market size and forecast 2025-2030 ($ million)
Chart on Global Market: Year-over-year growth 2025-2030 (%)
Data Table on Global Market: Year-over-year growth 2025-2030 (%)

5. Historic Market Size

5.1 Global Car Sharing Market 2020 - 2024

Historic Market Size - Data Table on Global Car Sharing Market 2020 - 2024 ($ million)

5.2 End-user segment analysis 2020 - 2024

Historic Market Size - End-user Segment 2020 - 2024 ($ million)

5.3 Mode of Booking segment analysis 2020 - 2024

Historic Market Size - Mode of Booking Segment 2020 - 2024 ($ million)

5.4 Vehicle Type segment analysis 2020 - 2024

Historic Market Size - Vehicle Type Segment 2020 - 2024 ($ million)

5.5 Geography segment analysis 2020 - 2024

Historic Market Size - Geography Segment 2020 - 2024 ($ million)

5.6 Country segment analysis 2020 - 2024

Historic Market Size - Country Segment 2020 - 2024 ($ million)

6. Qualitative Analysis

6.1 Impact of AI on global car sharing market

6.2 Impact of geopolitical conflicts on global car sharing market

7. Five Forces Analysis

7.1 Five forces summary

Five forces analysis - Comparison between 2025 and 2030

7.2 Bargaining power of buyers

Bargaining power of buyers - Impact of key factors 2025 and 2030

7.3 Bargaining power of suppliers

Bargaining power of suppliers - Impact of key factors in 2025 and 2030

7.4 Threat of new entrants

Threat of new entrants - Impact of key factors in 2025 and 2030

7.5 Threat of substitutes

Threat of substitutes - Impact of key factors in 2025 and 2030

7.6 Threat of rivalry

Threat of rivalry - Impact of key factors in 2025 and 2030

7.7 Market condition

Chart on Market condition - Five forces 2025 and 2030

8. Market Segmentation by End-user

8.1 Market segments

Chart on End-user - Market share 2025-2030 (%)
Data Table on End-user - Market share 2025-2030 (%)

8.2 Comparison by End-user

Chart on Comparison by End-user
Data Table on Comparison by End-user

8.3 Business - Market size and forecast 2025-2030

Chart on Business - Market size and forecast 2025-2030 ($ million)
Data Table on Business - Market size and forecast 2025-2030 ($ million)
Chart on Business - Year-over-year growth 2025-2030 (%)
Data Table on Business - Year-over-year growth 2025-2030 (%)

8.4 Individual - Market size and forecast 2025-2030

Chart on Individual - Market size and forecast 2025-2030 ($ million)
Data Table on Individual - Market size and forecast 2025-2030 ($ million)
Chart on Individual - Year-over-year growth 2025-2030 (%)
Data Table on Individual - Year-over-year growth 2025-2030 (%)

8.5 Market opportunity by End-user

Market opportunity by End-user ($ million)
Data Table on Market opportunity by End-user ($ million)

9. Market Segmentation by Mode of Booking

9.1 Market segments

Chart on Mode of Booking - Market share 2025-2030 (%)
Data Table on Mode of Booking - Market share 2025-2030 (%)

9.2 Comparison by Mode of Booking

Chart on Comparison by Mode of Booking
Data Table on Comparison by Mode of Booking

9.3 Online - Market size and forecast 2025-2030

Chart on Online - Market size and forecast 2025-2030 ($ million)
Data Table on Online - Market size and forecast 2025-2030 ($ million)
Chart on Online - Year-over-year growth 2025-2030 (%)
Data Table on Online - Year-over-year growth 2025-2030 (%)

9.4 Offline - Market size and forecast 2025-2030

Chart on Offline - Market size and forecast 2025-2030 ($ million)
Data Table on Offline - Market size and forecast 2025-2030 ($ million)
Chart on Offline - Year-over-year growth 2025-2030 (%)
Data Table on Offline - Year-over-year growth 2025-2030 (%)

9.5 Market opportunity by Mode of Booking

Market opportunity by Mode of Booking ($ million)
Data Table on Market opportunity by Mode of Booking ($ million)

10. Market Segmentation by Vehicle Type

10.1 Market segments

Chart on Vehicle Type - Market share 2025-2030 (%)
Data Table on Vehicle Type - Market share 2025-2030 (%)

10.2 Comparison by Vehicle Type

Chart on Comparison by Vehicle Type
Data Table on Comparison by Vehicle Type

10.3 Economy - Market size and forecast 2025-2030

Chart on Economy - Market size and forecast 2025-2030 ($ million)
Data Table on Economy - Market size and forecast 2025-2030 ($ million)
Chart on Economy - Year-over-year growth 2025-2030 (%)
Data Table on Economy - Year-over-year growth 2025-2030 (%)

10.4 SUVs or MPVs - Market size and forecast 2025-2030

Chart on SUVs or MPVs - Market size and forecast 2025-2030 ($ million)
Data Table on SUVs or MPVs - Market size and forecast 2025-2030 ($ million)
Chart on SUVs or MPVs - Year-over-year growth 2025-2030 (%)
Data Table on SUVs or MPVs - Year-over-year growth 2025-2030 (%)

10.5 Luxury - Market size and forecast 2025-2030

Chart on Luxury - Market size and forecast 2025-2030 ($ million)
Data Table on Luxury - Market size and forecast 2025-2030 ($ million)
Chart on Luxury - Year-over-year growth 2025-2030 (%)
Data Table on Luxury - Year-over-year growth 2025-2030 (%)

10.6 Market opportunity by Vehicle Type

Market opportunity by Vehicle Type ($ million)
Data Table on Market opportunity by Vehicle Type ($ million)

11. Customer Landscape

11.1 Customer landscape overview

Analysis of price sensitivity, lifecycle, customer purchase basket, adoption rates, and purchase criteria

12. Geographic Landscape

12.1 Geographic segmentation

Chart on Market share by geography 2025-2030 (%)
Data Table on Market share by geography 2025-2030 (%)

12.2 Geographic comparison

Chart on Geographic comparison
Data Table on Geographic comparison

12.3 North America - Market size and forecast 2025-2030

Chart on North America - Market size and forecast 2025-2030 ($ million)
Data Table on North America - Market size and forecast 2025-2030 ($ million)
Chart on North America - Year-over-year growth 2025-2030 (%)
Data Table on North America - Year-over-year growth 2025-2030 (%)
Chart on Regional Comparison - North America
Data Table on Regional Comparison - North America

12.3.1 US - Market size and forecast 2025-2030

Chart on US - Market size and forecast 2025-2030 ($ million)
Data Table on US - Market size and forecast 2025-2030 ($ million)
Chart on US - Year-over-year growth 2025-2030 (%)
Data Table on US - Year-over-year growth 2025-2030 (%)

12.3.2 Canada - Market size and forecast 2025-2030

Chart on Canada - Market size and forecast 2025-2030 ($ million)
Data Table on Canada - Market size and forecast 2025-2030 ($ million)
Chart on Canada - Year-over-year growth 2025-2030 (%)
Data Table on Canada - Year-over-year growth 2025-2030 (%)

12.3.3 Mexico - Market size and forecast 2025-2030

Chart on Mexico - Market size and forecast 2025-2030 ($ million)
Data Table on Mexico - Market size and forecast 2025-2030 ($ million)
Chart on Mexico - Year-over-year growth 2025-2030 (%)
Data Table on Mexico - Year-over-year growth 2025-2030 (%)

12.4 Europe - Market size and forecast 2025-2030

Chart on Europe - Market size and forecast 2025-2030 ($ million)
Data Table on Europe - Market size and forecast 2025-2030 ($ million)
Chart on Europe - Year-over-year growth 2025-2030 (%)
Data Table on Europe - Year-over-year growth 2025-2030 (%)
Chart on Regional Comparison - Europe
Data Table on Regional Comparison - Europe

12.4.1 Germany - Market size and forecast 2025-2030

Chart on Germany - Market size and forecast 2025-2030 ($ million)
Data Table on Germany - Market size and forecast 2025-2030 ($ million)
Chart on Germany - Year-over-year growth 2025-2030 (%)
Data Table on Germany - Year-over-year growth 2025-2030 (%)

12.4.2 UK - Market size and forecast 2025-2030

Chart on UK - Market size and forecast 2025-2030 ($ million)
Data Table on UK - Market size and forecast 2025-2030 ($ million)
Chart on UK - Year-over-year growth 2025-2030 (%)
Data Table on UK - Year-over-year growth 2025-2030 (%)

12.4.3 France - Market size and forecast 2025-2030

Chart on France - Market size and forecast 2025-2030 ($ million)
Data Table on France - Market size and forecast 2025-2030 ($ million)
Chart on France - Year-over-year growth 2025-2030 (%)
Data Table on France - Year-over-year growth 2025-2030 (%)

12.4.4 Italy - Market size and forecast 2025-2030

Chart on Italy - Market size and forecast 2025-2030 ($ million)
Data Table on Italy - Market size and forecast 2025-2030 ($ million)
Chart on Italy - Year-over-year growth 2025-2030 (%)
Data Table on Italy - Year-over-year growth 2025-2030 (%)

12.4.5 Spain - Market size and forecast 2025-2030

Chart on Spain - Market size and forecast 2025-2030 ($ million)
Data Table on Spain - Market size and forecast 2025-2030 ($ million)
Chart on Spain - Year-over-year growth 2025-2030 (%)
Data Table on Spain - Year-over-year growth 2025-2030 (%)

12.4.6 The Netherlands - Market size and forecast 2025-2030

Chart on The Netherlands - Market size and forecast 2025-2030 ($ million)
Data Table on The Netherlands - Market size and forecast 2025-2030 ($ million)
Chart on The Netherlands - Year-over-year growth 2025-2030 (%)
Data Table on The Netherlands - Year-over-year growth 2025-2030 (%)

12.5 APAC - Market size and forecast 2025-2030

Chart on APAC - Market size and forecast 2025-2030 ($ million)
Data Table on APAC - Market size and forecast 2025-2030 ($ million)
Chart on APAC - Year-over-year growth 2025-2030 (%)
Data Table on APAC - Year-over-year growth 2025-2030 (%)
Chart on Regional Comparison - APAC
Data Table on Regional Comparison - APAC

12.5.1 China - Market size and forecast 2025-2030

Chart on China - Market size and forecast 2025-2030 ($ million)
Data Table on China - Market size and forecast 2025-2030 ($ million)
Chart on China - Year-over-year growth 2025-2030 (%)
Data Table on China - Year-over-year growth 2025-2030 (%)

12.5.2 Japan - Market size and forecast 2025-2030

Chart on Japan - Market size and forecast 2025-2030 ($ million)
Data Table on Japan - Market size and forecast 2025-2030 ($ million)
Chart on Japan - Year-over-year growth 2025-2030 (%)
Data Table on Japan - Year-over-year growth 2025-2030 (%)

12.5.3 India - Market size and forecast 2025-2030

Chart on India - Market size and forecast 2025-2030 ($ million)
Data Table on India - Market size and forecast 2025-2030 ($ million)
Chart on India - Year-over-year growth 2025-2030 (%)
Data Table on India - Year-over-year growth 2025-2030 (%)

12.5.4 South Korea - Market size and forecast 2025-2030

Chart on South Korea - Market size and forecast 2025-2030 ($ million)
Data Table on South Korea - Market size and forecast 2025-2030 ($ million)
Chart on South Korea - Year-over-year growth 2025-2030 (%)
Data Table on South Korea - Year-over-year growth 2025-2030 (%)

12.5.5 Australia - Market size and forecast 2025-2030

Chart on Australia - Market size and forecast 2025-2030 ($ million)
Data Table on Australia - Market size and forecast 2025-2030 ($ million)
Chart on Australia - Year-over-year growth 2025-2030 (%)
Data Table on Australia - Year-over-year growth 2025-2030 (%)

12.5.6 Singapore - Market size and forecast 2025-2030

Chart on Singapore - Market size and forecast 2025-2030 ($ million)
Data Table on Singapore - Market size and forecast 2025-2030 ($ million)
Chart on Singapore - Year-over-year growth 2025-2030 (%)
Data Table on Singapore - Year-over-year growth 2025-2030 (%)

12.6 Middle East and Africa - Market size and forecast 2025-2030

Chart on Middle East and Africa - Market size and forecast 2025-2030 ($ million)
Data Table on Middle East and Africa - Market size and forecast 2025-2030 ($ million)
Chart on Middle East and Africa - Year-over-year growth 2025-2030 (%)
Data Table on Middle East and Africa - Year-over-year growth 2025-2030 (%)
Chart on Regional Comparison - Middle East and Africa
Data Table on Regional Comparison - Middle East and Africa

12.6.1 Saudi Arabia - Market size and forecast 2025-2030

Chart on Saudi Arabia - Market size and forecast 2025-2030 ($ million)
Data Table on Saudi Arabia - Market size and forecast 2025-2030 ($ million)
Chart on Saudi Arabia - Year-over-year growth 2025-2030 (%)
Data Table on Saudi Arabia - Year-over-year growth 2025-2030 (%)

12.6.2 UAE - Market size and forecast 2025-2030

Chart on UAE - Market size and forecast 2025-2030 ($ million)
Data Table on UAE - Market size and forecast 2025-2030 ($ million)
Chart on UAE - Year-over-year growth 2025-2030 (%)
Data Table on UAE - Year-over-year growth 2025-2030 (%)

12.6.3 South Africa - Market size and forecast 2025-2030

Chart on South Africa - Market size and forecast 2025-2030 ($ million)
Data Table on South Africa - Market size and forecast 2025-2030 ($ million)
Chart on South Africa - Year-over-year growth 2025-2030 (%)
Data Table on South Africa - Year-over-year growth 2025-2030 (%)

12.6.4 Israel - Market size and forecast 2025-2030

Chart on Israel - Market size and forecast 2025-2030 ($ million)
Data Table on Israel - Market size and forecast 2025-2030 ($ million)
Chart on Israel - Year-over-year growth 2025-2030 (%)
Data Table on Israel - Year-over-year growth 2025-2030 (%)

12.6.5 Turkey - Market size and forecast 2025-2030

Chart on Turkey - Market size and forecast 2025-2030 ($ million)
Data Table on Turkey - Market size and forecast 2025-2030 ($ million)
Chart on Turkey - Year-over-year growth 2025-2030 (%)
Data Table on Turkey - Year-over-year growth 2025-2030 (%)

12.7 South America - Market size and forecast 2025-2030

Chart on South America - Market size and forecast 2025-2030 ($ million)
Data Table on South America - Market size and forecast 2025-2030 ($ million)
Chart on South America - Year-over-year growth 2025-2030 (%)
Data Table on South America - Year-over-year growth 2025-2030 (%)
Chart on Regional Comparison - South America
Data Table on Regional Comparison - South America

12.7.1 Brazil - Market size and forecast 2025-2030

Chart on Brazil - Market size and forecast 2025-2030 ($ million)
Data Table on Brazil - Market size and forecast 2025-2030 ($ million)
Chart on Brazil - Year-over-year growth 2025-2030 (%)
Data Table on Brazil - Year-over-year growth 2025-2030 (%)

12.7.2 Argentina - Market size and forecast 2025-2030

Chart on Argentina - Market size and forecast 2025-2030 ($ million)
Data Table on Argentina - Market size and forecast 2025-2030 ($ million)
Chart on Argentina - Year-over-year growth 2025-2030 (%)
Data Table on Argentina - Year-over-year growth 2025-2030 (%)

12.7.3 Colombia - Market size and forecast 2025-2030

Chart on Colombia - Market size and forecast 2025-2030 ($ million)
Data Table on Colombia - Market size and forecast 2025-2030 ($ million)
Chart on Colombia - Year-over-year growth 2025-2030 (%)
Data Table on Colombia - Year-over-year growth 2025-2030 (%)

12.8 Market opportunity by geography

Market opportunity by geography ($ million)
Data Tables on Market opportunity by geography ($ million)

13. Drivers, Challenges, and Opportunity

13.1 Market drivers

Escalating costs of private vehicle ownership and macroeconomic pressures
Strict regulatory frameworks and municipal sustainability mandates
Technological advancements and rapid digital platform integration

13.2 Market challenges

High operational expenditures and complex fleet maintenance infrastructure
Regulatory compliance hurdles and municipal zoning constraints
Consumer retention volatility and alternative transit competition

13.3 Impact of drivers and challenges

Impact of drivers and challenges in 2025 and 2030

13.4 Market opportunities

Accelerating transition to EV fleets and sustainable fleet governance
Proliferation of P2P car sharing models and decentralized asset utilization
Deep integration of platforms into MaaS ecosystem

14. Competitive Landscape

14.1 Overview

14.2

Overview on criticality of inputs and factors of differentiation

14.3 Landscape disruption

Overview on factors of disruption

14.4 Industry risks

Impact of key risks on business

15. Competitive Analysis

15.1 Companies profiled

Companies covered

15.2 Company ranking index

15.3 Market positioning of companies

Matrix on companies position and classification

15.4 cambio Mobilitatsservice GmbH

cambio Mobilitatsservice GmbH - Overview
cambio Mobilitatsservice GmbH - Product / Service
cambio Mobilitatsservice GmbH - Key offerings
SWOT

15.5 Communauto Group

Communauto Group - Overview
Communauto Group - Product / Service
Communauto Group - Key offerings
SWOT

15.6 Flinkster

Flinkster - Overview
Flinkster - Product / Service
Flinkster - Key offerings
SWOT

15.7 Free2Move SAS

Free2Move SAS - Overview
Free2Move SAS - Product / Service
Free2Move SAS - Key offerings
SWOT

15.8 Getaround Inc.

Getaround Inc. - Overview
Getaround Inc. - Product / Service
Getaround Inc. - Key offerings
SWOT

15.9 GreenMobility AS

GreenMobility AS - Overview
GreenMobility AS - Product / Service
GreenMobility AS - Key offerings
SWOT

15.10 Hertz Global Holdings Inc.

Hertz Global Holdings Inc. - Overview
Hertz Global Holdings Inc. - Business segments
Hertz Global Holdings Inc. - Key offerings
Hertz Global Holdings Inc. - Segment focus
SWOT

15.11 Lyft Inc.

Lyft Inc. - Overview
Lyft Inc. - Product / Service
Lyft Inc. - Key offerings
SWOT

15.12 Mobilize Share

Mobilize Share - Overview
Mobilize Share - Product / Service
Mobilize Share - Key offerings
SWOT

15.13 Modo Co operative

Modo Co operative - Overview
Modo Co operative - Product / Service
Modo Co operative - Key offerings
SWOT

15.14 Myles Automotive Technologies

Myles Automotive Technologies - Overview
Myles Automotive Technologies - Product / Service
Myles Automotive Technologies - Key offerings
SWOT

15.15 Primemover Mobility Pvt. Ltd.

Primemover Mobility Pvt. Ltd. - Overview
Primemover Mobility Pvt. Ltd. - Product / Service
Primemover Mobility Pvt. Ltd. - Key offerings
SWOT

15.16 SOCAR Inc.

SOCAR Inc. - Overview
SOCAR Inc. - Business segments
SOCAR Inc. - Key offerings
SOCAR Inc. - Segment focus
SWOT

15.17 Zipcar Inc.

Zipcar Inc. - Overview
Zipcar Inc. - Product / Service
Zipcar Inc. - Key offerings
SWOT

15.18 Zoomcar India Pvt. Ltd.

Zoomcar India Pvt. Ltd. - Overview
Zoomcar India Pvt. Ltd. - Product / Service
Zoomcar India Pvt. Ltd. - Key offerings
SWOT

16. Appendix

16.1 Scope of the report

Market definition
Objectives
Notes and caveats

16.2 Inclusions and exclusions checklist

Inclusions checklist
Exclusions checklist

16.3 Currency conversion rates for US$

16.4 Research methodology

16.5 Data procurement

Information sources

16.6 Data validation

16.7 Validation techniques employed for market sizing

16.8 Data synthesis

16.9 360 degree market analysis

16.10 List of abbreviations

Research Methodology

Technavio presents a detailed picture of the market by way of study, synthesis, and summation of data from multiple sources. The analysts have presented the various facets of the market with a particular focus on identifying the key industry influencers. The data thus presented is comprehensive, reliable, and the result of extensive research, both primary and secondary.

INFORMATION SOURCES

Primary sources

  • Manufacturers and suppliers
  • Channel partners
  • Industry experts
  • Strategic decision makers

Secondary sources

  • Industry journals and periodicals
  • Government data
  • Financial reports of key industry players
  • Historical data
  • Press releases

DATA ANALYSIS

Data Synthesis

  • Collation of data
  • Estimation of key figures
  • Analysis of derived insights

Data Validation

  • Triangulation with data models
  • Reference against proprietary databases
  • Corroboration with industry experts

REPORT WRITING

Qualitative

  • Market drivers
  • Market challenges
  • Market trends
  • Five forces analysis

Quantitative

  • Market size and forecast
  • Market segmentation
  • Geographical insights
  • Competitive landscape

Interested in this report?

Get your sample now to see our research methodology and insights!

Download Now

Frequently Asked Questions

Car Sharing market growth will increase by USD 13448.6 million during 2026-2030.

The Car Sharing market is expected to grow at a CAGR of 13.2% during 2026-2030.

Car Sharing market is segmented by End-user (Business, Individual) Mode of booking (Online, Offline) Vehicle type (Economy, SUVs or MPVs, Luxury)

cambio Mobilitatsservice GmbH, Communauto Group, Flinkster, Free2Move SAS, Getaround Inc., GoGet, GreenMobility AS, Hertz Global Holdings Inc., Hiyacar Ltd, Lyft Inc., Mobilize Share, Modo Co operative, Myles Automotive Technologies, ORIX Auto Corp, Primemover Mobility Pvt. Ltd., SOCAR Inc., Times Car Share, Turo Inc., Zipcar Inc., Zoomcar India Pvt. Ltd. are a few of the key vendors in the Car Sharing market.

North America will register the highest growth rate of 32.9% among the other regions. Therefore, the Car Sharing market in North America is expected to garner significant business opportunities for the vendors during the forecast period.

US, Canada, Mexico, Germany, UK, France, Italy, Spain, The Netherlands, China, Japan, India, South Korea, Australia, Singapore, Saudi Arabia, UAE, South Africa, Israel, Turkey, Brazil, Argentina, Colombia

  • Escalating costs of private vehicle ownership and macroeconomic pressures is the driving factor this market.

The Car Sharing market vendors should focus on grabbing business opportunities from the End-user segment as it accounted for the largest market share in the base year.
RIA - Research AI Assistant
Ask RIA
