
Connected Rail Solutions Market Analysis, Size, and Forecast 2026-2030: Europe (Germany, UK, and France), APAC (China, Japan, and India), North America (US, Canada, and Mexico), Middle East and Africa (Saudi Arabia, UAE, and South Africa), South America (Brazil, Argentina, and Chile), and Rest of World (ROW)

Connected Rail Solutions Market Analysis, Size, and Forecast 2026-2030:
Europe (Germany, UK, and France), APAC (China, Japan, and India), North America (US, Canada, and Mexico), Middle East and Africa (Saudi Arabia, UAE, and South Africa), South America (Brazil, Argentina, and Chile), and Rest of World (ROW)

Published: Oct 2026 330 Pages SKU: IRTNTR40253

Market Overview at a Glance

$43.18 B
Market Opportunity
6%
CAGR 2025 - 2030
32.8%
APAC Growth
$56.79 B
CBTC segment 2024

Connected Rail Solutions Market Size 2026-2030

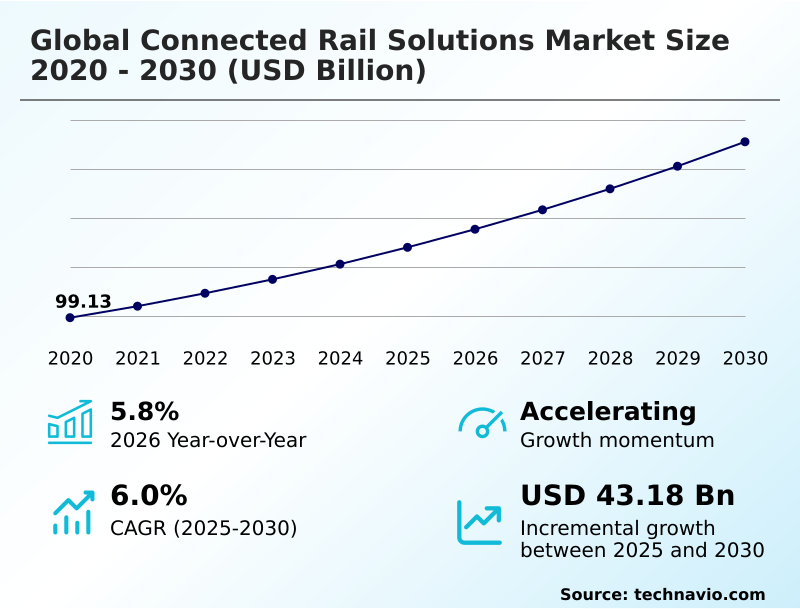
The connected rail solutions market size is valued to increase by USD 43.18 billion, at a CAGR of 6% from 2025 to 2030. Growing investment in rail modernization programs will drive the connected rail solutions market.

Major Market Trends & Insights

  • APAC dominated the market and accounted for a 32.8% growth during the forecast period.
  • By Safety and Signaling System - CBTC segment was valued at USD 56.79 billion in 2024
  • By Deployment - On-premises segment accounted for the largest market revenue share in 2024

Market Size & Forecast

  • Market Opportunities: USD 71.96 billion
  • Market Future Opportunities: USD 43.18 billion
  • CAGR from 2025 to 2030 : 6%

Market Summary

  • The Connected Rail Solutions industry is expanding rapidly as transportation authorities prioritize digital transformation and real-time connectivity across complex transit networks. A critical operational scenario involves transit operators utilizing centralized predictive analytics to monitor wheel bearing conditions, enabling maintenance teams to replace components before catastrophic failures disrupt corridor schedules.
  • Organizations deploying these intelligent operational management platforms frequently achieve a 25% reduction in unplanned maintenance downtime compared to traditional schedule-based servicing approaches. The market is primarily driven by extensive investments in rail modernization programs, which replace aging communication architectures with digitally integrated signaling systems to enhance service reliability.
  • However, substantial integration complexity across legacy rail infrastructure restricts implementation speed, as modern digital protocols often struggle to interface with decades-old, fragmented signaling environments. Addressing this challenge requires customized data synchronization adjustments that extend project timelines.
  • Ultimately, the transition toward cloud-connected asset management and automated passenger information networks continues to reshape how transit authorities optimize infrastructure utilization and improve overall safety performance.

What will be the Size of the Connected Rail Solutions Market during the forecast period?
Get Key Insights on Market Forecast (PDF) Get Free Sample

How is the Connected Rail Solutions Market Segmented?

The connected rail solutions industry research report provides comprehensive data (region-wise segment analysis), with forecasts and estimates in "USD million" for the period 2026-2030, as well as historical data from 2020-2024 for the following segments.

  • Safety and signaling system
    • CBTC
    • PTC
    • ATC
  • Deployment
    • On-premises
    • Cloud-based
  • Service
    • Passenger mobility
    • Train tracking and monitoring
    • Others
  • Type
    • Electric locomotive
    • Diesel locomotive
    • Passenger wagons
    • Others
  • Geography
    • Europe
      • Germany
      • UK
      • France
      • Italy
      • Spain
      • The Netherlands
    • APAC
      • China
      • Japan
      • India
      • South Korea
      • Australia
      • Indonesia
    • North America
      • US
      • Canada
      • Mexico
    • Middle East and Africa
      • Saudi Arabia
      • UAE
      • South Africa
      • Israel
      • Turkey
    • South America
      • Brazil
      • Argentina
      • Chile

By Safety and Signaling System Insights

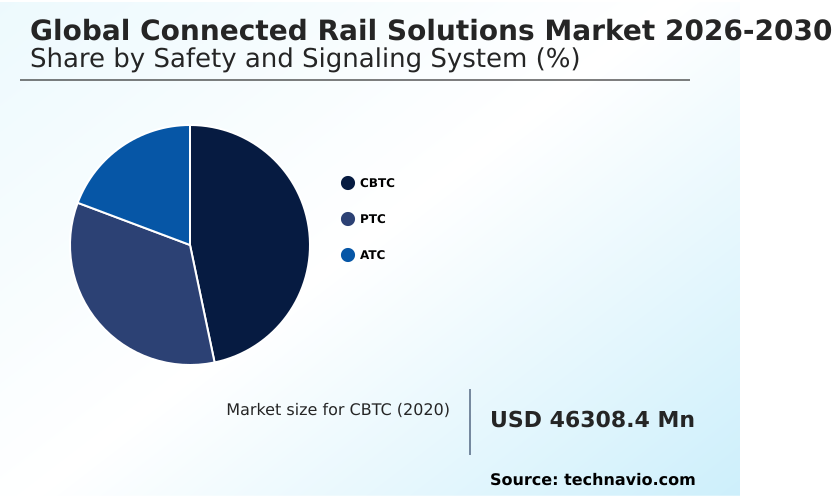
The cbtc segment is estimated to witness significant growth during the forecast period.

The communication based train control segment of the Connected Rail Solutions industry undergoes rapid transformation as transportation authorities prioritize high capacity urban mobility.

Modern digital platforms enable continuous data exchange between rolling stock and network command centers, fostering automated traffic management and enhanced route optimization software accuracy.

Organizations leveraging an intelligent sensor network alongside mobile edge networking frequently observe a 15% improvement in fleet utilization efficiency by reducing headway distances without physical infrastructure expansion.

Furthermore, integrating advanced propulsion system metrics with a predictive maintenance algorithm allows operators to mitigate sudden operational disruptions.

This shift toward connected infrastructure significantly lowers network latency reduction barriers, allowing transit networks to execute automated track inspection protocols seamlessly and improving overall corridor safety.
Get Free Sample

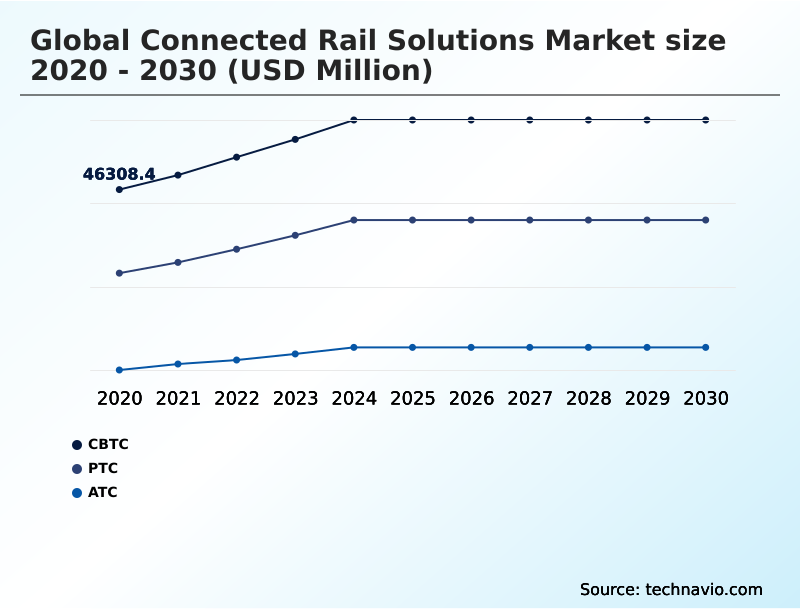
The CBTC segment was valued at USD 56.79 billion in 2024 and showed a gradual increase during the forecast period.
Get Free Sample

Regional Analysis

APAC is estimated to contribute 32.8% to the growth of the global market during the forecast period.Technavio’s analysts have elaborately explained the regional trends and drivers that shape the market during the forecast period.
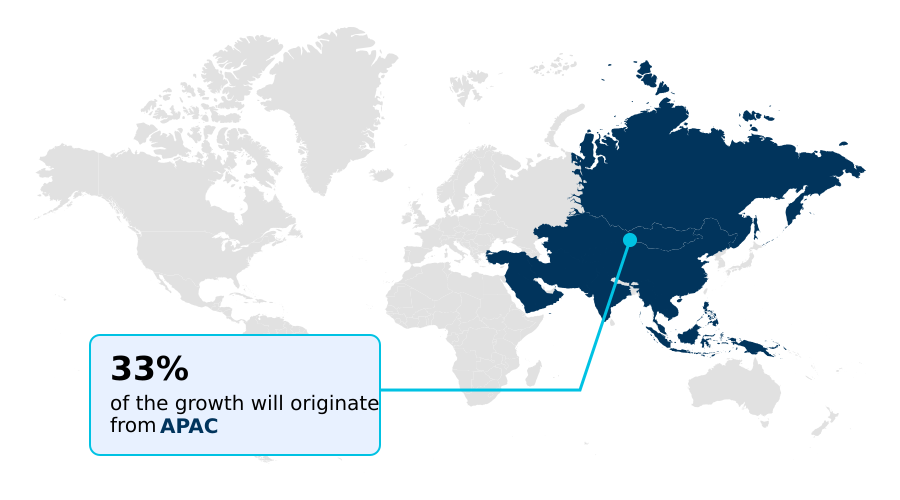
See How Connected Rail Solutions Market Demand is Rising in APAC Get Free Sample

Regional adoption of Connected Rail Solutions highlights distinct strategic priorities between Europe and North America. Europe emphasizes cross border rail network expansion, achieving a 20% higher implementation rate of interoperability framework standard protocols than North America.

European operators leverage software defined signaling and cloud based monitoring to ensure seamless smart city transit coordination across borders.

In contrast, North American authorities enforce positive train control mandates, utilizing an edge computing node architecture and a centralized operational platform to process automated equipment diagnostic data locally.

This focus allows North American freight corridors to reduce signal latency issues by 25% across expansive territories. These regional strategies demonstrate how authorities address legacy system interoperability, ultimately shaping operational efficiency and modernization priorities across distinct transportation environments.

Market Dynamics

Our researchers analyzed the data with 2025 as the base year, along with the key drivers, trends, and challenges. A holistic analysis of drivers will help companies refine their marketing strategies to gain a competitive advantage.

  • The ongoing digitalization of transit ecosystems underscores the critical necessity for advanced operational intelligence across modern transportation networks. Railway operators increasingly deploy predictive maintenance for railway infrastructure to identify component degradation before it leads to critical service failures.
  • By utilizing real time asset visibility platforms, supply chain managers can dynamically route replacement parts to maintenance depots, outperforming traditional scheduled inventory models by reducing parts holding periods by approximately 15%. This proactive resource allocation significantly enhances overall fleet availability.
  • Furthermore, the transition toward cloud based train control systems allows transit authorities to centralize traffic management without maintaining localized, hardware-heavy control centers. This centralization optimizes dispatching efficiency and accelerates operational decision-making during severe network disruptions. To ensure track integrity, engineering teams implement automated track defect detection solutions, which continuously scan for rail anomalies using high-speed optical sensors.
  • This automated inspection methodology drastically lowers the risk of derailments while optimizing track maintenance schedules. Simultaneously, growing metropolitan populations necessitate the implementation of communication based urban transit control to maximize train throughput on existing subway lines.
  • By continuously exchanging telemetry data, these integrated ecosystems empower transportation authorities to operate trains at closer, safer intervals, fundamentally transforming capacity planning and long-term compliance strategies.
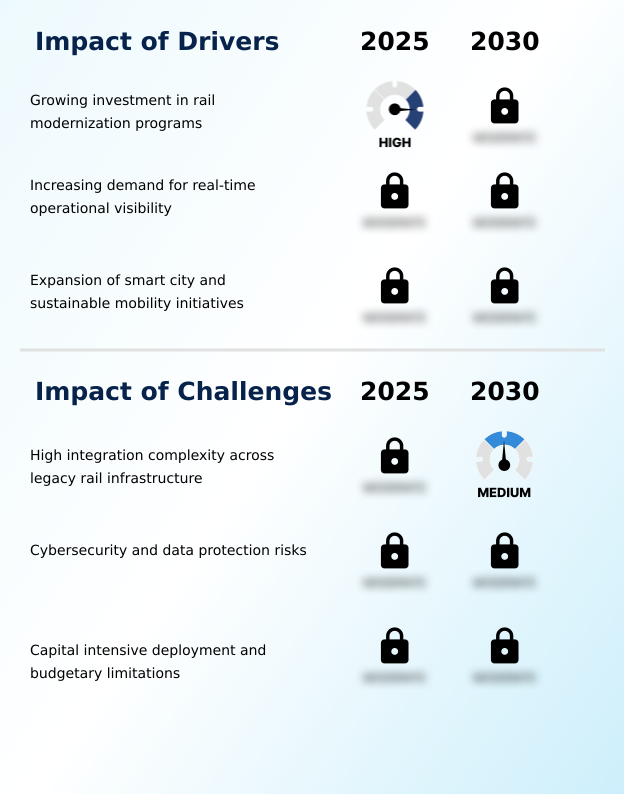
What are the key market drivers leading to the rise in the adoption of Connected Rail Solutions Industry?

  • Rising global investments in comprehensive rail modernization initiatives serve as the primary catalyst driving continuous market expansion.

  • The critical need for enhanced transportation efficiency acts as a primary catalyst accelerating Connected Rail Solutions deployments globally. Transit authorities increasingly adopt a modern digital signaling architecture to optimize corridor capacity, fundamentally altering how operators manage track congestion.
  • By implementing robust wireless operational connectivity over a dedicated cellular rail network, organizations achieve real time asset visibility, which decreases unexpected rolling stock failures by 26%.
  • This continuous connectivity enables seamless signaling infrastructure integration with digital train control systems, streamlining automated dispatching functions. Furthermore, deploying a high capacity radio solution allows agencies to deliver uninterrupted onboard passenger information and support automated fare collection workflows simultaneously.
  • Leveraging these unified data streams facilitates proactive condition based monitoring, ultimately driving a 15% reduction in overall energy consumption through precisely calculated acceleration and braking profiles.

What are the market trends shaping the Connected Rail Solutions Industry?

  • The increasing adoption of digital signaling and software-defined train control systems represents a prominent structural trend shaping the industry. This technological shift enables operators to optimize traffic coordination and enhance overall service reliability across modern networks.

  • The widespread integration of autonomous railway operation capabilities signals a definitive shift toward intelligent transportation ecosystems. Operators are increasingly migrating traffic management workloads to a secure hybrid cloud environment, facilitating advanced predictive infrastructure analytics across sprawling rail networks. This modernization allows transit authorities to establish robust remote asset supervision, reducing manual trackside inspection costs by 22%.
  • To counter evolving digital threats, organizations strengthen cyber risk governance by deploying a strict railway cybersecurity protocol and enforcing a continuous software update cycle. Enhancing operational technology resilience ensures that vital data synchronization process workflows remain uninterrupted during severe network fluctuations.
  • Consequently, transit networks utilizing an intelligent dispatching capability report an 18% improvement in schedule adherence, as automated systems rapidly calculate optimal routing adjustments without human intervention.

What challenges does the Connected Rail Solutions Industry face during its growth?

  • The substantial complexity associated with integrating advanced digital platforms across aging legacy rail infrastructure remains a significant structural restraint.

  • The inherent complexity of upgrading fragmented, decades-old transit infrastructure presents a severe operational restraint for Connected Rail Solutions implementation. Integrating an advanced automatic train control environment into legacy trackside hardware frequently results in prolonged deployment cycles and increased capital expenditure.
  • Establishing continuous data telemetry requires a robust cloud native core network, yet many operators lack the necessary digital maturity to support such demanding data streams. Consequently, transit authorities struggle to deploy defect detection robotics and machine vision inspection tools, delaying modernization timelines by an average of 18%.
  • Implementing specialized hardware, such as a wheel impact load detector, demands precise calibration against a standardized condition assessment metric to function accurately within an intelligent rail infrastructure. These severe integration barriers directly elevate upfront engineering costs by 20%, heavily restricting the rapid digital transformation of aging railway corridors.

Exclusive Technavio Analysis on Customer Landscape

The connected rail solutions market forecasting report includes the adoption lifecycle of the market, covering from the innovator’s stage to the laggard’s stage. It focuses on adoption rates in different regions based on penetration. Furthermore, the connected rail solutions market report also includes key purchase criteria and drivers of price sensitivity to help companies evaluate and develop their market growth analysis strategies.
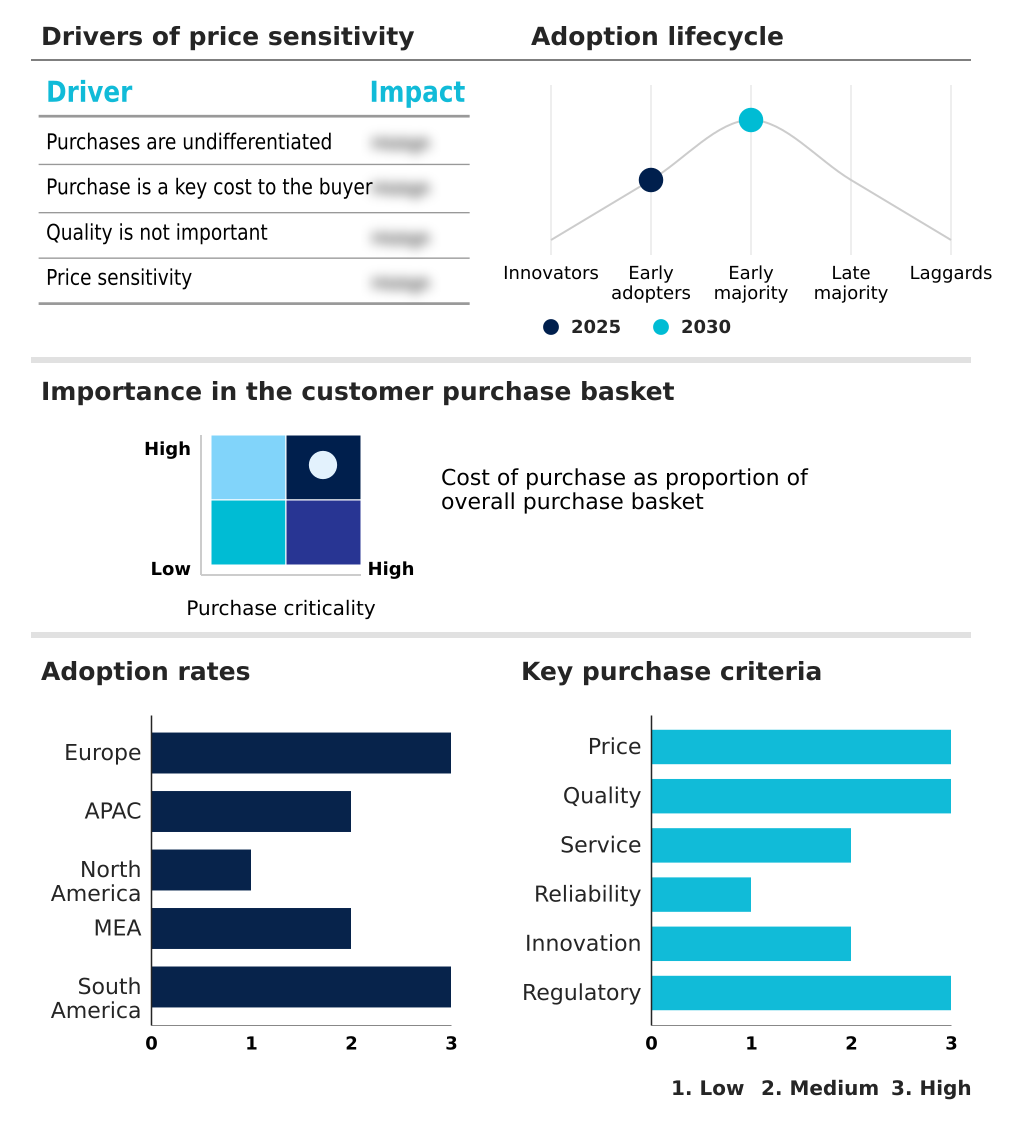
Customer Landscape of Connected Rail Solutions Industry

Competitive Landscape

Companies are implementing various strategies, such as strategic alliances, connected rail solutions market forecast, partnerships, mergers and acquisitions, geographical expansion, and product/service launches, to enhance their presence in the industry.

ABB Ltd. - The enterprise delivers comprehensive intelligent transportation platforms integrating electrification technologies with digital train management software to enhance operational efficiency and streamline predictive maintenance protocols across transit networks.

The industry research and growth report includes detailed analyses of the competitive landscape of the market and information about key companies, including:

  • ABB Ltd.
  • Advantech Co. Ltd.
  • ALSTOM SA
  • CAF Group
  • Cisco Systems Inc.
  • CRRC Corp. Ltd.
  • Hitachi Rail
  • Huawei Technologies Co. Ltd.
  • IBM Corp.
  • Indra Group
  • Knorr Bremse AG
  • Kontron AG
  • Mitsubishi Electric Corp.
  • Nokia Corp.
  • Siemens AG
  • Teleste Corp.
  • Thales Group
  • Toshiba Corp.
  • Trimble Inc.
  • Wabtec Corp.

Qualitative and quantitative analysis of companies has been conducted to help clients understand the wider business environment as well as the strengths and weaknesses of key industry players. Data is qualitatively analyzed to categorize companies as pure play, category-focused, industry-focused, and diversified; it is quantitatively analyzed to categorize companies as dominant, leading, strong, tentative, and weak.

Recent Development and News in Connected rail solutions market

  • In the Rail Transportation industry, the transition toward autonomous train operations has necessitated higher capacity trackside networks, directly impacting Connected Rail Solutions demand by requiring advanced cellular rail network architectures capable of continuous data telemetry.
  • Stringent public transit safety mandates governing passenger movement have driven transit authorities to adopt intelligent dispatching capability protocols, creating new compliance requirements that accelerate the deployment of real time asset visibility platforms within intelligent rail infrastructure.
  • The industry wide shift toward sustainable urban mobility has prompted operators to optimize energy consumption through software defined signaling, significantly boosting the implementation of route optimization software and condition based monitoring applications.
  • Supply chain disruptions affecting legacy signaling hardware components have accelerated the migration toward cloud native core network environments, amplifying the adoption of cloud based train control systems to maintain cross border rail network operations without physical hardware dependencies.

Dive into Technavio’s robust research methodology, blending expert interviews, extensive data synthesis, and validated models for unparalleled Connected Rail Solutions Market insights. See full methodology.

Market Scope
Page number 330
Base year 2025
Historic period 2020-2024
Forecast period 2026-2030
Growth momentum & CAGR Accelerate at a CAGR of 6%
Market growth 2026-2030 USD 43179.4 million
Market structure Fragmented
YoY growth 2025-2026(%) 5.8%
Key countries Germany, UK, France, Italy, Spain, The Netherlands, China, Japan, India, South Korea, Australia, Indonesia, US, Canada, Mexico, Saudi Arabia, UAE, South Africa, Israel, Turkey, Brazil, Argentina and Chile
Competitive landscape Leading Companies, Market Positioning of Companies, Competitive Strategies, and Industry Risks

Request Free Sample

Research Analyst Overview

  • The Connected Rail Solutions ecosystem operates at the forefront of transportation modernization, fundamentally transforming how transit authorities govern infrastructure assets and passenger safety. Boardroom executives increasingly align technology procurement with compliance and capacity planning by transitioning toward a comprehensive digital signaling architecture.
  • Implementing robust wireless operational connectivity enables continuous data telemetry between rolling stock and command centers, empowering leadership to optimize energy consumption and fleet routing dynamically. Operators integrating real time asset visibility alongside condition based monitoring achieve a 30% reduction in critical subsystem failures compared to reactive maintenance protocols.
  • This strategic shift is further accelerated by deploying a wheel impact load detector and machine vision inspection systems, which automatically identify mechanical fatigue without disrupting scheduled passenger services. By establishing advanced automatic train control frameworks, decision-makers ensure stringent safety compliance while maximizing the throughput of existing rail corridors.
  • These intelligent diagnostic capabilities transition infrastructure management from schedule-dependent tasks to data-driven operational strategies, drastically improving network resilience, budget forecasting accuracy, and overall transportation efficiency.

What are the Key Data Covered in this Connected Rail Solutions Market Research and Growth Report?

  • What is the expected growth of the Connected Rail Solutions Market between 2026 and 2030?

    • USD 43.18 billion, at a CAGR of 6%

  • What segmentation does the market report cover?

    • The report is segmented by Safety and Signaling System (CBTC, PTC, and ATC), Deployment (On-premises, and Cloud-based), Service (Passenger mobility, Train tracking and monitoring, and Others), Type (Electric locomotive, Diesel locomotive, Passenger wagons, and Others) and Geography (Europe, APAC, North America, Middle East and Africa, South America)

  • Which regions are analyzed in the report?

    • Europe, APAC, North America, Middle East and Africa and South America

  • What are the key growth drivers and market challenges?

    • Growing investment in rail modernization programs, High integration complexity across legacy rail infrastructure

  • Who are the major players in the Connected Rail Solutions Market?

    • ABB Ltd., Advantech Co. Ltd., ALSTOM SA, CAF Group, Cisco Systems Inc., CRRC Corp. Ltd., Hitachi Rail, Huawei Technologies Co. Ltd., IBM Corp., Indra Group, Knorr Bremse AG, Kontron AG, Mitsubishi Electric Corp., Nokia Corp., Siemens AG, Teleste Corp., Thales Group, Toshiba Corp., Trimble Inc. and Wabtec Corp.

Market Research Insights

  • The Connected Rail Solutions sector rapidly integrates advanced digital communication technologies to optimize transit efficiency and passenger safety. Transit authorities increasingly prioritize signaling infrastructure integration, enabling operators to improve headway management by 18% across congested urban corridors.
  • Deploying a high capacity radio solution empowers control centers to maintain continuous connectivity with rolling stock, enhancing emergency response times by 22% during operational disruptions. Furthermore, implementing defect detection robotics along tracksides reduces manual inspection requirements while increasing anomaly identification accuracy by 30% compared to traditional methods.
  • These connected ecosystems utilize a robust cellular rail network to deliver real-time onboard passenger information, fundamentally elevating transit reliability and optimizing continuous network performance.

We can help! Our analysts can customize this connected rail solutions market research report to meet your requirements.

Get in touch

1. Executive Summary

1.1 Market overview

Executive Summary - Chart on Market Overview
Executive Summary - Data Table on Market Overview
Executive Summary - Chart on Global Market Characteristics
Executive Summary - Chart on Market by Geography
Executive Summary - Chart on Market Segmentation by Safety and Signaling System
Executive Summary - Chart on Market Segmentation by Deployment
Executive Summary - Chart on Market Segmentation by Service
Executive Summary - Chart on Market Segmentation by Type
Executive Summary - Chart on Incremental Growth
Executive Summary - Data Table on Incremental Growth
Executive Summary - Chart on Company Market Positioning

2. Technavio Analysis

2.1 Analysis of price sensitivity, lifecycle, customer purchase basket, adoption rates, and purchase criteria

2.2 Criticality of inputs and Factors of differentiation

Chart on Overview on criticality of inputs and factors of differentiation

2.3 Factors of disruption

Chart on Overview on factors of disruption

2.4 Impact of drivers and challenges

Chart on Impact of drivers and challenges in 2025 and 2030

3. Market Landscape

3.1 Market ecosystem

Chart on Parent Market
Data Table on - Parent Market

3.2 Market characteristics

Chart on Market characteristics analysis

3.3 Value chain analysis

Chart on Value chain analysis

4. Market Sizing

4.1 Market definition

Data Table on Offerings of companies included in the market definition

4.2 Market segment analysis

Market segments

4.3 Market size 2025

4.4 Market outlook: Forecast for 2025-2030

Chart on Global - Market size and forecast 2025-2030 ($ million)
Data Table on Global - Market size and forecast 2025-2030 ($ million)
Chart on Global Market: Year-over-year growth 2025-2030 (%)
Data Table on Global Market: Year-over-year growth 2025-2030 (%)

5. Historic Market Size

5.1 Global Connected Rail Solutions Market 2020 - 2024

Historic Market Size - Data Table on Global Connected Rail Solutions Market 2020 - 2024 ($ million)

5.2 Safety and Signaling System segment analysis 2020 - 2024

Historic Market Size - Safety and Signaling System Segment 2020 - 2024 ($ million)

5.3 Deployment segment analysis 2020 - 2024

Historic Market Size - Deployment Segment 2020 - 2024 ($ million)

5.4 Service segment analysis 2020 - 2024

Historic Market Size - Service Segment 2020 - 2024 ($ million)

5.5 Type segment analysis 2020 - 2024

Historic Market Size - Type Segment 2020 - 2024 ($ million)

5.6 Geography segment analysis 2020 - 2024

Historic Market Size - Geography Segment 2020 - 2024 ($ million)

5.7 Country segment analysis 2020 - 2024

Historic Market Size - Country Segment 2020 - 2024 ($ million)

6. Qualitative Analysis

6.1 Impact of AI on global connected rail solutions market

6.2 Impact of geopolitical conflicts on global connected rail solutions market

7. Five Forces Analysis

7.1 Five forces summary

Five forces analysis - Comparison between 2025 and 2030

7.2 Bargaining power of buyers

Bargaining power of buyers - Impact of key factors 2025 and 2030

7.3 Bargaining power of suppliers

Bargaining power of suppliers - Impact of key factors in 2025 and 2030

7.4 Threat of new entrants

Threat of new entrants - Impact of key factors in 2025 and 2030

7.5 Threat of substitutes

Threat of substitutes - Impact of key factors in 2025 and 2030

7.6 Threat of rivalry

Threat of rivalry - Impact of key factors in 2025 and 2030

7.7 Market condition

Chart on Market condition - Five forces 2025 and 2030

8. Market Segmentation by Safety and Signaling System

8.1 Market segments

Chart on Safety and Signaling System - Market share 2025-2030 (%)
Data Table on Safety and Signaling System - Market share 2025-2030 (%)

8.2 Comparison by Safety and Signaling System

Chart on Comparison by Safety and Signaling System
Data Table on Comparison by Safety and Signaling System

8.3 CBTC - Market size and forecast 2025-2030

Chart on CBTC - Market size and forecast 2025-2030 ($ million)
Data Table on CBTC - Market size and forecast 2025-2030 ($ million)
Chart on CBTC - Year-over-year growth 2025-2030 (%)
Data Table on CBTC - Year-over-year growth 2025-2030 (%)

8.4 PTC - Market size and forecast 2025-2030

Chart on PTC - Market size and forecast 2025-2030 ($ million)
Data Table on PTC - Market size and forecast 2025-2030 ($ million)
Chart on PTC - Year-over-year growth 2025-2030 (%)
Data Table on PTC - Year-over-year growth 2025-2030 (%)

8.5 ATC - Market size and forecast 2025-2030

Chart on ATC - Market size and forecast 2025-2030 ($ million)
Data Table on ATC - Market size and forecast 2025-2030 ($ million)
Chart on ATC - Year-over-year growth 2025-2030 (%)
Data Table on ATC - Year-over-year growth 2025-2030 (%)

8.6 Market opportunity by Safety and Signaling System

Market opportunity by Safety and Signaling System ($ million)
Data Table on Market opportunity by Safety and Signaling System ($ million)

9. Market Segmentation by Deployment

9.1 Market segments

Chart on Deployment - Market share 2025-2030 (%)
Data Table on Deployment - Market share 2025-2030 (%)

9.2 Comparison by Deployment

Chart on Comparison by Deployment
Data Table on Comparison by Deployment

9.3 On-premises - Market size and forecast 2025-2030

Chart on On-premises - Market size and forecast 2025-2030 ($ million)
Data Table on On-premises - Market size and forecast 2025-2030 ($ million)
Chart on On-premises - Year-over-year growth 2025-2030 (%)
Data Table on On-premises - Year-over-year growth 2025-2030 (%)

9.4 Cloud-based - Market size and forecast 2025-2030

Chart on Cloud-based - Market size and forecast 2025-2030 ($ million)
Data Table on Cloud-based - Market size and forecast 2025-2030 ($ million)
Chart on Cloud-based - Year-over-year growth 2025-2030 (%)
Data Table on Cloud-based - Year-over-year growth 2025-2030 (%)

9.5 Market opportunity by Deployment

Market opportunity by Deployment ($ million)
Data Table on Market opportunity by Deployment ($ million)

10. Market Segmentation by Service

10.1 Market segments

Chart on Service - Market share 2025-2030 (%)
Data Table on Service - Market share 2025-2030 (%)

10.2 Comparison by Service

Chart on Comparison by Service
Data Table on Comparison by Service

10.3 Passenger mobility - Market size and forecast 2025-2030

Chart on Passenger mobility - Market size and forecast 2025-2030 ($ million)
Data Table on Passenger mobility - Market size and forecast 2025-2030 ($ million)
Chart on Passenger mobility - Year-over-year growth 2025-2030 (%)
Data Table on Passenger mobility - Year-over-year growth 2025-2030 (%)

10.4 Train tracking and monitoring - Market size and forecast 2025-2030

Chart on Train tracking and monitoring - Market size and forecast 2025-2030 ($ million)
Data Table on Train tracking and monitoring - Market size and forecast 2025-2030 ($ million)
Chart on Train tracking and monitoring - Year-over-year growth 2025-2030 (%)
Data Table on Train tracking and monitoring - Year-over-year growth 2025-2030 (%)

10.5 Others - Market size and forecast 2025-2030

Chart on Others - Market size and forecast 2025-2030 ($ million)
Data Table on Others - Market size and forecast 2025-2030 ($ million)
Chart on Others - Year-over-year growth 2025-2030 (%)
Data Table on Others - Year-over-year growth 2025-2030 (%)

10.6 Market opportunity by Service

Market opportunity by Service ($ million)
Data Table on Market opportunity by Service ($ million)

11. Market Segmentation by Type

11.1 Market segments

Chart on Type - Market share 2025-2030 (%)
Data Table on Type - Market share 2025-2030 (%)

11.2 Comparison by Type

Chart on Comparison by Type
Data Table on Comparison by Type

11.3 Electric locomotive - Market size and forecast 2025-2030

Chart on Electric locomotive - Market size and forecast 2025-2030 ($ million)
Data Table on Electric locomotive - Market size and forecast 2025-2030 ($ million)
Chart on Electric locomotive - Year-over-year growth 2025-2030 (%)
Data Table on Electric locomotive - Year-over-year growth 2025-2030 (%)

11.4 Diesel locomotive - Market size and forecast 2025-2030

Chart on Diesel locomotive - Market size and forecast 2025-2030 ($ million)
Data Table on Diesel locomotive - Market size and forecast 2025-2030 ($ million)
Chart on Diesel locomotive - Year-over-year growth 2025-2030 (%)
Data Table on Diesel locomotive - Year-over-year growth 2025-2030 (%)

11.5 Passenger wagons - Market size and forecast 2025-2030

Chart on Passenger wagons - Market size and forecast 2025-2030 ($ million)
Data Table on Passenger wagons - Market size and forecast 2025-2030 ($ million)
Chart on Passenger wagons - Year-over-year growth 2025-2030 (%)
Data Table on Passenger wagons - Year-over-year growth 2025-2030 (%)

11.6 Others - Market size and forecast 2025-2030

Chart on Others - Market size and forecast 2025-2030 ($ million)
Data Table on Others - Market size and forecast 2025-2030 ($ million)
Chart on Others - Year-over-year growth 2025-2030 (%)
Data Table on Others - Year-over-year growth 2025-2030 (%)

11.7 Market opportunity by Type

Market opportunity by Type ($ million)
Data Table on Market opportunity by Type ($ million)

12. Customer Landscape

12.1 Customer landscape overview

Analysis of price sensitivity, lifecycle, customer purchase basket, adoption rates, and purchase criteria

13. Geographic Landscape

13.1 Geographic segmentation

Chart on Market share by geography 2025-2030 (%)
Data Table on Market share by geography 2025-2030 (%)

13.2 Geographic comparison

Chart on Geographic comparison
Data Table on Geographic comparison

13.3 Europe - Market size and forecast 2025-2030

Chart on Europe - Market size and forecast 2025-2030 ($ million)
Data Table on Europe - Market size and forecast 2025-2030 ($ million)
Chart on Europe - Year-over-year growth 2025-2030 (%)
Data Table on Europe - Year-over-year growth 2025-2030 (%)
Chart on Regional Comparison - Europe
Data Table on Regional Comparison - Europe

13.3.1 Germany - Market size and forecast 2025-2030

Chart on Germany - Market size and forecast 2025-2030 ($ million)
Data Table on Germany - Market size and forecast 2025-2030 ($ million)
Chart on Germany - Year-over-year growth 2025-2030 (%)
Data Table on Germany - Year-over-year growth 2025-2030 (%)

13.3.2 UK - Market size and forecast 2025-2030

Chart on UK - Market size and forecast 2025-2030 ($ million)
Data Table on UK - Market size and forecast 2025-2030 ($ million)
Chart on UK - Year-over-year growth 2025-2030 (%)
Data Table on UK - Year-over-year growth 2025-2030 (%)

13.3.3 France - Market size and forecast 2025-2030

Chart on France - Market size and forecast 2025-2030 ($ million)
Data Table on France - Market size and forecast 2025-2030 ($ million)
Chart on France - Year-over-year growth 2025-2030 (%)
Data Table on France - Year-over-year growth 2025-2030 (%)

13.3.4 Italy - Market size and forecast 2025-2030

Chart on Italy - Market size and forecast 2025-2030 ($ million)
Data Table on Italy - Market size and forecast 2025-2030 ($ million)
Chart on Italy - Year-over-year growth 2025-2030 (%)
Data Table on Italy - Year-over-year growth 2025-2030 (%)

13.3.5 Spain - Market size and forecast 2025-2030

Chart on Spain - Market size and forecast 2025-2030 ($ million)
Data Table on Spain - Market size and forecast 2025-2030 ($ million)
Chart on Spain - Year-over-year growth 2025-2030 (%)
Data Table on Spain - Year-over-year growth 2025-2030 (%)

13.3.6 The Netherlands - Market size and forecast 2025-2030

Chart on The Netherlands - Market size and forecast 2025-2030 ($ million)
Data Table on The Netherlands - Market size and forecast 2025-2030 ($ million)
Chart on The Netherlands - Year-over-year growth 2025-2030 (%)
Data Table on The Netherlands - Year-over-year growth 2025-2030 (%)

13.4 APAC - Market size and forecast 2025-2030

Chart on APAC - Market size and forecast 2025-2030 ($ million)
Data Table on APAC - Market size and forecast 2025-2030 ($ million)
Chart on APAC - Year-over-year growth 2025-2030 (%)
Data Table on APAC - Year-over-year growth 2025-2030 (%)
Chart on Regional Comparison - APAC
Data Table on Regional Comparison - APAC

13.4.1 China - Market size and forecast 2025-2030

Chart on China - Market size and forecast 2025-2030 ($ million)
Data Table on China - Market size and forecast 2025-2030 ($ million)
Chart on China - Year-over-year growth 2025-2030 (%)
Data Table on China - Year-over-year growth 2025-2030 (%)

13.4.2 Japan - Market size and forecast 2025-2030

Chart on Japan - Market size and forecast 2025-2030 ($ million)
Data Table on Japan - Market size and forecast 2025-2030 ($ million)
Chart on Japan - Year-over-year growth 2025-2030 (%)
Data Table on Japan - Year-over-year growth 2025-2030 (%)

13.4.3 India - Market size and forecast 2025-2030

Chart on India - Market size and forecast 2025-2030 ($ million)
Data Table on India - Market size and forecast 2025-2030 ($ million)
Chart on India - Year-over-year growth 2025-2030 (%)
Data Table on India - Year-over-year growth 2025-2030 (%)

13.4.4 South Korea - Market size and forecast 2025-2030

Chart on South Korea - Market size and forecast 2025-2030 ($ million)
Data Table on South Korea - Market size and forecast 2025-2030 ($ million)
Chart on South Korea - Year-over-year growth 2025-2030 (%)
Data Table on South Korea - Year-over-year growth 2025-2030 (%)

13.4.5 Australia - Market size and forecast 2025-2030

Chart on Australia - Market size and forecast 2025-2030 ($ million)
Data Table on Australia - Market size and forecast 2025-2030 ($ million)
Chart on Australia - Year-over-year growth 2025-2030 (%)
Data Table on Australia - Year-over-year growth 2025-2030 (%)

13.4.6 Indonesia - Market size and forecast 2025-2030

Chart on Indonesia - Market size and forecast 2025-2030 ($ million)
Data Table on Indonesia - Market size and forecast 2025-2030 ($ million)
Chart on Indonesia - Year-over-year growth 2025-2030 (%)
Data Table on Indonesia - Year-over-year growth 2025-2030 (%)

13.5 North America - Market size and forecast 2025-2030

Chart on North America - Market size and forecast 2025-2030 ($ million)
Data Table on North America - Market size and forecast 2025-2030 ($ million)
Chart on North America - Year-over-year growth 2025-2030 (%)
Data Table on North America - Year-over-year growth 2025-2030 (%)
Chart on Regional Comparison - North America
Data Table on Regional Comparison - North America

13.5.1 US - Market size and forecast 2025-2030

Chart on US - Market size and forecast 2025-2030 ($ million)
Data Table on US - Market size and forecast 2025-2030 ($ million)
Chart on US - Year-over-year growth 2025-2030 (%)
Data Table on US - Year-over-year growth 2025-2030 (%)

13.5.2 Canada - Market size and forecast 2025-2030

Chart on Canada - Market size and forecast 2025-2030 ($ million)
Data Table on Canada - Market size and forecast 2025-2030 ($ million)
Chart on Canada - Year-over-year growth 2025-2030 (%)
Data Table on Canada - Year-over-year growth 2025-2030 (%)

13.5.3 Mexico - Market size and forecast 2025-2030

Chart on Mexico - Market size and forecast 2025-2030 ($ million)
Data Table on Mexico - Market size and forecast 2025-2030 ($ million)
Chart on Mexico - Year-over-year growth 2025-2030 (%)
Data Table on Mexico - Year-over-year growth 2025-2030 (%)

13.6 Middle East and Africa - Market size and forecast 2025-2030

Chart on Middle East and Africa - Market size and forecast 2025-2030 ($ million)
Data Table on Middle East and Africa - Market size and forecast 2025-2030 ($ million)
Chart on Middle East and Africa - Year-over-year growth 2025-2030 (%)
Data Table on Middle East and Africa - Year-over-year growth 2025-2030 (%)
Chart on Regional Comparison - Middle East and Africa
Data Table on Regional Comparison - Middle East and Africa

13.6.1 Saudi Arabia - Market size and forecast 2025-2030

Chart on Saudi Arabia - Market size and forecast 2025-2030 ($ million)
Data Table on Saudi Arabia - Market size and forecast 2025-2030 ($ million)
Chart on Saudi Arabia - Year-over-year growth 2025-2030 (%)
Data Table on Saudi Arabia - Year-over-year growth 2025-2030 (%)

13.6.2 UAE - Market size and forecast 2025-2030

Chart on UAE - Market size and forecast 2025-2030 ($ million)
Data Table on UAE - Market size and forecast 2025-2030 ($ million)
Chart on UAE - Year-over-year growth 2025-2030 (%)
Data Table on UAE - Year-over-year growth 2025-2030 (%)

13.6.3 South Africa - Market size and forecast 2025-2030

Chart on South Africa - Market size and forecast 2025-2030 ($ million)
Data Table on South Africa - Market size and forecast 2025-2030 ($ million)
Chart on South Africa - Year-over-year growth 2025-2030 (%)
Data Table on South Africa - Year-over-year growth 2025-2030 (%)

13.6.4 Israel - Market size and forecast 2025-2030

Chart on Israel - Market size and forecast 2025-2030 ($ million)
Data Table on Israel - Market size and forecast 2025-2030 ($ million)
Chart on Israel - Year-over-year growth 2025-2030 (%)
Data Table on Israel - Year-over-year growth 2025-2030 (%)

13.6.5 Turkey - Market size and forecast 2025-2030

Chart on Turkey - Market size and forecast 2025-2030 ($ million)
Data Table on Turkey - Market size and forecast 2025-2030 ($ million)
Chart on Turkey - Year-over-year growth 2025-2030 (%)
Data Table on Turkey - Year-over-year growth 2025-2030 (%)

13.7 South America - Market size and forecast 2025-2030

Chart on South America - Market size and forecast 2025-2030 ($ million)
Data Table on South America - Market size and forecast 2025-2030 ($ million)
Chart on South America - Year-over-year growth 2025-2030 (%)
Data Table on South America - Year-over-year growth 2025-2030 (%)
Chart on Regional Comparison - South America
Data Table on Regional Comparison - South America

13.7.1 Brazil - Market size and forecast 2025-2030

Chart on Brazil - Market size and forecast 2025-2030 ($ million)
Data Table on Brazil - Market size and forecast 2025-2030 ($ million)
Chart on Brazil - Year-over-year growth 2025-2030 (%)
Data Table on Brazil - Year-over-year growth 2025-2030 (%)

13.7.2 Argentina - Market size and forecast 2025-2030

Chart on Argentina - Market size and forecast 2025-2030 ($ million)
Data Table on Argentina - Market size and forecast 2025-2030 ($ million)
Chart on Argentina - Year-over-year growth 2025-2030 (%)
Data Table on Argentina - Year-over-year growth 2025-2030 (%)

13.7.3 Chile - Market size and forecast 2025-2030

Chart on Chile - Market size and forecast 2025-2030 ($ million)
Data Table on Chile - Market size and forecast 2025-2030 ($ million)
Chart on Chile - Year-over-year growth 2025-2030 (%)
Data Table on Chile - Year-over-year growth 2025-2030 (%)

13.8 Market opportunity by geography

Market opportunity by geography ($ million)
Data Tables on Market opportunity by geography ($ million)

14. Drivers, Challenges, and Opportunity

14.1 Market drivers

Growing investment in rail modernization programs
Increasing demand for real-time operational visibility
Expansion of smart city and sustainable mobility initiatives

14.2 Market challenges

High integration complexity across legacy rail infrastructure
Cybersecurity and data protection risks
Capital intensive deployment and budgetary limitations

14.3 Impact of drivers and challenges

Impact of drivers and challenges in 2025 and 2030

14.4 Market opportunities

Growing adoption of digital signaling and SDTC
Increasing integration of railway telecommunications with operational platforms
Expansion of AI-enabled predictive maintenance and asset intelligence platforms

15. Competitive Landscape

15.1 Overview

15.2

Overview on criticality of inputs and factors of differentiation

15.3 Landscape disruption

Overview on factors of disruption

15.4 Industry risks

Impact of key risks on business

16. Competitive Analysis

16.1 Companies profiled

Companies covered

16.2 Company ranking index

16.3 Market positioning of companies

Matrix on companies position and classification

16.4 ABB Ltd.

ABB Ltd. - Overview
ABB Ltd. - Business segments
ABB Ltd. - Key news
ABB Ltd. - Key offerings
ABB Ltd. - Segment focus
SWOT

16.5 Advantech Co. Ltd.

Advantech Co. Ltd. - Overview
Advantech Co. Ltd. - Business segments
Advantech Co. Ltd. - Key offerings
Advantech Co. Ltd. - Segment focus
SWOT

16.6 ALSTOM SA

ALSTOM SA - Overview
ALSTOM SA - Business segments
ALSTOM SA - Key offerings
ALSTOM SA - Segment focus
SWOT

16.7 CAF Group

CAF Group - Overview
CAF Group - Business segments
CAF Group - Key offerings
CAF Group - Segment focus
SWOT

16.8 Cisco Systems Inc.

Cisco Systems Inc. - Overview
Cisco Systems Inc. - Business segments
Cisco Systems Inc. - Key news
Cisco Systems Inc. - Key offerings
Cisco Systems Inc. - Segment focus
SWOT

16.9 CRRC Corp. Ltd.

CRRC Corp. Ltd. - Overview
CRRC Corp. Ltd. - Product / Service
CRRC Corp. Ltd. - Key offerings
SWOT

16.10 Huawei Technologies Co. Ltd.

Huawei Technologies Co. Ltd. - Overview
Huawei Technologies Co. Ltd. - Product / Service
Huawei Technologies Co. Ltd. - Key offerings
SWOT

16.11 IBM Corp.

IBM Corp. - Overview
IBM Corp. - Business segments
IBM Corp. - Key news
IBM Corp. - Key offerings
IBM Corp. - Segment focus
SWOT

16.12 Knorr Bremse AG

Knorr Bremse AG - Overview
Knorr Bremse AG - Business segments
Knorr Bremse AG - Key offerings
Knorr Bremse AG - Segment focus
SWOT

16.13 Mitsubishi Electric Corp.

Mitsubishi Electric Corp. - Overview
Mitsubishi Electric Corp. - Business segments
Mitsubishi Electric Corp. - Key offerings
Mitsubishi Electric Corp. - Segment focus
SWOT

16.14 Nokia Corp.

Nokia Corp. - Overview
Nokia Corp. - Business segments
Nokia Corp. - Key news
Nokia Corp. - Key offerings
Nokia Corp. - Segment focus
SWOT

16.15 Siemens AG

Siemens AG - Overview
Siemens AG - Business segments
Siemens AG - Key news
Siemens AG - Key offerings
Siemens AG - Segment focus
SWOT

16.16 Thales Group

Thales Group - Overview
Thales Group - Business segments
Thales Group - Key news
Thales Group - Key offerings
Thales Group - Segment focus
SWOT

16.17 Trimble Inc.

Trimble Inc. - Overview
Trimble Inc. - Business segments
Trimble Inc. - Key news
Trimble Inc. - Key offerings
Trimble Inc. - Segment focus
SWOT

16.18 Wabtec Corp.

Wabtec Corp. - Overview
Wabtec Corp. - Business segments
Wabtec Corp. - Key offerings
Wabtec Corp. - Segment focus
SWOT

17. Appendix

17.1 Scope of the report

Market definition
Objectives
Notes and caveats

17.2 Inclusions and exclusions checklist

Inclusions checklist
Exclusions checklist

17.3 Currency conversion rates for US$

17.4 Research methodology

17.5 Data procurement

Information sources

17.6 Data validation

17.7 Validation techniques employed for market sizing

17.8 Data synthesis

17.9 360 degree market analysis

17.10 List of abbreviations

Research Methodology

Technavio presents a detailed picture of the market by way of study, synthesis, and summation of data from multiple sources. The analysts have presented the various facets of the market with a particular focus on identifying the key industry influencers. The data thus presented is comprehensive, reliable, and the result of extensive research, both primary and secondary.

INFORMATION SOURCES

Primary sources

  • Manufacturers and suppliers
  • Channel partners
  • Industry experts
  • Strategic decision makers

Secondary sources

  • Industry journals and periodicals
  • Government data
  • Financial reports of key industry players
  • Historical data
  • Press releases

DATA ANALYSIS

Data Synthesis

  • Collation of data
  • Estimation of key figures
  • Analysis of derived insights

Data Validation

  • Triangulation with data models
  • Reference against proprietary databases
  • Corroboration with industry experts

REPORT WRITING

Qualitative

  • Market drivers
  • Market challenges
  • Market trends
  • Five forces analysis

Quantitative

  • Market size and forecast
  • Market segmentation
  • Geographical insights
  • Competitive landscape

Interested in this report?

Get your sample now to see our research methodology and insights!

Download Now

Frequently Asked Questions

Connected Rail Solutions market growth will increase by USD 43179.4 million during 2026-2030.

The Connected Rail Solutions market is expected to grow at a CAGR of 6% during 2026-2030.

Connected Rail Solutions market is segmented by Safety and signaling system (CBTC, PTC, ATC) Deployment (On-premises, Cloud-based) Service (Passenger mobility, Train tracking and monitoring, Others) Type (Electric locomotive, Diesel locomotive, Passenger wagons, Others)

ABB Ltd., Advantech Co. Ltd., ALSTOM SA, CAF Group, Cisco Systems Inc., CRRC Corp. Ltd., Hitachi Rail, Huawei Technologies Co. Ltd., IBM Corp., Indra Group, Knorr Bremse AG, Kontron AG, Mitsubishi Electric Corp., Nokia Corp., Siemens AG, Teleste Corp., Thales Group, Toshiba Corp., Trimble Inc., Wabtec Corp. are a few of the key vendors in the Connected Rail Solutions market.

APAC will register the highest growth rate of 32.8% among the other regions. Therefore, the Connected Rail Solutions market in APAC is expected to garner significant business opportunities for the vendors during the forecast period.

Germany, UK, France, Italy, Spain, The Netherlands, China, Japan, India, South Korea, Australia, Indonesia, US, Canada, Mexico, Saudi Arabia, UAE, South Africa, Israel, Turkey, Brazil, Argentina, Chile

  • Growing investment in rail modernization programs is the driving factor this market.

The Connected Rail Solutions market vendors should focus on grabbing business opportunities from the Safety and signaling system segment as it accounted for the largest market share in the base year.
RIA - Research AI Assistant
Ask RIA
