Craft Beer Market Analysis, Size, and Forecast 2026-2030: North America (US, Canada, and Mexico), Europe (Germany, UK, and France), APAC (China, Japan, and Australia), South America (Brazil, Argentina, and Chile), Middle East and Africa (South Africa, Nigeria, and Egypt), and Rest of World (ROW)

Craft Beer Market Analysis, Size, and Forecast 2026-2030:
North America (US, Canada, and Mexico), Europe (Germany, UK, and France), APAC (China, Japan, and Australia), South America (Brazil, Argentina, and Chile), Middle East and Africa (South Africa, Nigeria, and Egypt), and Rest of World (ROW)

Published: Oct 2026 305 Pages SKU: IRTNTR40946

Market Overview at a Glance

$81.67 B
Market Opportunity
8.9%
CAGR 2025 - 2030
39.1%
North America Growth
$44.26 B
India pale ale segment 2024

Craft Beer Market Size 2026-2030

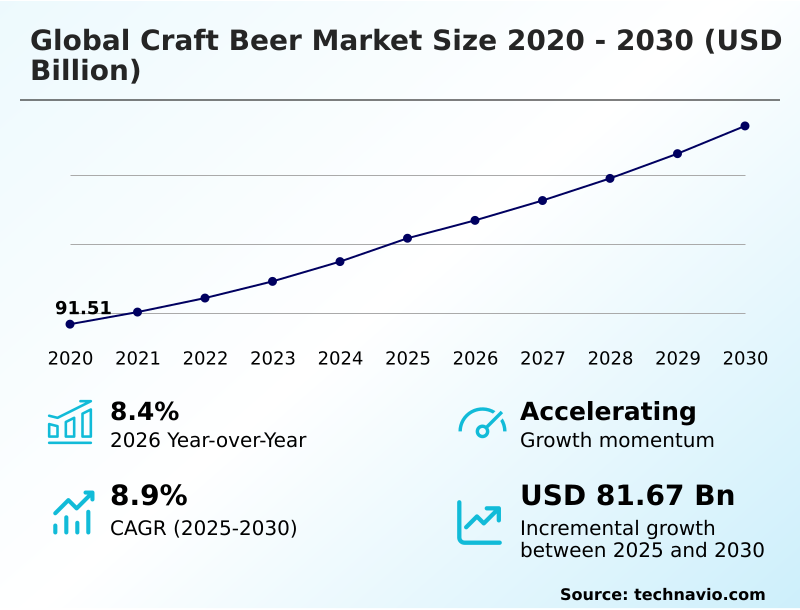
The craft beer market size is valued to increase by USD 81.67 billion, at a CAGR of 8.9% from 2025 to 2030. Growth of brewery tourism and experiential consumption will drive the craft beer market.

Major Market Trends & Insights

  • North America dominated the market and accounted for a 39.1% growth during the forecast period.
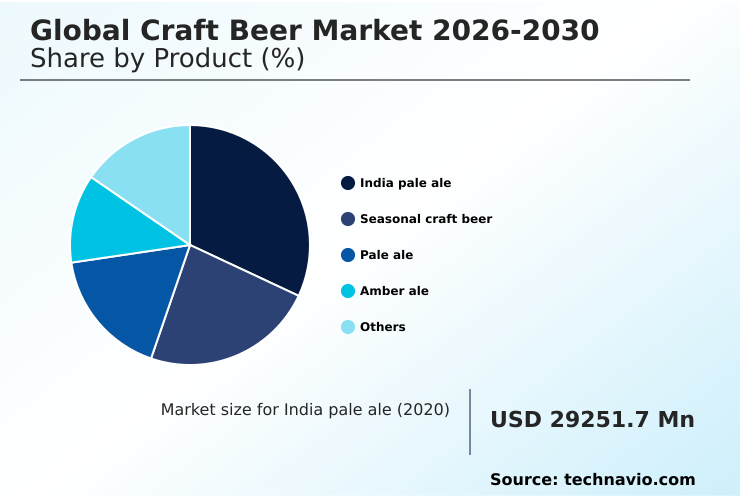
  • By Product - India pale ale segment was valued at USD 44.26 billion in 2024
  • By Distribution Channel - Off-trade segment accounted for the largest market revenue share in 2024

Market Size & Forecast

  • Market Opportunities: USD 144.18 billion
  • Market Future Opportunities: USD 81.67 billion
  • CAGR from 2025 to 2030 : 8.9%

Market Summary

  • The Craft Beer Market continues to expand as consumer preferences shift toward premium, highly differentiated beverage experiences. Product innovation and authentic brewing craftsmanship remain central to this evolution. In the Brewers industry, supply chain optimization has become critical; for instance, modernizing raw material procurement processes has improved inventory turnaround times by 18% for independent producers.
  • A primary driver propelling this market is the expansion of experiential beverage consumption through taprooms and brewery tours, which directly increases brand loyalty and off-trade sales volumes. Conversely, high production and operating costs present a significant challenge, as the reliance on specialty ingredients and small-batch production limits economies of scale.
  • The adoption of efficient brewing capacity optimization strategies allows operators to mitigate these constraints while maintaining product quality. Furthermore, the rising demand for diverse flavor profiles continually pushes breweries to refine their mixed fermentation methods.
  • This sustained focus on quality and innovation ensures that the Craft Beer landscape remains robust, despite intense competition from commercial beverage manufacturers and alternative alcohol categories.

What will be the Size of the Craft Beer Market during the forecast period?
Get Key Insights on Market Forecast (PDF) Get Free Sample

How is the Craft Beer Market Segmented?

The craft beer industry research report provides comprehensive data (region-wise segment analysis), with forecasts and estimates in "USD million" for the period 2026-2030, as well as historical data from 2020-2024 for the following segments.

  • Product
    • India pale ale
    • Seasonal craft beer
    • Pale ale
    • Amber ale
    • Others
  • Distribution channel
    • Off-trade
    • On-trade
  • Packaging
    • Cans
    • Bottles
    • Kegs
  • Geography
    • North America
      • US
      • Canada
      • Mexico
    • Europe
      • Germany
      • UK
      • France
      • Spain
      • Italy
      • Belgium
    • APAC
      • China
      • Japan
      • Australia
      • South Korea
      • India
      • New Zealand
    • South America
      • Brazil
      • Argentina
      • Chile
    • Middle East and Africa
      • South Africa
      • Nigeria
      • Egypt
      • Kenya
      • Ethiopia

By Product Insights

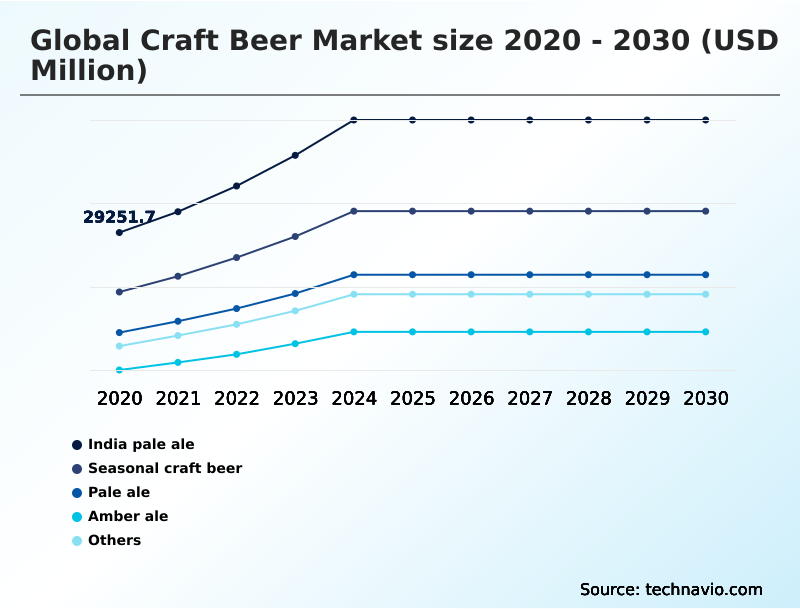
The india pale ale segment is estimated to witness significant growth during the forecast period.

The India pale ale segment continuously drives commercial viability through intense hop-forward formulations and advanced microbrewing techniques, setting it apart from traditional lagers.

Because this segment thrives on continuous product diversification, breweries leverage it to test new dry hopping techniques and specialty malt varieties. The evolving nature of Craft Beer requires continuous refinement to maintain market relevance.

Operationally, standardizing these complex flavor profiles has led to a 15% improvement in fermentation consistency across production cycles.

While pale ales offer broad approachability, India pale ales command stronger consumer loyalty and repeat purchasing behavior within off-trade distribution channels, fundamentally altering how beverage portfolios are managed on a commercial scale.
Get Free Sample

The India pale ale segment was valued at USD 44.26 billion in 2024 and showed a gradual increase during the forecast period.
Get Free Sample

Regional Analysis

North America is estimated to contribute 39.1% to the growth of the global market during the forecast period.Technavio’s analysts have elaborately explained the regional trends and drivers that shape the market during the forecast period.
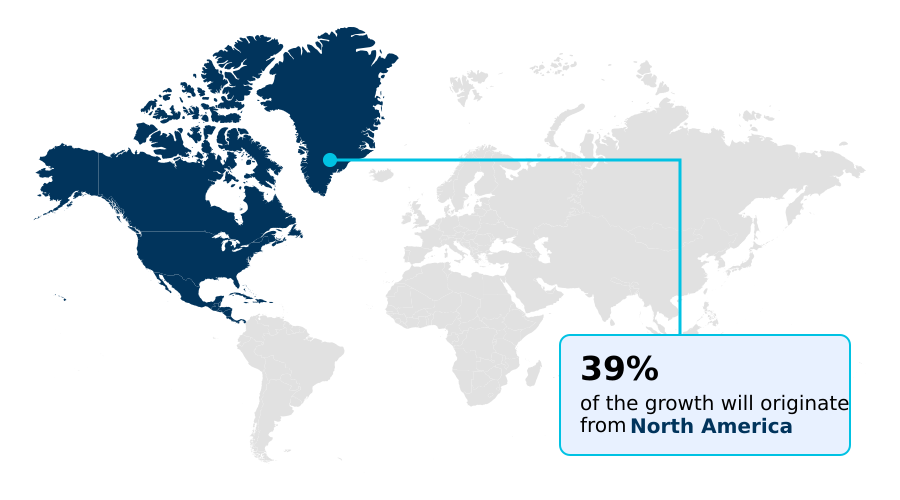
See How Craft Beer Market Demand is Rising in North America Get Free Sample

The geographic landscape of the Craft Beer market demonstrates significant variations in consumer adoption and supply chain maturity.

North America leads the transition with an advanced network of brewery taproom operations, achieving a 25% higher market penetration rate compared to Europe. This discrepancy stems from consumers heavily favoring limited-release product portfolios and direct-to-consumer digital channels, which streamline distribution.

In contrast, European businesses emphasize traditional brewing heritage and on-trade hospitality networks, leading to a 15% reduction in outbound logistics costs due to localized consumption models.

As independent brewery scaling continues, companies in both regions are adopting sustainable packaging materials to align with stricter environmental compliances, yielding a 10% improvement in overall packaging efficiency.

These structural differences require producers to adapt their strategies, ensuring that operations match localized demand.

Market Dynamics

Our researchers analyzed the data with 2025 as the base year, along with the key drivers, trends, and challenges. A holistic analysis of drivers will help companies refine their marketing strategies to gain a competitive advantage.

  • The evolution of the Craft Beer market is heavily influenced by the adoption of highly specialized operational practices designed to elevate product quality and meet shifting consumer demands. A critical focus for modern breweries is the refinement of small-batch artisanal brewing processes, which enable greater flexibility in recipe development and facilitate rapid response to changing market preferences.
  • By optimizing these localized production runs, operators frequently achieve a 20% reduction in raw material waste compared to high-volume commercial manufacturing lines, directly improving supply chain sustainability and margin retention. Furthermore, the expansion of premium barrel-aged beer production requires meticulous inventory planning and temperature-controlled storage compliance, presenting unique logistical challenges but yielding highly differentiated products that command premium pricing.
  • Simultaneously, shifting health trends have accelerated the demand for advanced dealcoholization for craft beer. Facilities implementing these sophisticated separation systems can remove alcohol while preserving delicate aromatic compounds, satisfying regulatory compliance and expanding market reach. To maintain characteristic bitterness and aroma, brewers are continually enhancing their hop-forward craft beer formulation strategies.
  • This intricate balance of ingredient selection and precise extraction timing ensures that sensory profiles remain consistent, regardless of scale or alcohol content. Ultimately, these targeted business functions allow independent producers to remain competitive, optimize their operational footprints, and deliver the innovative experiences that modern beverage consumers expect.
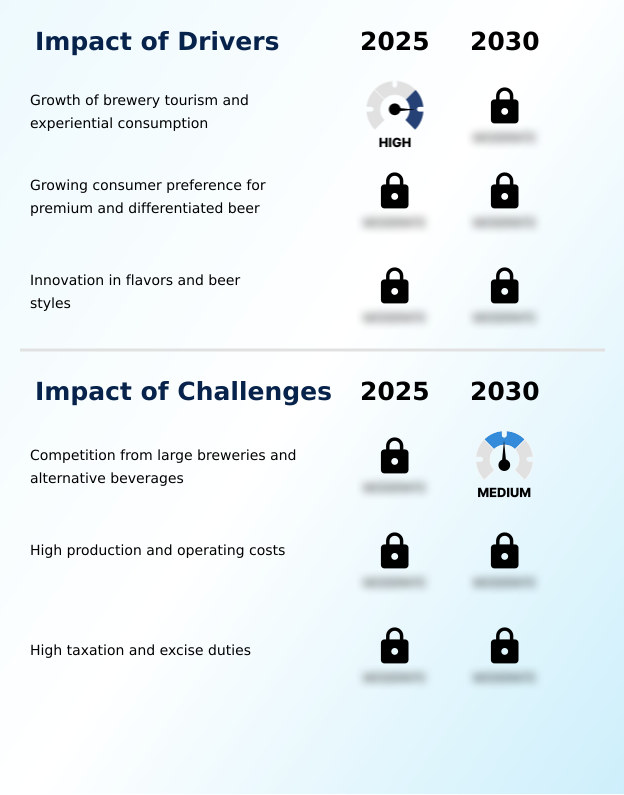
What are the key market drivers leading to the rise in the adoption of Craft Beer Industry?

  • The expansion of brewery tourism and experiential consumption serves as a primary catalyst for market growth.

  • Growing consumer appetite for highly differentiated beverages serves as the primary catalyst propelling the Craft Beer sector. Because modern consumers actively seek novelty, producers are accelerating the rollout of limited-release product portfolios and unique fruit-infused ale brewing techniques.
  • This strategic pivot toward exclusivity drives urgency, resulting in a 20% improvement in inventory sell-through rates during seasonal launches. Furthermore, the strategic integration of local ingredient sourcing allows breweries to mitigate global supply chain disruptions while enhancing product narratives.
  • By utilizing regional agricultural inputs, operators have successfully reduced inbound transportation logistics costs by 14%. To capitalize on these formulations, companies are aggressively expanding craft beer retail visibility to secure optimal shelf placement.
  • This heightened focus on flavor-led beer extensions directly increases commercial resilience and broadens the consumer base.

What are the market trends shaping the Craft Beer Industry?

  • The rising adoption of alcohol-free and low-alcohol craft beers represents a significant upcoming market trend. This shift reflects growing consumer preference for moderation without sacrificing premium taste experiences.

  • The Craft Beer sector is experiencing a rapid shift toward non-alcoholic alternatives and curated hospitality models. This evolution is primarily driven by changing demographic preferences prioritizing health, wellness, and experiential beverage consumption. Consequently, breweries are investing heavily in dealcoholization systems, which have successfully improved flavor retention rates by 18% during the extraction process.
  • By maintaining authentic craft beer sensory profiles, businesses can capture new consumer segments without alienating traditional buyers. Simultaneously, the expansion of brewery event engagement models allows producers to bypass crowded retail shelves, yielding a 25% increase in direct consumer sales margins.
  • To support these diverse offerings, operators are expanding their use of contract brewing services, thereby reducing capital expenditure requirements by 15%. This structural pivot toward wellness and experiential retail enables independent brands to strengthen customer loyalty and secure sustainable revenue streams.

What challenges does the Craft Beer Industry face during its growth?

  • Intense competition from large-scale commercial breweries and alternative beverage categories presents a major challenge to industry expansion.

  • Operational margin compression and intense commercial rivalry present significant structural limitations within the Craft Beer landscape. Because smaller operators lack massive purchasing power, acquiring specialty malt varieties frequently inflates production overhead. This cost disparity directly impacts profitability, forcing producers to optimize craft brewing infrastructure to survive.
  • By implementing rigorous process controls, facilities have successfully lowered overall energy consumption costs by 12%. Additionally, the proliferation of alternative beverages threatens traditional market share, complicating craft beer premiumization strategies. To maintain product integrity, operators must invest heavily in advanced beer preservation characteristics, requiring expensive upgrades to cold-chain logistics.
  • These compounding financial pressures have driven a 15% increase in operational consolidation, as businesses seek to pool resources and overcome the immense financial barriers associated with independent brewery scaling.

Exclusive Technavio Analysis on Customer Landscape

The craft beer market forecasting report includes the adoption lifecycle of the market, covering from the innovator’s stage to the laggard’s stage. It focuses on adoption rates in different regions based on penetration. Furthermore, the craft beer market report also includes key purchase criteria and drivers of price sensitivity to help companies evaluate and develop their market growth analysis strategies.
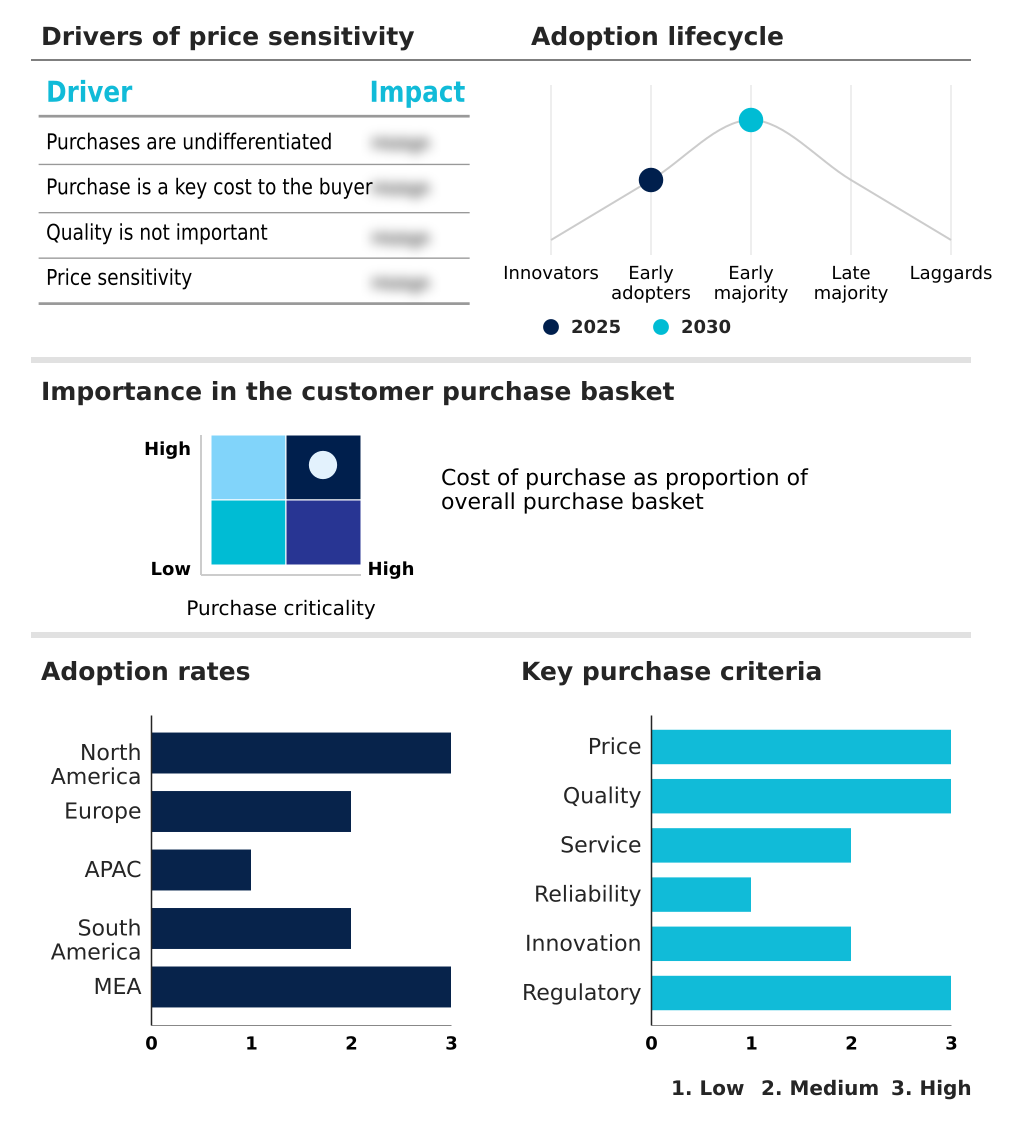
Customer Landscape of Craft Beer Industry

Competitive Landscape

Companies are implementing various strategies, such as strategic alliances, craft beer market forecast, partnerships, mergers and acquisitions, geographical expansion, and product/service launches, to enhance their presence in the industry.

Anheuser Busch InBev SA NV - The portfolio includes premium craft beer selections, featuring distinctive India pale ales and barrel-aged stouts, designed to deliver complex flavor profiles and elevate the consumer tasting experience.

The industry research and growth report includes detailed analyses of the competitive landscape of the market and information about key companies, including:

  • Anheuser Busch InBev SA NV
  • Asahi Group Holdings Ltd.
  • Ballast Point Brewing Co
  • Bells Brewery Inc.
  • BrewDog Plc
  • Carlsberg Breweries AS
  • Constellation Brands Inc.
  • Deschutes Brewery
  • Diageo PLC
  • Feral Brewing Co
  • Firestone Walker Brewing Co
  • Goose Island Beer Co.
  • Heineken NV
  • Kirin Holdings Co. Ltd.
  • New Belgium Brewing Co. Inc.
  • Sierra Nevada Brewing Co.
  • Stone Brewing Co. LLC
  • Suntory Beverage and Food Ltd.
  • The Boston Beer Co. Inc.
  • The Brooklyn Brewery Corp

Qualitative and quantitative analysis of companies has been conducted to help clients understand the wider business environment as well as the strengths and weaknesses of key industry players. Data is qualitatively analyzed to categorize companies as pure play, category-focused, industry-focused, and diversified; it is quantitatively analyzed to categorize companies as dominant, leading, strong, tentative, and weak.

Recent Development and News in Craft beer market

  • In the Brewers industry, the transition toward automated brewing capacity optimization has reduced energy consumption in commercial operations by 12%, directly enabling smaller producers in the Craft Beer market to implement sustainable packaging materials and improve brewery supply chain efficiency.
  • Regulatory shifts enforcing stricter craft beer excise taxation frameworks in Europe have increased compliance overhead by 8%, forcing independent entities within the Craft Beer market to accelerate beverage portfolio diversification and expand contract brewing services to maintain profitability.
  • The widespread integration of advanced dealcoholization systems has improved flavor retention in non-alcoholic beverages by 20%, significantly altering Craft Beer demand as producers rapidly scale craft beer de-alcoholization capabilities to maintain authentic craft beer sensory profiles for wellness-focused consumers.
  • Disruptions in global agricultural supply chains have driven a 15% increase in local ingredient sourcing initiatives, reshaping the Craft Beer landscape as producers increasingly rely on regional flavor profiles and collaborative brewing projects to overcome raw material shortages.

Dive into Technavio’s robust research methodology, blending expert interviews, extensive data synthesis, and validated models for unparalleled Craft Beer Market insights. See full methodology.

Market Scope
Page number 305
Base year 2025
Historic period 2020-2024
Forecast period 2026-2030
Growth momentum & CAGR Accelerate at a CAGR of 8.9%
Market growth 2026-2030 USD 81674.4 million
Market structure Fragmented
YoY growth 2025-2026(%) 8.4%
Key countries US, Canada, Mexico, Germany, UK, France, Spain, Italy, Belgium, China, Japan, Australia, South Korea, India, New Zealand, Brazil, Argentina, Chile, South Africa, Nigeria, Egypt, Kenya and Ethiopia
Competitive landscape Leading Companies, Market Positioning of Companies, Competitive Strategies, and Industry Risks

Request Free Sample

Research Analyst Overview

  • The Craft Beer landscape is undergoing a structural transformation driven by sophisticated production methodologies and shifting consumer palates. Strategic product development increasingly hinges on the mastery of barrel-aging processes, which command premium positioning but require rigorous capital budgeting and inventory forecasting to manage long maturation cycles.
  • Facilities optimizing these cycles through advanced sensory monitoring have achieved a 20% reduction in batch spoilage, directly improving operational yield. Furthermore, the integration of specialized nitro formulations is fundamentally altering mouthfeel expectations, compelling boardrooms to reallocate research budgets toward specialized dispensing infrastructure.
  • The implementation of mixed fermentation methods serves as a key differentiator, allowing producers to create complex, high-margin products that resist commoditization. Simultaneously, the refinement of yeast strain selection provides enhanced fermentation stability across fluctuating environmental conditions. To support these innovations, companies are investing in diverse craft beer packaging formats that maximize shelf life and aesthetic appeal.
  • As producers scale operations, targeted improvements in brewing capacity optimization remain essential for balancing artisanal quality with commercial viability, ensuring that unique flavor profiles consistently meet stringent quality assurance standards.

What are the Key Data Covered in this Craft Beer Market Research and Growth Report?

  • What is the expected growth of the Craft Beer Market between 2026 and 2030?

    • USD 81.67 billion, at a CAGR of 8.9%

  • What segmentation does the market report cover?

    • The report is segmented by Product (India pale ale, Seasonal craft beer, Pale ale, Amber ale, and Others), Distribution Channel (Off-trade, and On-trade), Packaging (Cans, Bottles, and Kegs) and Geography (North America, Europe, APAC, South America, Middle East and Africa)

  • Which regions are analyzed in the report?

    • North America, Europe, APAC, South America and Middle East and Africa

  • What are the key growth drivers and market challenges?

    • Growth of brewery tourism and experiential consumption, Competition from large breweries and alternative beverages

  • Who are the major players in the Craft Beer Market?

    • Anheuser Busch InBev SA NV, Asahi Group Holdings Ltd., Ballast Point Brewing Co, Bells Brewery Inc., BrewDog Plc, Carlsberg Breweries AS, Constellation Brands Inc., Deschutes Brewery, Diageo PLC, Feral Brewing Co, Firestone Walker Brewing Co, Goose Island Beer Co., Heineken NV, Kirin Holdings Co. Ltd., New Belgium Brewing Co. Inc., Sierra Nevada Brewing Co., Stone Brewing Co. LLC, Suntory Beverage and Food Ltd., The Boston Beer Co. Inc. and The Brooklyn Brewery Corp

Market Research Insights

  • The Craft Beer ecosystem requires agile operational strategies to navigate shifting consumer demands and competitive pressures. By optimizing brewery supply chain efficiency, modern producers have accelerated inventory turnover rates by 22%, significantly reducing raw material holding costs.
  • Furthermore, the strategic expansion of direct-to-consumer digital channels has enhanced consumer engagement, resulting in a 30% improvement in customer retention compared to traditional retail models. To mitigate the financial impact of craft beer excise taxation, operators are increasingly leveraging collaborative brewing projects, which optimize shared facility usage and lower overhead expenses by 15%.
  • This operational agility, combined with a strong focus on craft beer tourism, enables independent producers to sustain profitability and deliver authentic brand experiences within a highly dynamic beverage landscape.

We can help! Our analysts can customize this craft beer market research report to meet your requirements.

Get in touch

1. Executive Summary

1.1 Market overview

Executive Summary - Chart on Market Overview
Executive Summary - Data Table on Market Overview
Executive Summary - Chart on Global Market Characteristics
Executive Summary - Chart on Market by Geography
Executive Summary - Chart on Market Segmentation by Product
Executive Summary - Chart on Market Segmentation by Distribution Channel
Executive Summary - Chart on Market Segmentation by Packaging
Executive Summary - Chart on Incremental Growth
Executive Summary - Data Table on Incremental Growth
Executive Summary - Chart on Company Market Positioning

2. Technavio Analysis

2.1 Analysis of price sensitivity, lifecycle, customer purchase basket, adoption rates, and purchase criteria

2.2 Criticality of inputs and Factors of differentiation

Chart on Overview on criticality of inputs and factors of differentiation

2.3 Factors of disruption

Chart on Overview on factors of disruption

2.4 Impact of drivers and challenges

Chart on Impact of drivers and challenges in 2025 and 2030

3. Market Landscape

3.1 Market ecosystem

Chart on Parent Market
Data Table on - Parent Market

3.2 Market characteristics

Chart on Market characteristics analysis

3.3 Value chain analysis

Chart on Value chain analysis

4. Market Sizing

4.1 Market definition

Data Table on Offerings of companies included in the market definition

4.2 Market segment analysis

Market segments

4.3 Market size 2025

4.4 Market outlook: Forecast for 2025-2030

Chart on Global - Market size and forecast 2025-2030 ($ million)
Data Table on Global - Market size and forecast 2025-2030 ($ million)
Chart on Global Market: Year-over-year growth 2025-2030 (%)
Data Table on Global Market: Year-over-year growth 2025-2030 (%)

5. Historic Market Size

5.1 Global Craft Beer Market 2020 - 2024

Historic Market Size - Data Table on Global Craft Beer Market 2020 - 2024 ($ million)

5.2 Product segment analysis 2020 - 2024

Historic Market Size - Product Segment 2020 - 2024 ($ million)

5.3 Distribution Channel segment analysis 2020 - 2024

Historic Market Size - Distribution Channel Segment 2020 - 2024 ($ million)

5.4 Packaging segment analysis 2020 - 2024

Historic Market Size - Packaging Segment 2020 - 2024 ($ million)

5.5 Geography segment analysis 2020 - 2024

Historic Market Size - Geography Segment 2020 - 2024 ($ million)

5.6 Country segment analysis 2020 - 2024

Historic Market Size - Country Segment 2020 - 2024 ($ million)

6. Qualitative Analysis

6.1 Impact of AI on global craft beer market

6.2 Impact of geopolitical conflicts on global craft beer market

7. Five Forces Analysis

7.1 Five forces summary

Five forces analysis - Comparison between 2025 and 2030

7.2 Bargaining power of buyers

Bargaining power of buyers - Impact of key factors 2025 and 2030

7.3 Bargaining power of suppliers

Bargaining power of suppliers - Impact of key factors in 2025 and 2030

7.4 Threat of new entrants

Threat of new entrants - Impact of key factors in 2025 and 2030

7.5 Threat of substitutes

Threat of substitutes - Impact of key factors in 2025 and 2030

7.6 Threat of rivalry

Threat of rivalry - Impact of key factors in 2025 and 2030

7.7 Market condition

Chart on Market condition - Five forces 2025 and 2030

8. Market Segmentation by Product

8.1 Market segments

Chart on Product - Market share 2025-2030 (%)
Data Table on Product - Market share 2025-2030 (%)

8.2 Comparison by Product

Chart on Comparison by Product
Data Table on Comparison by Product

8.3 India pale ale - Market size and forecast 2025-2030

Chart on India pale ale - Market size and forecast 2025-2030 ($ million)
Data Table on India pale ale - Market size and forecast 2025-2030 ($ million)
Chart on India pale ale - Year-over-year growth 2025-2030 (%)
Data Table on India pale ale - Year-over-year growth 2025-2030 (%)

8.4 Seasonal craft beer - Market size and forecast 2025-2030

Chart on Seasonal craft beer - Market size and forecast 2025-2030 ($ million)
Data Table on Seasonal craft beer - Market size and forecast 2025-2030 ($ million)
Chart on Seasonal craft beer - Year-over-year growth 2025-2030 (%)
Data Table on Seasonal craft beer - Year-over-year growth 2025-2030 (%)

8.5 Pale ale - Market size and forecast 2025-2030

Chart on Pale ale - Market size and forecast 2025-2030 ($ million)
Data Table on Pale ale - Market size and forecast 2025-2030 ($ million)
Chart on Pale ale - Year-over-year growth 2025-2030 (%)
Data Table on Pale ale - Year-over-year growth 2025-2030 (%)

8.6 Amber ale - Market size and forecast 2025-2030

Chart on Amber ale - Market size and forecast 2025-2030 ($ million)
Data Table on Amber ale - Market size and forecast 2025-2030 ($ million)
Chart on Amber ale - Year-over-year growth 2025-2030 (%)
Data Table on Amber ale - Year-over-year growth 2025-2030 (%)

8.7 Others - Market size and forecast 2025-2030

Chart on Others - Market size and forecast 2025-2030 ($ million)
Data Table on Others - Market size and forecast 2025-2030 ($ million)
Chart on Others - Year-over-year growth 2025-2030 (%)
Data Table on Others - Year-over-year growth 2025-2030 (%)

8.8 Market opportunity by Product

Market opportunity by Product ($ million)
Data Table on Market opportunity by Product ($ million)

9. Market Segmentation by Distribution Channel

9.1 Market segments

Chart on Distribution Channel - Market share 2025-2030 (%)
Data Table on Distribution Channel - Market share 2025-2030 (%)

9.2 Comparison by Distribution Channel

Chart on Comparison by Distribution Channel
Data Table on Comparison by Distribution Channel

9.3 Off-trade - Market size and forecast 2025-2030

Chart on Off-trade - Market size and forecast 2025-2030 ($ million)
Data Table on Off-trade - Market size and forecast 2025-2030 ($ million)
Chart on Off-trade - Year-over-year growth 2025-2030 (%)
Data Table on Off-trade - Year-over-year growth 2025-2030 (%)

9.4 On-trade - Market size and forecast 2025-2030

Chart on On-trade - Market size and forecast 2025-2030 ($ million)
Data Table on On-trade - Market size and forecast 2025-2030 ($ million)
Chart on On-trade - Year-over-year growth 2025-2030 (%)
Data Table on On-trade - Year-over-year growth 2025-2030 (%)

9.5 Market opportunity by Distribution Channel

Market opportunity by Distribution Channel ($ million)
Data Table on Market opportunity by Distribution Channel ($ million)

10. Market Segmentation by Packaging

10.1 Market segments

Chart on Packaging - Market share 2025-2030 (%)
Data Table on Packaging - Market share 2025-2030 (%)

10.2 Comparison by Packaging

Chart on Comparison by Packaging
Data Table on Comparison by Packaging

10.3 Cans - Market size and forecast 2025-2030

Chart on Cans - Market size and forecast 2025-2030 ($ million)
Data Table on Cans - Market size and forecast 2025-2030 ($ million)
Chart on Cans - Year-over-year growth 2025-2030 (%)
Data Table on Cans - Year-over-year growth 2025-2030 (%)

10.4 Bottles - Market size and forecast 2025-2030

Chart on Bottles - Market size and forecast 2025-2030 ($ million)
Data Table on Bottles - Market size and forecast 2025-2030 ($ million)
Chart on Bottles - Year-over-year growth 2025-2030 (%)
Data Table on Bottles - Year-over-year growth 2025-2030 (%)

10.5 Kegs - Market size and forecast 2025-2030

Chart on Kegs - Market size and forecast 2025-2030 ($ million)
Data Table on Kegs - Market size and forecast 2025-2030 ($ million)
Chart on Kegs - Year-over-year growth 2025-2030 (%)
Data Table on Kegs - Year-over-year growth 2025-2030 (%)

10.6 Market opportunity by Packaging

Market opportunity by Packaging ($ million)
Data Table on Market opportunity by Packaging ($ million)

11. Customer Landscape

11.1 Customer landscape overview

Analysis of price sensitivity, lifecycle, customer purchase basket, adoption rates, and purchase criteria

12. Geographic Landscape

12.1 Geographic segmentation

Chart on Market share by geography 2025-2030 (%)
Data Table on Market share by geography 2025-2030 (%)

12.2 Geographic comparison

Chart on Geographic comparison
Data Table on Geographic comparison

12.3 North America - Market size and forecast 2025-2030

Chart on North America - Market size and forecast 2025-2030 ($ million)
Data Table on North America - Market size and forecast 2025-2030 ($ million)
Chart on North America - Year-over-year growth 2025-2030 (%)
Data Table on North America - Year-over-year growth 2025-2030 (%)
Chart on Regional Comparison - North America
Data Table on Regional Comparison - North America

12.3.1 US - Market size and forecast 2025-2030

Chart on US - Market size and forecast 2025-2030 ($ million)
Data Table on US - Market size and forecast 2025-2030 ($ million)
Chart on US - Year-over-year growth 2025-2030 (%)
Data Table on US - Year-over-year growth 2025-2030 (%)

12.3.2 Canada - Market size and forecast 2025-2030

Chart on Canada - Market size and forecast 2025-2030 ($ million)
Data Table on Canada - Market size and forecast 2025-2030 ($ million)
Chart on Canada - Year-over-year growth 2025-2030 (%)
Data Table on Canada - Year-over-year growth 2025-2030 (%)

12.3.3 Mexico - Market size and forecast 2025-2030

Chart on Mexico - Market size and forecast 2025-2030 ($ million)
Data Table on Mexico - Market size and forecast 2025-2030 ($ million)
Chart on Mexico - Year-over-year growth 2025-2030 (%)
Data Table on Mexico - Year-over-year growth 2025-2030 (%)

12.4 Europe - Market size and forecast 2025-2030

Chart on Europe - Market size and forecast 2025-2030 ($ million)
Data Table on Europe - Market size and forecast 2025-2030 ($ million)
Chart on Europe - Year-over-year growth 2025-2030 (%)
Data Table on Europe - Year-over-year growth 2025-2030 (%)
Chart on Regional Comparison - Europe
Data Table on Regional Comparison - Europe

12.4.1 Germany - Market size and forecast 2025-2030

Chart on Germany - Market size and forecast 2025-2030 ($ million)
Data Table on Germany - Market size and forecast 2025-2030 ($ million)
Chart on Germany - Year-over-year growth 2025-2030 (%)
Data Table on Germany - Year-over-year growth 2025-2030 (%)

12.4.2 UK - Market size and forecast 2025-2030

Chart on UK - Market size and forecast 2025-2030 ($ million)
Data Table on UK - Market size and forecast 2025-2030 ($ million)
Chart on UK - Year-over-year growth 2025-2030 (%)
Data Table on UK - Year-over-year growth 2025-2030 (%)

12.4.3 France - Market size and forecast 2025-2030

Chart on France - Market size and forecast 2025-2030 ($ million)
Data Table on France - Market size and forecast 2025-2030 ($ million)
Chart on France - Year-over-year growth 2025-2030 (%)
Data Table on France - Year-over-year growth 2025-2030 (%)

12.4.4 Spain - Market size and forecast 2025-2030

Chart on Spain - Market size and forecast 2025-2030 ($ million)
Data Table on Spain - Market size and forecast 2025-2030 ($ million)
Chart on Spain - Year-over-year growth 2025-2030 (%)
Data Table on Spain - Year-over-year growth 2025-2030 (%)

12.4.5 Italy - Market size and forecast 2025-2030

Chart on Italy - Market size and forecast 2025-2030 ($ million)
Data Table on Italy - Market size and forecast 2025-2030 ($ million)
Chart on Italy - Year-over-year growth 2025-2030 (%)
Data Table on Italy - Year-over-year growth 2025-2030 (%)

12.4.6 Belgium - Market size and forecast 2025-2030

Chart on Belgium - Market size and forecast 2025-2030 ($ million)
Data Table on Belgium - Market size and forecast 2025-2030 ($ million)
Chart on Belgium - Year-over-year growth 2025-2030 (%)
Data Table on Belgium - Year-over-year growth 2025-2030 (%)

12.5 APAC - Market size and forecast 2025-2030

Chart on APAC - Market size and forecast 2025-2030 ($ million)
Data Table on APAC - Market size and forecast 2025-2030 ($ million)
Chart on APAC - Year-over-year growth 2025-2030 (%)
Data Table on APAC - Year-over-year growth 2025-2030 (%)
Chart on Regional Comparison - APAC
Data Table on Regional Comparison - APAC

12.5.1 China - Market size and forecast 2025-2030

Chart on China - Market size and forecast 2025-2030 ($ million)
Data Table on China - Market size and forecast 2025-2030 ($ million)
Chart on China - Year-over-year growth 2025-2030 (%)
Data Table on China - Year-over-year growth 2025-2030 (%)

12.5.2 Japan - Market size and forecast 2025-2030

Chart on Japan - Market size and forecast 2025-2030 ($ million)
Data Table on Japan - Market size and forecast 2025-2030 ($ million)
Chart on Japan - Year-over-year growth 2025-2030 (%)
Data Table on Japan - Year-over-year growth 2025-2030 (%)

12.5.3 Australia - Market size and forecast 2025-2030

Chart on Australia - Market size and forecast 2025-2030 ($ million)
Data Table on Australia - Market size and forecast 2025-2030 ($ million)
Chart on Australia - Year-over-year growth 2025-2030 (%)
Data Table on Australia - Year-over-year growth 2025-2030 (%)

12.5.4 South Korea - Market size and forecast 2025-2030

Chart on South Korea - Market size and forecast 2025-2030 ($ million)
Data Table on South Korea - Market size and forecast 2025-2030 ($ million)
Chart on South Korea - Year-over-year growth 2025-2030 (%)
Data Table on South Korea - Year-over-year growth 2025-2030 (%)

12.5.5 India - Market size and forecast 2025-2030

Chart on India - Market size and forecast 2025-2030 ($ million)
Data Table on India - Market size and forecast 2025-2030 ($ million)
Chart on India - Year-over-year growth 2025-2030 (%)
Data Table on India - Year-over-year growth 2025-2030 (%)

12.5.6 New Zealand - Market size and forecast 2025-2030

Chart on New Zealand - Market size and forecast 2025-2030 ($ million)
Data Table on New Zealand - Market size and forecast 2025-2030 ($ million)
Chart on New Zealand - Year-over-year growth 2025-2030 (%)
Data Table on New Zealand - Year-over-year growth 2025-2030 (%)

12.6 South America - Market size and forecast 2025-2030

Chart on South America - Market size and forecast 2025-2030 ($ million)
Data Table on South America - Market size and forecast 2025-2030 ($ million)
Chart on South America - Year-over-year growth 2025-2030 (%)
Data Table on South America - Year-over-year growth 2025-2030 (%)
Chart on Regional Comparison - South America
Data Table on Regional Comparison - South America

12.6.1 Brazil - Market size and forecast 2025-2030

Chart on Brazil - Market size and forecast 2025-2030 ($ million)
Data Table on Brazil - Market size and forecast 2025-2030 ($ million)
Chart on Brazil - Year-over-year growth 2025-2030 (%)
Data Table on Brazil - Year-over-year growth 2025-2030 (%)

12.6.2 Argentina - Market size and forecast 2025-2030

Chart on Argentina - Market size and forecast 2025-2030 ($ million)
Data Table on Argentina - Market size and forecast 2025-2030 ($ million)
Chart on Argentina - Year-over-year growth 2025-2030 (%)
Data Table on Argentina - Year-over-year growth 2025-2030 (%)

12.6.3 Chile - Market size and forecast 2025-2030

Chart on Chile - Market size and forecast 2025-2030 ($ million)
Data Table on Chile - Market size and forecast 2025-2030 ($ million)
Chart on Chile - Year-over-year growth 2025-2030 (%)
Data Table on Chile - Year-over-year growth 2025-2030 (%)

12.7 Middle East and Africa - Market size and forecast 2025-2030

Chart on Middle East and Africa - Market size and forecast 2025-2030 ($ million)
Data Table on Middle East and Africa - Market size and forecast 2025-2030 ($ million)
Chart on Middle East and Africa - Year-over-year growth 2025-2030 (%)
Data Table on Middle East and Africa - Year-over-year growth 2025-2030 (%)
Chart on Regional Comparison - Middle East and Africa
Data Table on Regional Comparison - Middle East and Africa

12.7.1 South Africa - Market size and forecast 2025-2030

Chart on South Africa - Market size and forecast 2025-2030 ($ million)
Data Table on South Africa - Market size and forecast 2025-2030 ($ million)
Chart on South Africa - Year-over-year growth 2025-2030 (%)
Data Table on South Africa - Year-over-year growth 2025-2030 (%)

12.7.2 Nigeria - Market size and forecast 2025-2030

Chart on Nigeria - Market size and forecast 2025-2030 ($ million)
Data Table on Nigeria - Market size and forecast 2025-2030 ($ million)
Chart on Nigeria - Year-over-year growth 2025-2030 (%)
Data Table on Nigeria - Year-over-year growth 2025-2030 (%)

12.7.3 Egypt - Market size and forecast 2025-2030

Chart on Egypt - Market size and forecast 2025-2030 ($ million)
Data Table on Egypt - Market size and forecast 2025-2030 ($ million)
Chart on Egypt - Year-over-year growth 2025-2030 (%)
Data Table on Egypt - Year-over-year growth 2025-2030 (%)

12.7.4 Kenya - Market size and forecast 2025-2030

Chart on Kenya - Market size and forecast 2025-2030 ($ million)
Data Table on Kenya - Market size and forecast 2025-2030 ($ million)
Chart on Kenya - Year-over-year growth 2025-2030 (%)
Data Table on Kenya - Year-over-year growth 2025-2030 (%)

12.7.5 Ethiopia - Market size and forecast 2025-2030

Chart on Ethiopia - Market size and forecast 2025-2030 ($ million)
Data Table on Ethiopia - Market size and forecast 2025-2030 ($ million)
Chart on Ethiopia - Year-over-year growth 2025-2030 (%)
Data Table on Ethiopia - Year-over-year growth 2025-2030 (%)

12.8 Market opportunity by geography

Market opportunity by geography ($ million)
Data Tables on Market opportunity by geography ($ million)

13. Drivers, Challenges, and Opportunity

13.1 Market drivers

Growth of brewery tourism and experiential consumption
Growing consumer preference for premium and differentiated beer
Innovation in flavors and beer styles

13.2 Market challenges

Competition from large breweries and alternative beverages
High production and operating costs
High taxation and excise duties

13.3 Impact of drivers and challenges

Impact of drivers and challenges in 2025 and 2030

13.4 Market opportunities

Rise of alcohol free and low alcohol craft beers
Premiumization through specialty ingredients and limited releases
Growth of digital commerce and direct consumer engagement

14. Competitive Landscape

14.1 Overview

14.2

Overview on criticality of inputs and factors of differentiation

14.3 Landscape disruption

Overview on factors of disruption

14.4 Industry risks

Impact of key risks on business

15. Competitive Analysis

15.1 Companies profiled

Companies covered

15.2 Company ranking index

15.3 Market positioning of companies

Matrix on companies position and classification

15.4 Anheuser Busch InBev SA NV

Anheuser Busch InBev SA NV - Overview
Anheuser Busch InBev SA NV - Business segments
Anheuser Busch InBev SA NV - Key offerings
Anheuser Busch InBev SA NV - Segment focus
SWOT

15.5 Asahi Group Holdings Ltd.

Asahi Group Holdings Ltd. - Overview
Asahi Group Holdings Ltd. - Business segments
Asahi Group Holdings Ltd. - Key offerings
Asahi Group Holdings Ltd. - Segment focus
SWOT

15.6 Ballast Point Brewing Co

Ballast Point Brewing Co - Overview
Ballast Point Brewing Co - Product / Service
Ballast Point Brewing Co - Key offerings
SWOT

15.7 BrewDog Plc

BrewDog Plc - Overview
BrewDog Plc - Product / Service
BrewDog Plc - Key offerings
SWOT

15.8 Carlsberg Breweries AS

Carlsberg Breweries AS - Overview
Carlsberg Breweries AS - Business segments
Carlsberg Breweries AS - Key news
Carlsberg Breweries AS - Key offerings
Carlsberg Breweries AS - Segment focus
SWOT

15.9 Constellation Brands Inc.

Constellation Brands Inc. - Overview
Constellation Brands Inc. - Business segments
Constellation Brands Inc. - Key offerings
Constellation Brands Inc. - Segment focus
SWOT

15.10 Diageo PLC

Diageo PLC - Overview
Diageo PLC - Business segments
Diageo PLC - Key offerings
Diageo PLC - Segment focus
SWOT

15.11 Goose Island Beer Co.

Goose Island Beer Co. - Overview
Goose Island Beer Co. - Product / Service
Goose Island Beer Co. - Key offerings
SWOT

15.12 Heineken NV

Heineken NV - Overview
Heineken NV - Business segments
Heineken NV - Key offerings
Heineken NV - Segment focus
SWOT

15.13 Kirin Holdings Co. Ltd.

Kirin Holdings Co. Ltd. - Overview
Kirin Holdings Co. Ltd. - Business segments
Kirin Holdings Co. Ltd. - Key offerings
Kirin Holdings Co. Ltd. - Segment focus
SWOT

15.14 New Belgium Brewing Co. Inc.

New Belgium Brewing Co. Inc. - Overview
New Belgium Brewing Co. Inc. - Product / Service
New Belgium Brewing Co. Inc. - Key offerings
SWOT

15.15 Sierra Nevada Brewing Co.

Sierra Nevada Brewing Co. - Overview
Sierra Nevada Brewing Co. - Product / Service
Sierra Nevada Brewing Co. - Key offerings
SWOT

15.16 Stone Brewing Co. LLC

Stone Brewing Co. LLC - Overview
Stone Brewing Co. LLC - Product / Service
Stone Brewing Co. LLC - Key offerings
SWOT

15.17 Suntory Beverage and Food Ltd.

Suntory Beverage and Food Ltd. - Overview
Suntory Beverage and Food Ltd. - Business segments
Suntory Beverage and Food Ltd. - Key offerings
Suntory Beverage and Food Ltd. - Segment focus
SWOT

15.18 The Boston Beer Co. Inc.

The Boston Beer Co. Inc. - Overview
The Boston Beer Co. Inc. - Product / Service
The Boston Beer Co. Inc. - Key offerings
SWOT

16. Appendix

16.1 Scope of the report

Market definition
Objectives
Notes and caveats

16.2 Inclusions and exclusions checklist

Inclusions checklist
Exclusions checklist

16.3 Currency conversion rates for US$

16.4 Research methodology

16.5 Data procurement

Information sources

16.6 Data validation

16.7 Validation techniques employed for market sizing

16.8 Data synthesis

16.9 360 degree market analysis

16.10 List of abbreviations

Research Methodology

Technavio presents a detailed picture of the market by way of study, synthesis, and summation of data from multiple sources. The analysts have presented the various facets of the market with a particular focus on identifying the key industry influencers. The data thus presented is comprehensive, reliable, and the result of extensive research, both primary and secondary.

INFORMATION SOURCES

Primary sources

  • Manufacturers and suppliers
  • Channel partners
  • Industry experts
  • Strategic decision makers

Secondary sources

  • Industry journals and periodicals
  • Government data
  • Financial reports of key industry players
  • Historical data
  • Press releases

DATA ANALYSIS

Data Synthesis

  • Collation of data
  • Estimation of key figures
  • Analysis of derived insights

Data Validation

  • Triangulation with data models
  • Reference against proprietary databases
  • Corroboration with industry experts

REPORT WRITING

Qualitative

  • Market drivers
  • Market challenges
  • Market trends
  • Five forces analysis

Quantitative

  • Market size and forecast
  • Market segmentation
  • Geographical insights
  • Competitive landscape

Interested in this report?

Get your sample now to see our research methodology and insights!

Download Now

Frequently Asked Questions

Craft Beer market growth will increase by USD 81674.4 million during 2026-2030.

The Craft Beer market is expected to grow at a CAGR of 8.9% during 2026-2030.

Craft Beer market is segmented by Product (India pale ale, Seasonal craft beer, Pale ale, Amber ale, Others) Distribution channel (Off-trade, On-trade) Packaging (Cans, Bottles, Kegs)

Anheuser Busch InBev SA NV, Asahi Group Holdings Ltd., Ballast Point Brewing Co, Bells Brewery Inc., BrewDog Plc, Carlsberg Breweries AS, Constellation Brands Inc., Deschutes Brewery, Diageo PLC, Feral Brewing Co, Firestone Walker Brewing Co, Goose Island Beer Co., Heineken NV, Kirin Holdings Co. Ltd., New Belgium Brewing Co. Inc., Sierra Nevada Brewing Co., Stone Brewing Co. LLC, Suntory Beverage and Food Ltd., The Boston Beer Co. Inc., The Brooklyn Brewery Corp are a few of the key vendors in the Craft Beer market.

North America will register the highest growth rate of 39.1% among the other regions. Therefore, the Craft Beer market in North America is expected to garner significant business opportunities for the vendors during the forecast period.

US, Canada, Mexico, Germany, UK, France, Spain, Italy, Belgium, China, Japan, Australia, South Korea, India, New Zealand, Brazil, Argentina, Chile, South Africa, Nigeria, Egypt, Kenya, Ethiopia

  • Growth of brewery tourism and experiential consumption is the driving factor this market.

The Craft Beer market vendors should focus on grabbing business opportunities from the Product segment as it accounted for the largest market share in the base year.
RIA - Research AI Assistant
Ask RIA
