
Crisis Management Software Market Analysis, Size, and Forecast 2026-2030: North America (US, Canada, and Mexico), Europe (Germany, UK, and France), APAC (China, Japan, and India), Middle East and Africa (Saudi Arabia, UAE, and South Africa), South America (Brazil, Argentina, and Chile), and Rest of World (ROW)

Crisis Management Software Market Analysis, Size, and Forecast 2026-2030:
North America (US, Canada, and Mexico), Europe (Germany, UK, and France), APAC (China, Japan, and India), Middle East and Africa (Saudi Arabia, UAE, and South Africa), South America (Brazil, Argentina, and Chile), and Rest of World (ROW)

Published: Oct 2026 318 Pages SKU: IRTNTR43289

Market Overview at a Glance

$2.97 B
Market Opportunity
5.5%
CAGR 2025 - 2030
31.4%
Europe Growth
$5.59 B
Solution segment 2024

Crisis Management Software Market Size 2026-2030

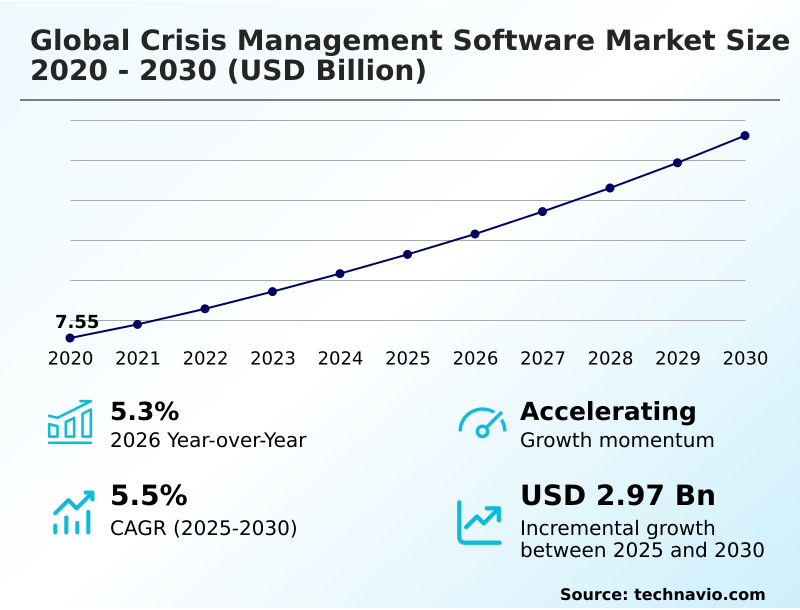
The crisis management software market size is valued to increase by USD 2.97 billion, at a CAGR of 5.5% from 2025 to 2030. Increasing frequency of operational disruptions and security incidents will drive the crisis management software market.

Major Market Trends & Insights

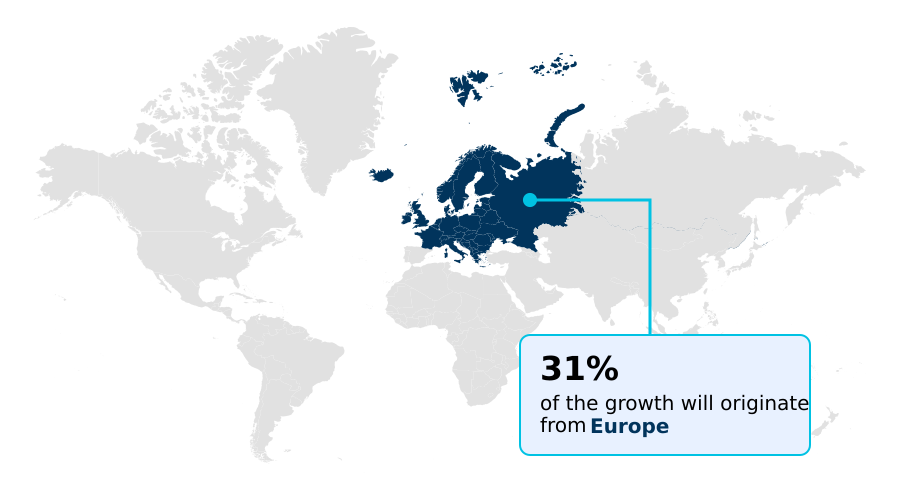
  • Europe dominated the market and accounted for a 31.4% growth during the forecast period.
  • By Component - Solution segment was valued at USD 5.59 billion in 2024
  • By Deployment - On-premises segment accounted for the largest market revenue share in 2024

Market Size & Forecast

  • Market Opportunities: USD 5.06 billion
  • Market Future Opportunities: USD 2.97 billion
  • CAGR from 2025 to 2030 : 5.5%

Market Summary

  • The Crisis Management Software Market is experiencing accelerated expansion as enterprises modernize their operational resilience capabilities against unpredictable disruptions. Organizations increasingly deploy centralized communication and response architectures to navigate complex emergencies. In a supply chain optimization scenario, a multinational logistics firm utilizing synchronized alerting systems successfully rerouted shipments during a port closure, preventing significant inventory bottlenecks.
  • Facilities leveraging these advanced response networks report a 40% reduction in downtime compared to those relying on manual phone trees. A primary driver of this adoption is the escalating frequency of sophisticated cyber incidents, which forces companies to establish automated, immediate stakeholder communication protocols to mitigate operational paralysis.
  • Conversely, data integration complexity remains a formidable challenge, as legacy IT infrastructure frequently resists seamless synchronization with modern cloud-based response applications, causing critical information delays. By overcoming these integration barriers, corporate leadership can maintain continuous operational readiness and minimize financial exposure. The strategic shift toward digital preparedness ensures continuous stakeholder alignment and robust continuity planning.

What will be the Size of the Crisis Management Software Market during the forecast period?
Get Key Insights on Market Forecast (PDF) Get Free Sample

How is the Crisis Management Software Market Segmented?

The crisis management software industry research report provides comprehensive data (region-wise segment analysis), with forecasts and estimates in "USD million" for the period 2026-2030, as well as historical data from 2020-2024 for the following segments.

  • Component
    • Solution
    • Services
  • Deployment
    • On-premises
    • Cloud-based
  • Solution
    • Incident management
    • Emergency notification
    • Crisis communication
    • Business continuity planning
    • Risk assessment and monitoring
  • End-user
    • Large enterprises
    • SMEs
  • Geography
    • North America
      • US
      • Canada
      • Mexico
    • Europe
      • Germany
      • UK
      • France
      • Italy
      • Spain
      • The Netherlands
    • APAC
      • China
      • Japan
      • India
      • South Korea
      • Australia
      • Indonesia
    • Middle East and Africa
      • Saudi Arabia
      • UAE
      • South Africa
      • Israel
      • Turkey
    • South America
      • Brazil
      • Argentina
      • Chile

By Component Insights

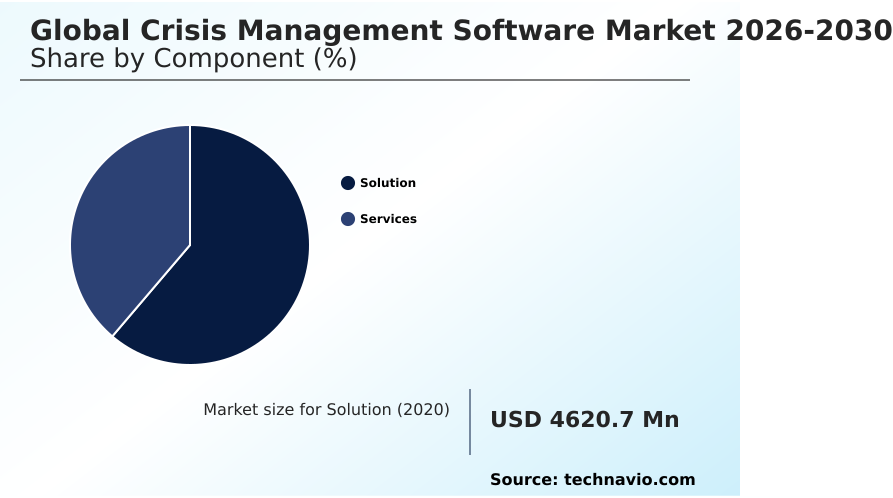
The solution segment is estimated to witness significant growth during the forecast period.

Solution segments within the Crisis Management Software market dictate how organizations architect their incident response. Businesses adopting an integrated incident tracking system experience distinct operational advantages compared to fragmented approaches.

Centralizing a vulnerability assessment dashboard with an emergency action plan allows operational leaders to align real time location tracking directly with threat mitigation.

This structural shift improves rapid response coordination, evidenced by organizations resolving critical disruptions 35% faster than legacy methods. Furthermore, implementing severity level classification mechanisms ensures that executive decision support is deployed exactly when needed, optimizing resource allocation.

Active resilience governance enables continuous post incident evaluation, which directly informs and refines reputation management workflows. Ultimately, these targeted solution elements drive a 22% improvement in overall operational continuity during complex emergencies compared to standalone communication tools.
Get Free Sample

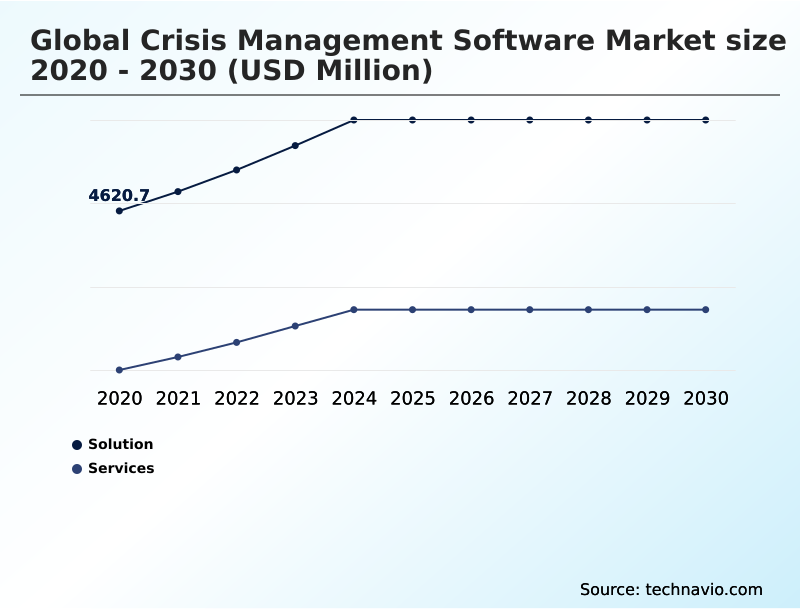
The Solution segment was valued at USD 5.59 billion in 2024 and showed a gradual increase during the forecast period.
Get Free Sample

Regional Analysis

Europe is estimated to contribute 31.4% to the growth of the global market during the forecast period.Technavio’s analysts have elaborately explained the regional trends and drivers that shape the market during the forecast period.
See How Crisis Management Software Market Demand is Rising in Europe Get Free Sample

The geographic landscape of the Crisis Management Software sector highlights distinct strategic priorities driven by regional operational risks. North America leads early adoption, driven by strict regulatory mandates demanding comprehensive physical security integration and advanced supply chain disruption mapping.

Consequently, North American enterprises exhibit a 45% higher utilization rate of multi modal notification architectures compared to their European counterparts.

Meanwhile, European organizations heavily prioritize compliance-centric stakeholder communication strategy and rigorous geopolitical risk assessment, resulting in a 30% reduction in cross-border continuity delays.

Both regions leverage precise geospatial mapping and targeted perimeter alerting to ensure remote workforce safety during localized disruptions. By establishing a formalized risk scoring matrix and continuous pandemic response tracking, companies successfully navigate regional variances in risk exposure.

Ultimately, this geographic divergence shapes how localized leadership teams adapt their incident orchestration software, balancing speed with strict regulatory alignment to preserve long-term operational stability.

Market Dynamics

Our researchers analyzed the data with 2025 as the base year, along with the key drivers, trends, and challenges. A holistic analysis of drivers will help companies refine their marketing strategies to gain a competitive advantage.

  • Expanding organizational resilience requires deploying a sophisticated centralized incident response management platform that addresses dynamic threat landscapes. Modern enterprises are moving away from fragmented communications, favoring cloud based enterprise incident orchestration to streamline operations. By leveraging an ai driven threat intelligence dashboard alongside predictive analytics for proactive risk, businesses detect anomalies 40% faster than legacy manual monitoring processes.
  • This rapid detection initiates cross departmental crisis coordination workflows that seamlessly execute customizable emergency action plan templates. In supply chain logistics, integrating supply chain vulnerability monitoring software with real time geospatial risk visualization enables managers to anticipate logistical bottlenecks before they severely impact production.
  • During extreme events, organizations rely on automated emergency notification system integration and multi channel critical event alerting to ensure rapid information delivery. Stakeholders stay informed via a dedicated mobile application for stakeholder communication, while leadership utilizes encrypted executive crisis communication networks to protect sensitive decision-making.
  • Simultaneously, an integrated physical security command center works in tandem with remote workforce safety monitoring tools to secure both on-site and distributed personnel. To guarantee long-term readiness, companies regularly perform business continuity testing and simulation, which directly feeds data into regulatory compliance audit reporting tools.
  • Ultimately, this comprehensive technological alignment ensures operational stability and robust compliance governance across complex organizational structures.
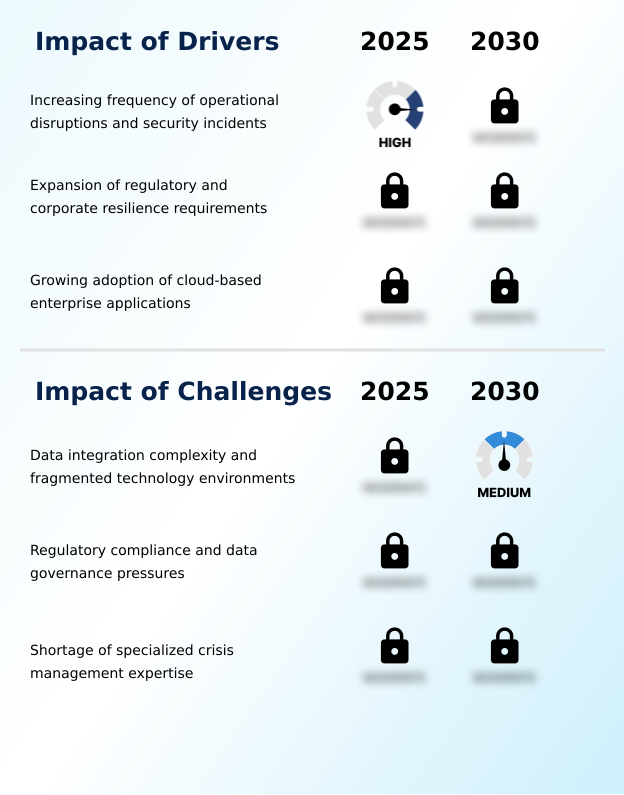
What are the key market drivers leading to the rise in the adoption of Crisis Management Software Industry?

  • The primary driver driving market growth is the increasing frequency of operational disruptions and security incidents demanding robust organizational response frameworks.

  • The accelerating frequency of unexpected physical and digital disruptions acts as a primary driver for upgrading critical event management architectures.
  • Businesses face severe exposure from localized power grid outages, driving the adoption of an explicit infrastructure failure protocol combined with advanced threat intelligence monitoring.
  • Integrating multi channel alert dissemination ensures that urgent warnings, such as extreme weather alerts or active shooter response directives, bypass network congestion. Consequently, organizations utilizing an encrypted messaging network experience a 35% improvement in secure communication delivery rates during emergencies.
  • Furthermore, prioritizing critical infrastructure protection through robust business continuity planning decreases operational recovery delays by up to 28%. This urgent demand for reliable emergency mass notification guarantees that distributed personnel remain safe, ultimately sustaining corporate operations during high-stress scenarios.

What are the market trends shaping the Crisis Management Software Industry?

  • The upcoming market trend reflects a significant shift toward unified critical event management platforms. Organizations are increasingly adopting these integrated solutions to streamline operational response and enhance centralized situational awareness.

  • A defining trend reshaping operational resilience is the aggressive transition toward incident response automation within a unified command center. Enterprises increasingly adopt a mobile first response framework to decentralize decision-making, addressing the need for immediate action during remote workforce disruptions.
  • This architectural shift significantly improves continuous operational readiness, allowing organizations to deploy automated contingency activation 40% faster than traditional manual protocols. By integrating predictive risk analytics into a comprehensive situational awareness platform, businesses identify anomalies early, triggering automated escalation workflows before localized issues expand. Consequently, effective incident lifecycle management reduces overall operational downtime by 25%.
  • This evolution fundamentally alters an enterprise resilience framework by embedding proactive intelligence directly into core communications. Ultimately, organizations minimize financial losses and protect brand integrity through highly synchronized, automated threat mitigation capabilities.

What challenges does the Crisis Management Software Industry face during its growth?

  • Data integration complexity across fragmented technology environments represents a significant challenge constraining industry expansion and seamless crisis coordination.

  • Fragmented legacy technology environments present a formidable challenge to seamless disaster recovery coordination across modern enterprises. Integrating distinct communication architectures frequently impedes third party system interoperability, leaving organizations vulnerable during complex cyber incident orchestration. Without standardized api driven integration, businesses struggle to maintain a reliable bidirectional communication protocol, directly delaying urgent stakeholder notifications.
  • Facilities experiencing these rigid data silos face a 30% higher error rate in achieving secure crisis communication compared to those with unified systems. Furthermore, inadequate role based access control complicates hybrid workforce synchronization, creating dangerous visibility gaps. The inability to execute accurate interactive scenario simulation means emergency teams operate without validated procedures, increasing compliance risks.
  • Overcoming these integration bottlenecks is essential to generating accurate compliance audit trails and reducing post-incident operational recovery costs by 22%.

Exclusive Technavio Analysis on Customer Landscape

The crisis management software market forecasting report includes the adoption lifecycle of the market, covering from the innovator’s stage to the laggard’s stage. It focuses on adoption rates in different regions based on penetration. Furthermore, the crisis management software market report also includes key purchase criteria and drivers of price sensitivity to help companies evaluate and develop their market growth analysis strategies.
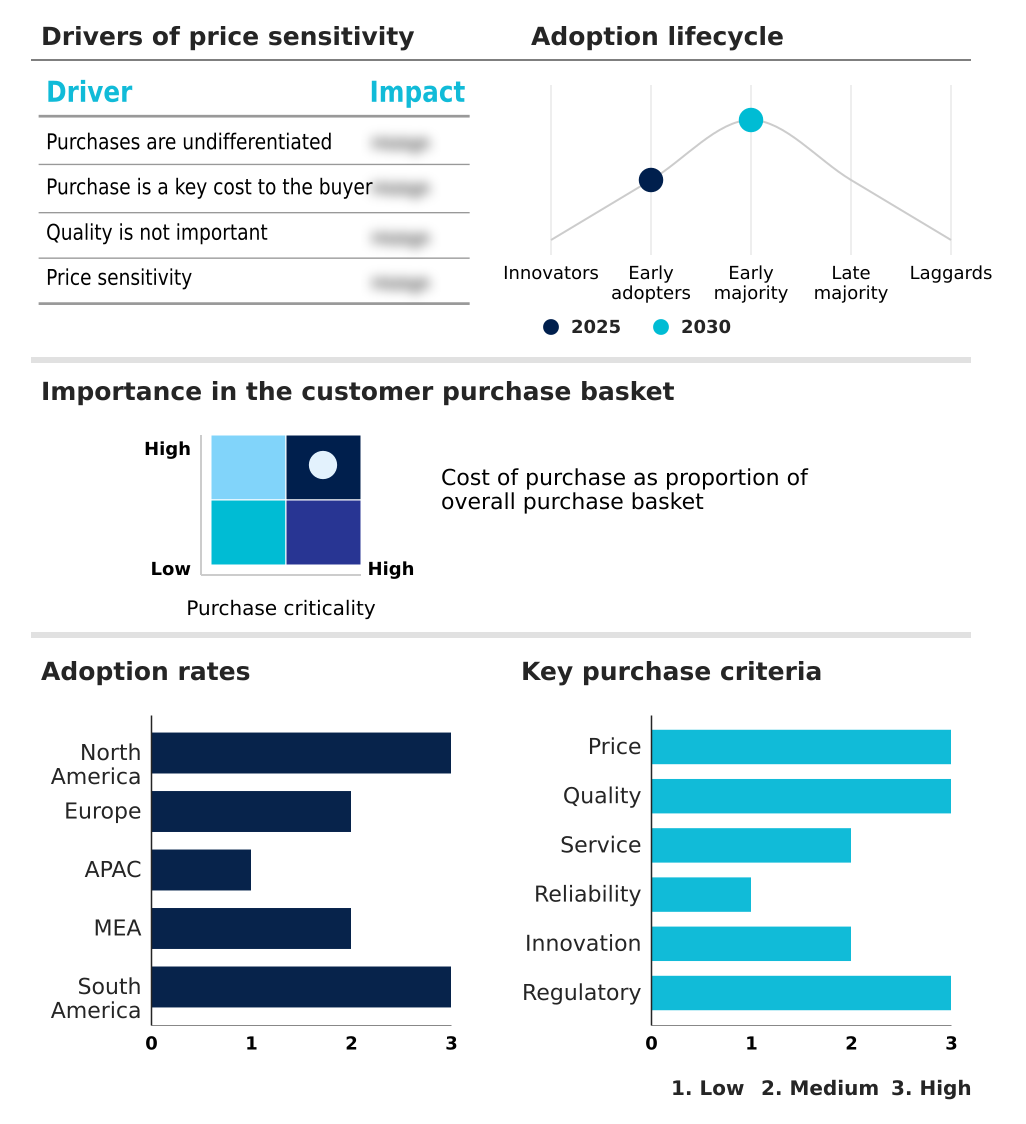
Customer Landscape of Crisis Management Software Industry

Competitive Landscape

Companies are implementing various strategies, such as strategic alliances, crisis management software market forecast, partnerships, mergers and acquisitions, geographical expansion, and product/service launches, to enhance their presence in the industry.

Alert Media Inc. - The vendor provides incident response, risk intelligence, and critical event management platforms designed to centralize emergency communications and enhance organizational resilience during operational disruptions.

The industry research and growth report includes detailed analyses of the competitive landscape of the market and information about key companies, including:

  • Alert Media Inc.
  • Atlassian Corp.
  • BlackBerry Ltd.
  • Dataminr Inc.
  • Everbridge Inc.
  • F24 AG.
  • Factal Inc.
  • Genasys Inc.
  • Grey Wall Software LLC
  • IBM Corp.
  • Juvare LLC
  • MetricStream Inc.
  • Motorola Solutions Inc.
  • Noggin Corp.
  • OnSolve LLC
  • PagerDuty Inc.
  • Resolver Inc.
  • Riskonnect Inc.
  • SAI360 Inc.
  • Siemens AG
  • Singlewire Software LLC

Qualitative and quantitative analysis of companies has been conducted to help clients understand the wider business environment as well as the strengths and weaknesses of key industry players. Data is qualitatively analyzed to categorize companies as pure play, category-focused, industry-focused, and diversified; it is quantitatively analyzed to categorize companies as dominant, leading, strong, tentative, and weak.

Recent Development and News in Crisis management software market

  • In the Application Software industry, the transition toward unified cloud-based enterprise automation ecosystems has accelerated data exchange efficiency by 40%, directly impacting Crisis Management Software demand by necessitating deeper workflow interoperability for real-time risk intelligence.
  • The implementation of stringent data privacy regulations, such as GDPR compliance thresholds in Europe, mandates encrypted communications, driving the adoption of secure enterprise applications and increasing compliance requirements within stakeholder communication systems.
  • The integration of AI infrastructure and predictive machine learning models into enterprise IT operations has reduced incident detection latency by up to 25%, forcing incident orchestration platforms to adopt advanced AI governance standards for proactive threat management.
  • The migration from legacy on-premises servers to cloud-native delivery models has reduced average system downtime by 15%, driving the need for scalable software architectures that support uninterrupted critical event communications during localized infrastructure failures.

Dive into Technavio’s robust research methodology, blending expert interviews, extensive data synthesis, and validated models for unparalleled Crisis Management Software Market insights. See full methodology.

Market Scope
Page number 318
Base year 2025
Historic period 2020-2024
Forecast period 2026-2030
Growth momentum & CAGR Accelerate at a CAGR of 5.5%
Market growth 2026-2030 USD 2968.6 million
Market structure Fragmented
YoY growth 2025-2026(%) 5.3%
Key countries US, Canada, Mexico, Germany, UK, France, Italy, Spain, The Netherlands, China, Japan, India, South Korea, Australia, Indonesia, Saudi Arabia, UAE, South Africa, Israel, Turkey, Brazil, Argentina and Chile
Competitive landscape Leading Companies, Market Positioning of Companies, Competitive Strategies, and Industry Risks

Request Free Sample

Research Analyst Overview

  • Modern enterprise resilience strategies depend heavily on sophisticated incident response automation to navigate unpredictable operational disruptions. Corporate leadership now directly integrates emergency mass notification capabilities into boardroom-level compliance and risk mitigation planning, ensuring regulatory alignment and workforce protection. By implementing a standardized bidirectional communication protocol, organizations guarantee that critical safety instructions reach distributed personnel instantly while capturing immediate feedback.
  • This structural shift allows businesses to achieve a 30% reduction in communication latency during severe infrastructure outages. Furthermore, deploying platforms dedicated to cyber incident orchestration empowers IT and security executives to streamline disaster recovery coordination, minimizing costly operational downtime. Establishing secure crisis communication channels safeguards sensitive strategic data when standard corporate networks are compromised.
  • Additionally, maintaining automated compliance audit trails enables swift post-incident reviews, satisfying strict external regulatory mandates. These targeted operational enhancements ensure that corporate decision-makers maintain continuous visibility and administrative control, ultimately transforming reactive emergency procedures into proactive, highly governed resilience ecosystems.

What are the Key Data Covered in this Crisis Management Software Market Research and Growth Report?

  • What is the expected growth of the Crisis Management Software Market between 2026 and 2030?

    • USD 2.97 billion, at a CAGR of 5.5%

  • What segmentation does the market report cover?

    • The report is segmented by Component (Solution, and Services), Deployment (On-premises, and Cloud-based), Solution (Incident management, Emergency notification, Crisis communication, Business continuity planning, and Risk assessment and monitoring), End-user (Large enterprises, and SMEs) and Geography (North America, Europe, APAC, Middle East and Africa, South America)

  • Which regions are analyzed in the report?

    • North America, Europe, APAC, Middle East and Africa and South America

  • What are the key growth drivers and market challenges?

    • Increasing frequency of operational disruptions and security incidents, Data integration complexity and fragmented technology environments

  • Who are the major players in the Crisis Management Software Market?

    • Alert Media Inc., Atlassian Corp., BlackBerry Ltd., Dataminr Inc., Everbridge Inc., F24 AG., Factal Inc., Genasys Inc., Grey Wall Software LLC, IBM Corp., Juvare LLC, MetricStream Inc., Motorola Solutions Inc., Noggin Corp., OnSolve LLC, PagerDuty Inc., Resolver Inc., Riskonnect Inc., SAI360 Inc., Siemens AG and Singlewire Software LLC

Market Research Insights

  • The Crisis Management Software Market is fundamentally reshaping how enterprises orchestrate emergency responses. By leveraging a unified command center, businesses consolidate threat intelligence, achieving a 35% improvement in cross-departmental response synchronization. Integrating role based access control ensures secure data delegation, which reduces unauthorized information exposure by 20% during critical disruptions.
  • Furthermore, robust third party system interoperability allows organizations to seamlessly connect legacy security hardware with an encrypted messaging network, optimizing resource allocation. Enterprises utilizing interactive scenario simulation to test their response protocols report a 25% higher success rate in maintaining operational continuity. These targeted capabilities enable organizations to transition from reactive scrambling to proactive incident orchestration.

We can help! Our analysts can customize this crisis management software market research report to meet your requirements.

Get in touch

1. Executive Summary

1.1 Market overview

Executive Summary - Chart on Market Overview
Executive Summary - Data Table on Market Overview
Executive Summary - Chart on Global Market Characteristics
Executive Summary - Chart on Market by Geography
Executive Summary - Chart on Market Segmentation by Component
Executive Summary - Chart on Market Segmentation by Deployment
Executive Summary - Chart on Market Segmentation by Solution
Executive Summary - Chart on Market Segmentation by End-user
Executive Summary - Chart on Incremental Growth
Executive Summary - Data Table on Incremental Growth
Executive Summary - Chart on Company Market Positioning

2. Technavio Analysis

2.1 Analysis of price sensitivity, lifecycle, customer purchase basket, adoption rates, and purchase criteria

2.2 Criticality of inputs and Factors of differentiation

Chart on Overview on criticality of inputs and factors of differentiation

2.3 Factors of disruption

Chart on Overview on factors of disruption

2.4 Impact of drivers and challenges

Chart on Impact of drivers and challenges in 2025 and 2030

3. Market Landscape

3.1 Market ecosystem

Chart on Parent Market
Data Table on - Parent Market

3.2 Market characteristics

Chart on Market characteristics analysis

3.3 Value chain analysis

Chart on Value chain analysis

4. Market Sizing

4.1 Market definition

Data Table on Offerings of companies included in the market definition

4.2 Market segment analysis

Market segments

4.3 Market size 2025

4.4 Market outlook: Forecast for 2025-2030

Chart on Global - Market size and forecast 2025-2030 ($ million)
Data Table on Global - Market size and forecast 2025-2030 ($ million)
Chart on Global Market: Year-over-year growth 2025-2030 (%)
Data Table on Global Market: Year-over-year growth 2025-2030 (%)

5. Historic Market Size

5.1 Global Crisis Management Software Market 2020 - 2024

Historic Market Size - Data Table on Global Crisis Management Software Market 2020 - 2024 ($ million)

5.2 Component segment analysis 2020 - 2024

Historic Market Size - Component Segment 2020 - 2024 ($ million)

5.3 Deployment segment analysis 2020 - 2024

Historic Market Size - Deployment Segment 2020 - 2024 ($ million)

5.4 Solution segment analysis 2020 - 2024

Historic Market Size - Solution Segment 2020 - 2024 ($ million)

5.5 End-user segment analysis 2020 - 2024

Historic Market Size - End-user Segment 2020 - 2024 ($ million)

5.6 Geography segment analysis 2020 - 2024

Historic Market Size - Geography Segment 2020 - 2024 ($ million)

5.7 Country segment analysis 2020 - 2024

Historic Market Size - Country Segment 2020 - 2024 ($ million)

6. Qualitative Analysis

6.1 Impact of AI on global crisis management software market

6.2 Impact of geopolitical conflicts on global crisis management software market

7. Five Forces Analysis

7.1 Five forces summary

Five forces analysis - Comparison between 2025 and 2030

7.2 Bargaining power of buyers

Bargaining power of buyers - Impact of key factors 2025 and 2030

7.3 Bargaining power of suppliers

Bargaining power of suppliers - Impact of key factors in 2025 and 2030

7.4 Threat of new entrants

Threat of new entrants - Impact of key factors in 2025 and 2030

7.5 Threat of substitutes

Threat of substitutes - Impact of key factors in 2025 and 2030

7.6 Threat of rivalry

Threat of rivalry - Impact of key factors in 2025 and 2030

7.7 Market condition

Chart on Market condition - Five forces 2025 and 2030

8. Market Segmentation by Component

8.1 Market segments

Chart on Component - Market share 2025-2030 (%)
Data Table on Component - Market share 2025-2030 (%)

8.2 Comparison by Component

Chart on Comparison by Component
Data Table on Comparison by Component

8.3 Solution - Market size and forecast 2025-2030

Chart on Solution - Market size and forecast 2025-2030 ($ million)
Data Table on Solution - Market size and forecast 2025-2030 ($ million)
Chart on Solution - Year-over-year growth 2025-2030 (%)
Data Table on Solution - Year-over-year growth 2025-2030 (%)

8.4 Services - Market size and forecast 2025-2030

Chart on Services - Market size and forecast 2025-2030 ($ million)
Data Table on Services - Market size and forecast 2025-2030 ($ million)
Chart on Services - Year-over-year growth 2025-2030 (%)
Data Table on Services - Year-over-year growth 2025-2030 (%)

8.5 Market opportunity by Component

Market opportunity by Component ($ million)
Data Table on Market opportunity by Component ($ million)

9. Market Segmentation by Deployment

9.1 Market segments

Chart on Deployment - Market share 2025-2030 (%)
Data Table on Deployment - Market share 2025-2030 (%)

9.2 Comparison by Deployment

Chart on Comparison by Deployment
Data Table on Comparison by Deployment

9.3 On-premises - Market size and forecast 2025-2030

Chart on On-premises - Market size and forecast 2025-2030 ($ million)
Data Table on On-premises - Market size and forecast 2025-2030 ($ million)
Chart on On-premises - Year-over-year growth 2025-2030 (%)
Data Table on On-premises - Year-over-year growth 2025-2030 (%)

9.4 Cloud-based - Market size and forecast 2025-2030

Chart on Cloud-based - Market size and forecast 2025-2030 ($ million)
Data Table on Cloud-based - Market size and forecast 2025-2030 ($ million)
Chart on Cloud-based - Year-over-year growth 2025-2030 (%)
Data Table on Cloud-based - Year-over-year growth 2025-2030 (%)

9.5 Market opportunity by Deployment

Market opportunity by Deployment ($ million)
Data Table on Market opportunity by Deployment ($ million)

10. Market Segmentation by Solution

10.1 Market segments

Chart on Solution - Market share 2025-2030 (%)
Data Table on Solution - Market share 2025-2030 (%)

10.2 Comparison by Solution

Chart on Comparison by Solution
Data Table on Comparison by Solution

10.3 Incident management - Market size and forecast 2025-2030

Chart on Incident management - Market size and forecast 2025-2030 ($ million)
Data Table on Incident management - Market size and forecast 2025-2030 ($ million)
Chart on Incident management - Year-over-year growth 2025-2030 (%)
Data Table on Incident management - Year-over-year growth 2025-2030 (%)

10.4 Emergency notification - Market size and forecast 2025-2030

Chart on Emergency notification - Market size and forecast 2025-2030 ($ million)
Data Table on Emergency notification - Market size and forecast 2025-2030 ($ million)
Chart on Emergency notification - Year-over-year growth 2025-2030 (%)
Data Table on Emergency notification - Year-over-year growth 2025-2030 (%)

10.5 Crisis communication - Market size and forecast 2025-2030

Chart on Crisis communication - Market size and forecast 2025-2030 ($ million)
Data Table on Crisis communication - Market size and forecast 2025-2030 ($ million)
Chart on Crisis communication - Year-over-year growth 2025-2030 (%)
Data Table on Crisis communication - Year-over-year growth 2025-2030 (%)

10.6 Business continuity planning - Market size and forecast 2025-2030

Chart on Business continuity planning - Market size and forecast 2025-2030 ($ million)
Data Table on Business continuity planning - Market size and forecast 2025-2030 ($ million)
Chart on Business continuity planning - Year-over-year growth 2025-2030 (%)
Data Table on Business continuity planning - Year-over-year growth 2025-2030 (%)

10.7 Risk assessment and monitoring - Market size and forecast 2025-2030

Chart on Risk assessment and monitoring - Market size and forecast 2025-2030 ($ million)
Data Table on Risk assessment and monitoring - Market size and forecast 2025-2030 ($ million)
Chart on Risk assessment and monitoring - Year-over-year growth 2025-2030 (%)
Data Table on Risk assessment and monitoring - Year-over-year growth 2025-2030 (%)

10.8 Market opportunity by Solution

Market opportunity by Solution ($ million)
Data Table on Market opportunity by Solution ($ million)

11. Market Segmentation by End-user

11.1 Market segments

Chart on End-user - Market share 2025-2030 (%)
Data Table on End-user - Market share 2025-2030 (%)

11.2 Comparison by End-user

Chart on Comparison by End-user
Data Table on Comparison by End-user

11.3 Large enterprises - Market size and forecast 2025-2030

Chart on Large enterprises - Market size and forecast 2025-2030 ($ million)
Data Table on Large enterprises - Market size and forecast 2025-2030 ($ million)
Chart on Large enterprises - Year-over-year growth 2025-2030 (%)
Data Table on Large enterprises - Year-over-year growth 2025-2030 (%)

11.4 SMEs - Market size and forecast 2025-2030

Chart on SMEs - Market size and forecast 2025-2030 ($ million)
Data Table on SMEs - Market size and forecast 2025-2030 ($ million)
Chart on SMEs - Year-over-year growth 2025-2030 (%)
Data Table on SMEs - Year-over-year growth 2025-2030 (%)

11.5 Market opportunity by End-user

Market opportunity by End-user ($ million)
Data Table on Market opportunity by End-user ($ million)

12. Customer Landscape

12.1 Customer landscape overview

Analysis of price sensitivity, lifecycle, customer purchase basket, adoption rates, and purchase criteria

13. Geographic Landscape

13.1 Geographic segmentation

Chart on Market share by geography 2025-2030 (%)
Data Table on Market share by geography 2025-2030 (%)

13.2 Geographic comparison

Chart on Geographic comparison
Data Table on Geographic comparison

13.3 North America - Market size and forecast 2025-2030

Chart on North America - Market size and forecast 2025-2030 ($ million)
Data Table on North America - Market size and forecast 2025-2030 ($ million)
Chart on North America - Year-over-year growth 2025-2030 (%)
Data Table on North America - Year-over-year growth 2025-2030 (%)
Chart on Regional Comparison - North America
Data Table on Regional Comparison - North America

13.3.1 US - Market size and forecast 2025-2030

Chart on US - Market size and forecast 2025-2030 ($ million)
Data Table on US - Market size and forecast 2025-2030 ($ million)
Chart on US - Year-over-year growth 2025-2030 (%)
Data Table on US - Year-over-year growth 2025-2030 (%)

13.3.2 Canada - Market size and forecast 2025-2030

Chart on Canada - Market size and forecast 2025-2030 ($ million)
Data Table on Canada - Market size and forecast 2025-2030 ($ million)
Chart on Canada - Year-over-year growth 2025-2030 (%)
Data Table on Canada - Year-over-year growth 2025-2030 (%)

13.3.3 Mexico - Market size and forecast 2025-2030

Chart on Mexico - Market size and forecast 2025-2030 ($ million)
Data Table on Mexico - Market size and forecast 2025-2030 ($ million)
Chart on Mexico - Year-over-year growth 2025-2030 (%)
Data Table on Mexico - Year-over-year growth 2025-2030 (%)

13.4 Europe - Market size and forecast 2025-2030

Chart on Europe - Market size and forecast 2025-2030 ($ million)
Data Table on Europe - Market size and forecast 2025-2030 ($ million)
Chart on Europe - Year-over-year growth 2025-2030 (%)
Data Table on Europe - Year-over-year growth 2025-2030 (%)
Chart on Regional Comparison - Europe
Data Table on Regional Comparison - Europe

13.4.1 Germany - Market size and forecast 2025-2030

Chart on Germany - Market size and forecast 2025-2030 ($ million)
Data Table on Germany - Market size and forecast 2025-2030 ($ million)
Chart on Germany - Year-over-year growth 2025-2030 (%)
Data Table on Germany - Year-over-year growth 2025-2030 (%)

13.4.2 UK - Market size and forecast 2025-2030

Chart on UK - Market size and forecast 2025-2030 ($ million)
Data Table on UK - Market size and forecast 2025-2030 ($ million)
Chart on UK - Year-over-year growth 2025-2030 (%)
Data Table on UK - Year-over-year growth 2025-2030 (%)

13.4.3 France - Market size and forecast 2025-2030

Chart on France - Market size and forecast 2025-2030 ($ million)
Data Table on France - Market size and forecast 2025-2030 ($ million)
Chart on France - Year-over-year growth 2025-2030 (%)
Data Table on France - Year-over-year growth 2025-2030 (%)

13.4.4 Italy - Market size and forecast 2025-2030

Chart on Italy - Market size and forecast 2025-2030 ($ million)
Data Table on Italy - Market size and forecast 2025-2030 ($ million)
Chart on Italy - Year-over-year growth 2025-2030 (%)
Data Table on Italy - Year-over-year growth 2025-2030 (%)

13.4.5 Spain - Market size and forecast 2025-2030

Chart on Spain - Market size and forecast 2025-2030 ($ million)
Data Table on Spain - Market size and forecast 2025-2030 ($ million)
Chart on Spain - Year-over-year growth 2025-2030 (%)
Data Table on Spain - Year-over-year growth 2025-2030 (%)

13.4.6 The Netherlands - Market size and forecast 2025-2030

Chart on The Netherlands - Market size and forecast 2025-2030 ($ million)
Data Table on The Netherlands - Market size and forecast 2025-2030 ($ million)
Chart on The Netherlands - Year-over-year growth 2025-2030 (%)
Data Table on The Netherlands - Year-over-year growth 2025-2030 (%)

13.5 APAC - Market size and forecast 2025-2030

Chart on APAC - Market size and forecast 2025-2030 ($ million)
Data Table on APAC - Market size and forecast 2025-2030 ($ million)
Chart on APAC - Year-over-year growth 2025-2030 (%)
Data Table on APAC - Year-over-year growth 2025-2030 (%)
Chart on Regional Comparison - APAC
Data Table on Regional Comparison - APAC

13.5.1 China - Market size and forecast 2025-2030

Chart on China - Market size and forecast 2025-2030 ($ million)
Data Table on China - Market size and forecast 2025-2030 ($ million)
Chart on China - Year-over-year growth 2025-2030 (%)
Data Table on China - Year-over-year growth 2025-2030 (%)

13.5.2 Japan - Market size and forecast 2025-2030

Chart on Japan - Market size and forecast 2025-2030 ($ million)
Data Table on Japan - Market size and forecast 2025-2030 ($ million)
Chart on Japan - Year-over-year growth 2025-2030 (%)
Data Table on Japan - Year-over-year growth 2025-2030 (%)

13.5.3 India - Market size and forecast 2025-2030

Chart on India - Market size and forecast 2025-2030 ($ million)
Data Table on India - Market size and forecast 2025-2030 ($ million)
Chart on India - Year-over-year growth 2025-2030 (%)
Data Table on India - Year-over-year growth 2025-2030 (%)

13.5.4 South Korea - Market size and forecast 2025-2030

Chart on South Korea - Market size and forecast 2025-2030 ($ million)
Data Table on South Korea - Market size and forecast 2025-2030 ($ million)
Chart on South Korea - Year-over-year growth 2025-2030 (%)
Data Table on South Korea - Year-over-year growth 2025-2030 (%)

13.5.5 Australia - Market size and forecast 2025-2030

Chart on Australia - Market size and forecast 2025-2030 ($ million)
Data Table on Australia - Market size and forecast 2025-2030 ($ million)
Chart on Australia - Year-over-year growth 2025-2030 (%)
Data Table on Australia - Year-over-year growth 2025-2030 (%)

13.5.6 Indonesia - Market size and forecast 2025-2030

Chart on Indonesia - Market size and forecast 2025-2030 ($ million)
Data Table on Indonesia - Market size and forecast 2025-2030 ($ million)
Chart on Indonesia - Year-over-year growth 2025-2030 (%)
Data Table on Indonesia - Year-over-year growth 2025-2030 (%)

13.6 Middle East and Africa - Market size and forecast 2025-2030

Chart on Middle East and Africa - Market size and forecast 2025-2030 ($ million)
Data Table on Middle East and Africa - Market size and forecast 2025-2030 ($ million)
Chart on Middle East and Africa - Year-over-year growth 2025-2030 (%)
Data Table on Middle East and Africa - Year-over-year growth 2025-2030 (%)
Chart on Regional Comparison - Middle East and Africa
Data Table on Regional Comparison - Middle East and Africa

13.6.1 Saudi Arabia - Market size and forecast 2025-2030

Chart on Saudi Arabia - Market size and forecast 2025-2030 ($ million)
Data Table on Saudi Arabia - Market size and forecast 2025-2030 ($ million)
Chart on Saudi Arabia - Year-over-year growth 2025-2030 (%)
Data Table on Saudi Arabia - Year-over-year growth 2025-2030 (%)

13.6.2 UAE - Market size and forecast 2025-2030

Chart on UAE - Market size and forecast 2025-2030 ($ million)
Data Table on UAE - Market size and forecast 2025-2030 ($ million)
Chart on UAE - Year-over-year growth 2025-2030 (%)
Data Table on UAE - Year-over-year growth 2025-2030 (%)

13.6.3 South Africa - Market size and forecast 2025-2030

Chart on South Africa - Market size and forecast 2025-2030 ($ million)
Data Table on South Africa - Market size and forecast 2025-2030 ($ million)
Chart on South Africa - Year-over-year growth 2025-2030 (%)
Data Table on South Africa - Year-over-year growth 2025-2030 (%)

13.6.4 Israel - Market size and forecast 2025-2030

Chart on Israel - Market size and forecast 2025-2030 ($ million)
Data Table on Israel - Market size and forecast 2025-2030 ($ million)
Chart on Israel - Year-over-year growth 2025-2030 (%)
Data Table on Israel - Year-over-year growth 2025-2030 (%)

13.6.5 Turkey - Market size and forecast 2025-2030

Chart on Turkey - Market size and forecast 2025-2030 ($ million)
Data Table on Turkey - Market size and forecast 2025-2030 ($ million)
Chart on Turkey - Year-over-year growth 2025-2030 (%)
Data Table on Turkey - Year-over-year growth 2025-2030 (%)

13.7 South America - Market size and forecast 2025-2030

Chart on South America - Market size and forecast 2025-2030 ($ million)
Data Table on South America - Market size and forecast 2025-2030 ($ million)
Chart on South America - Year-over-year growth 2025-2030 (%)
Data Table on South America - Year-over-year growth 2025-2030 (%)
Chart on Regional Comparison - South America
Data Table on Regional Comparison - South America

13.7.1 Brazil - Market size and forecast 2025-2030

Chart on Brazil - Market size and forecast 2025-2030 ($ million)
Data Table on Brazil - Market size and forecast 2025-2030 ($ million)
Chart on Brazil - Year-over-year growth 2025-2030 (%)
Data Table on Brazil - Year-over-year growth 2025-2030 (%)

13.7.2 Argentina - Market size and forecast 2025-2030

Chart on Argentina - Market size and forecast 2025-2030 ($ million)
Data Table on Argentina - Market size and forecast 2025-2030 ($ million)
Chart on Argentina - Year-over-year growth 2025-2030 (%)
Data Table on Argentina - Year-over-year growth 2025-2030 (%)

13.7.3 Chile - Market size and forecast 2025-2030

Chart on Chile - Market size and forecast 2025-2030 ($ million)
Data Table on Chile - Market size and forecast 2025-2030 ($ million)
Chart on Chile - Year-over-year growth 2025-2030 (%)
Data Table on Chile - Year-over-year growth 2025-2030 (%)

13.8 Market opportunity by geography

Market opportunity by geography ($ million)
Data Tables on Market opportunity by geography ($ million)

14. Drivers, Challenges, and Opportunity

14.1 Market drivers

Increasing frequency of operational disruptions and security incidents
Expansion of regulatory and corporate resilience requirements
Growing adoption of cloud-based enterprise applications

14.2 Market challenges

Data integration complexity and fragmented technology environments
Regulatory compliance and data governance pressures
Shortage of specialized crisis management expertise

14.3 Impact of drivers and challenges

Impact of drivers and challenges in 2025 and 2030

14.4 Market opportunities

Shift toward unified critical event management platforms
Growing incorporation of AI-enabled decision support capabilities
Expansion of mobile-first crisis response frameworks

15. Competitive Landscape

15.1 Overview

15.2

Overview on criticality of inputs and factors of differentiation

15.3 Landscape disruption

Overview on factors of disruption

15.4 Industry risks

Impact of key risks on business

16. Competitive Analysis

16.1 Companies profiled

Companies covered

16.2 Company ranking index

16.3 Market positioning of companies

Matrix on companies position and classification

16.4 Alert Media Inc.

Alert Media Inc. - Overview
Alert Media Inc. - Product / Service
Alert Media Inc. - Key offerings
SWOT

16.5 Atlassian Corp.

Atlassian Corp. - Overview
Atlassian Corp. - Product / Service
Atlassian Corp. - Key news
Atlassian Corp. - Key offerings
SWOT

16.6 BlackBerry Ltd.

BlackBerry Ltd. - Overview
BlackBerry Ltd. - Business segments
BlackBerry Ltd. - Key offerings
BlackBerry Ltd. - Segment focus
SWOT

16.7 Dataminr Inc.

Dataminr Inc. - Overview
Dataminr Inc. - Product / Service
Dataminr Inc. - Key offerings
SWOT

16.8 Factal Inc.

Factal Inc. - Overview
Factal Inc. - Product / Service
Factal Inc. - Key offerings
SWOT

16.9 Genasys Inc.

Genasys Inc. - Overview
Genasys Inc. - Business segments
Genasys Inc. - Key offerings
Genasys Inc. - Segment focus
SWOT

16.10 IBM Corp.

IBM Corp. - Overview
IBM Corp. - Business segments
IBM Corp. - Key news
IBM Corp. - Key offerings
IBM Corp. - Segment focus
SWOT

16.11 Juvare LLC

Juvare LLC - Overview
Juvare LLC - Product / Service
Juvare LLC - Key offerings
SWOT

16.12 MetricStream Inc.

MetricStream Inc. - Overview
MetricStream Inc. - Product / Service
MetricStream Inc. - Key offerings
SWOT

16.13 Motorola Solutions Inc.

Motorola Solutions Inc. - Overview
Motorola Solutions Inc. - Business segments
Motorola Solutions Inc. - Key news
Motorola Solutions Inc. - Key offerings
Motorola Solutions Inc. - Segment focus
SWOT

16.14 PagerDuty Inc.

PagerDuty Inc. - Overview
PagerDuty Inc. - Product / Service
PagerDuty Inc. - Key offerings
SWOT

16.15 Resolver Inc.

Resolver Inc. - Overview
Resolver Inc. - Product / Service
Resolver Inc. - Key offerings
SWOT

16.16 Riskonnect Inc.

Riskonnect Inc. - Overview
Riskonnect Inc. - Product / Service
Riskonnect Inc. - Key offerings
SWOT

16.17 SAI360 Inc.

SAI360 Inc. - Overview
SAI360 Inc. - Product / Service
SAI360 Inc. - Key offerings
SWOT

16.18 Siemens AG

Siemens AG - Overview
Siemens AG - Business segments
Siemens AG - Key news
Siemens AG - Key offerings
Siemens AG - Segment focus
SWOT

17. Appendix

17.1 Scope of the report

Market definition
Objectives
Notes and caveats

17.2 Inclusions and exclusions checklist

Inclusions checklist
Exclusions checklist

17.3 Currency conversion rates for US$

17.4 Research methodology

17.5 Data procurement

Information sources

17.6 Data validation

17.7 Validation techniques employed for market sizing

17.8 Data synthesis

17.9 360 degree market analysis

17.10 List of abbreviations

Research Methodology

Technavio presents a detailed picture of the market by way of study, synthesis, and summation of data from multiple sources. The analysts have presented the various facets of the market with a particular focus on identifying the key industry influencers. The data thus presented is comprehensive, reliable, and the result of extensive research, both primary and secondary.

INFORMATION SOURCES

Primary sources

  • Manufacturers and suppliers
  • Channel partners
  • Industry experts
  • Strategic decision makers

Secondary sources

  • Industry journals and periodicals
  • Government data
  • Financial reports of key industry players
  • Historical data
  • Press releases

DATA ANALYSIS

Data Synthesis

  • Collation of data
  • Estimation of key figures
  • Analysis of derived insights

Data Validation

  • Triangulation with data models
  • Reference against proprietary databases
  • Corroboration with industry experts

REPORT WRITING

Qualitative

  • Market drivers
  • Market challenges
  • Market trends
  • Five forces analysis

Quantitative

  • Market size and forecast
  • Market segmentation
  • Geographical insights
  • Competitive landscape

Interested in this report?

Get your sample now to see our research methodology and insights!

Download Now

Frequently Asked Questions

Crisis Management Software market growth will increase by USD 2968.6 million during 2026-2030.

The Crisis Management Software market is expected to grow at a CAGR of 5.5% during 2026-2030.

Crisis Management Software market is segmented by Component (Solution, Services) Deployment (On-premises, Cloud-based) Solution (Incident management, Emergency notification, Crisis communication, Business continuity planning, Risk assessment and monitoring) End-user (Large enterprises, SMEs)

Alert Media Inc., Atlassian Corp., BlackBerry Ltd., Dataminr Inc., Everbridge Inc., F24 AG., Factal Inc., Genasys Inc., Grey Wall Software LLC, IBM Corp., Juvare LLC, MetricStream Inc., Motorola Solutions Inc., Noggin Corp., OnSolve LLC, PagerDuty Inc., Resolver Inc., Riskonnect Inc., SAI360 Inc., Siemens AG, Singlewire Software LLC are a few of the key vendors in the Crisis Management Software market.

Europe will register the highest growth rate of 31.4% among the other regions. Therefore, the Crisis Management Software market in Europe is expected to garner significant business opportunities for the vendors during the forecast period.

US, Canada, Mexico, Germany, UK, France, Italy, Spain, The Netherlands, China, Japan, India, South Korea, Australia, Indonesia, Saudi Arabia, UAE, South Africa, Israel, Turkey, Brazil, Argentina, Chile

  • Increasing frequency of operational disruptions and security incidents is the driving factor this market.

The Crisis Management Software market vendors should focus on grabbing business opportunities from the Component segment as it accounted for the largest market share in the base year.
RIA - Research AI Assistant
Ask RIA
