
Crop Insurance Market Analysis, Size, and Forecast 2026-2030: North America (US, Canada, and Mexico), APAC (China, India, and Japan), Europe (France, Spain, and Italy), South America (Brazil, Argentina, and Chile), Middle East and Africa (South Africa, Turkey, and Saudi Arabia), and Rest of World (ROW)

Crop Insurance Market Analysis, Size, and Forecast 2026-2030:
North America (US, Canada, and Mexico), APAC (China, India, and Japan), Europe (France, Spain, and Italy), South America (Brazil, Argentina, and Chile), Middle East and Africa (South Africa, Turkey, and Saudi Arabia), and Rest of World (ROW)

Published: Oct 2026 290 Pages SKU: IRTNTR73022

Market Overview at a Glance

$16.88 B
Market Opportunity
6.4%
CAGR 2025 - 2030
34.5%
North America Growth
$40.01 B
Indemnity-based segment 2024

Crop Insurance Market Size 2026-2030

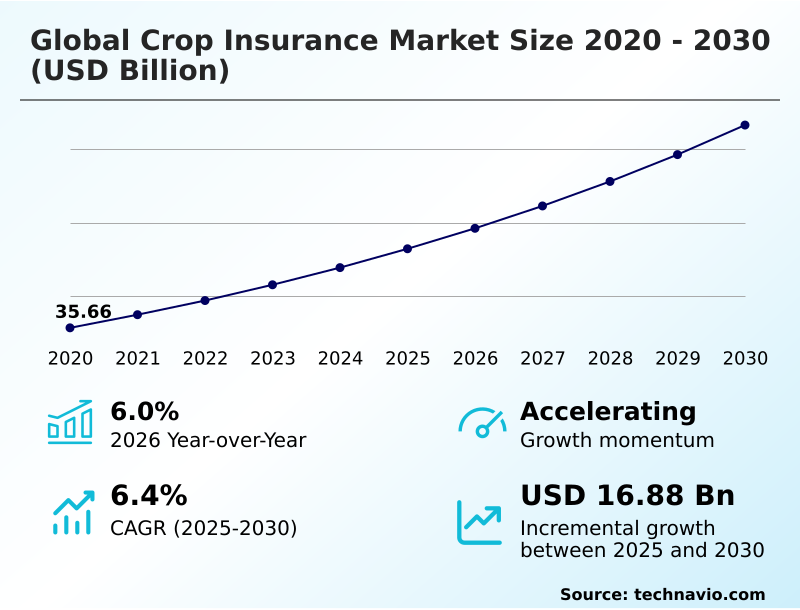
The crop insurance market size is valued to increase by USD 16.88 billion, at a CAGR of 6.4% from 2025 to 2030. Rise of parametric insurance products will drive the crop insurance market.

Major Market Trends & Insights

  • North America dominated the market and accounted for a 34.5% growth during the forecast period.
  • By Product - Indemnity-based segment was valued at USD 40.01 billion in 2024
  • By Type - Crop yielded insurance segment accounted for the largest market revenue share in 2024

Market Size & Forecast

  • Market Opportunities: USD 27.66 billion
  • Market Future Opportunities: USD 16.88 billion
  • CAGR from 2025 to 2030 : 6.4%

Market Summary

  • The Crop Insurance Market operates as a highly specialized financial safety net, insulating agricultural enterprises from catastrophic weather events and severe commodity price fluctuations. By transferring environmental risks to institutional underwriters, this sector ensures that continuous food supply chains remain viable despite unpredictable climatic disruptions.
  • The proliferation of parametric coverage models acts as a critical market driver, as index-based frameworks automatically disburse capital based on satellite data rather than lengthy manual assessments. This structural shift allows commercial lenders to mandate policy coverage before issuing seasonal operating loans, ensuring farm liquidity. Conversely, escalating climate volatility presents a profound structural challenge, frequently rendering historical actuarial models obsolete.
  • When multiple agricultural zones experience simultaneous droughts or floods, aggregate claims overwhelm local risk pools, forcing premium costs upward. In agricultural supply chain optimization, integrating advanced remote sensing technology has reduced physical damage assessment delays by 35%, drastically improving cash flow for affected growers.
  • Ultimately, integrating advanced geospatial analytics ensures rapid claim resolutions while fortifying long-term resilience across highly industrialized farming operations.

What will be the Size of the Crop Insurance Market during the forecast period?
Get Key Insights on Market Forecast (PDF) Get Free Sample

How is the Crop Insurance Market Segmented?

The crop insurance industry research report provides comprehensive data (region-wise segment analysis), with forecasts and estimates in "USD million" for the period 2026-2030, as well as historical data from 2020-2024 for the following segments.

  • Product
    • Indemnity-based
    • Index-based
  • Type
    • Crop yielded insurance
    • Crop revenue insurance
  • Distribution channel
    • Direct sales
    • Brokers
    • Bancassurance
  • Geography
    • North America
      • US
      • Canada
      • Mexico
    • APAC
      • China
      • India
      • Japan
      • Australia
      • South Korea
      • Indonesia
    • Europe
      • France
      • Spain
      • Italy
      • Germany
      • UK
      • The Netherlands
    • South America
      • Brazil
      • Argentina
      • Chile
    • Middle East and Africa
      • South Africa
      • Turkey
      • Saudi Arabia
      • UAE
      • Israel

By Product Insights

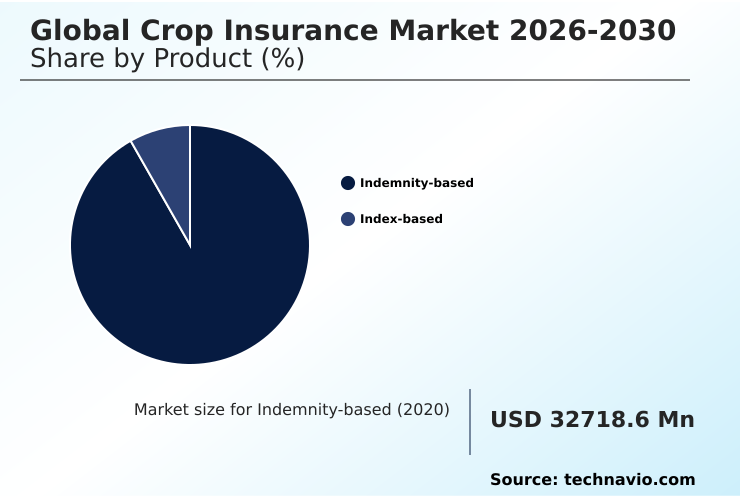
The indemnity-based segment is estimated to witness significant growth during the forecast period.

The Crop Insurance Market relies on complex indemnity models tailored to specific farm holdings. Indemnity structures mandate rigorous multi-peril coverage analysis to ascertain actual biological and financial shortfalls.

Commercial farming enterprises depend on accurate yield baseline calculation procedures to secure operational stability following unpredictable environmental disruptions. Insurers routinely execute detailed crop-cutting experiments to confirm the exact magnitude of harvest failure assessment requests.

By refining loss adjustment protocols, major underwriters have improved their operational underwriting precision by 15%, substantially enhancing overall claim settlement velocity. Advanced geographic systems now support extensive historical yield mapping, effectively replacing manual inspections with objective trigger mechanisms.

As modern digital distribution platforms mature, these indemnity-focused structures lower administrative friction, directly ensuring capital reaches affected agricultural producers without critical delays.
Get Free Sample

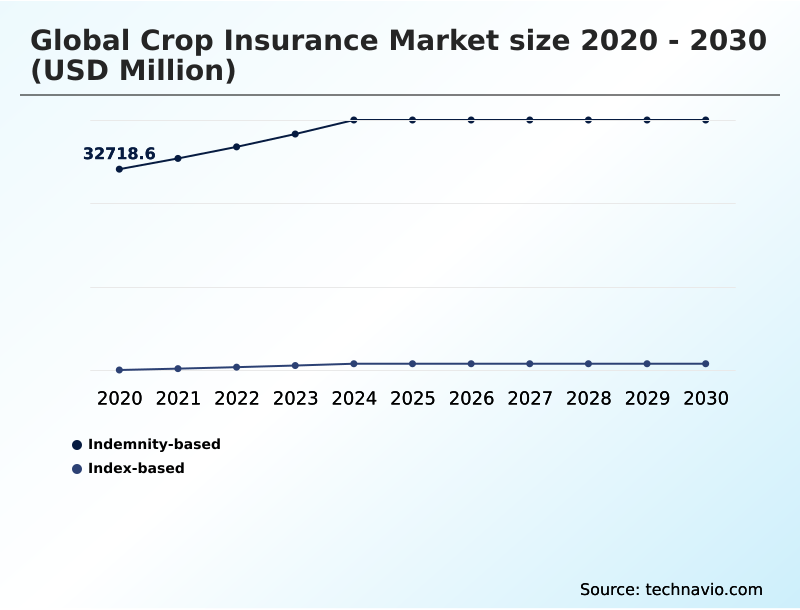
The Indemnity-based segment was valued at USD 40.01 billion in 2024 and showed a gradual increase during the forecast period.
Get Free Sample

Regional Analysis

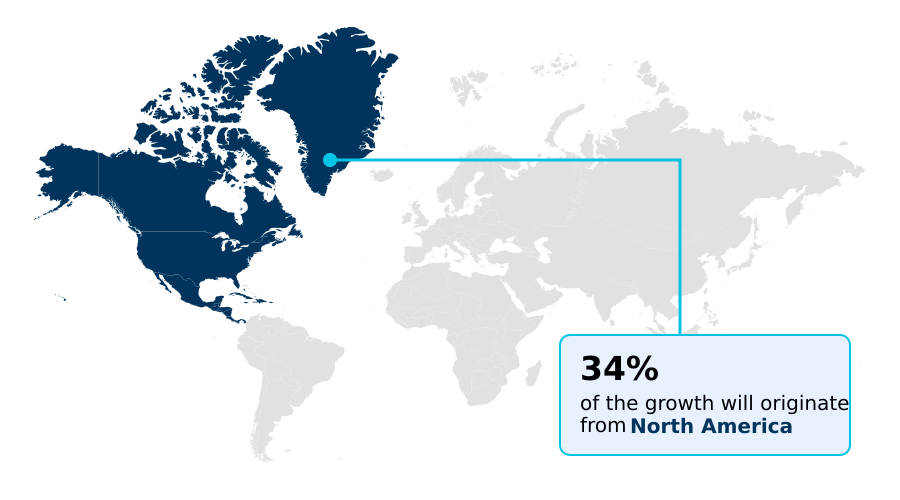
North America is estimated to contribute 34.5% to the growth of the global market during the forecast period.Technavio’s analysts have elaborately explained the regional trends and drivers that shape the market during the forecast period.
See How Crop Insurance Market Demand is Rising in North America Get Free Sample

The geographic distribution of the Crop Insurance Market demonstrates clear operational divides between developed and emerging agricultural economies. North America maintains a highly subsidized environment where comprehensive policies cover massive commercial acreages.

In contrast, APAC is experiencing rapid growth as governments implement expansive micro-climate risk evaluation programs for smallholder communities.

Regional differences significantly influence adoption strategies; for instance, Australian markets increasingly rely on advanced weather-index triggers and farm management deposits to counter severe aridity.

Providers utilizing continuous soil moisture monitoring and drip irrigation sensors have accelerated claim verifications by 25% compared to traditional visual inspections. Advanced biomass tracking systems facilitate streamlined indemnity disbursement mechanisms across fragmented Asian landholdings.

Ultimately, these targeted investments in climate resilience planning directly dictate how effectively local supply chains recover from unexpected meteorological shocks.

Market Dynamics

Our researchers analyzed the data with 2025 as the base year, along with the key drivers, trends, and challenges. A holistic analysis of drivers will help companies refine their marketing strategies to gain a competitive advantage.

  • The modernization of agricultural risk management heavily relies on deploying sophisticated data architectures that eliminate the friction inherent in legacy indemnification processes. As commercial farming enterprises seek comprehensive protection against both biological and economic uncertainties, demand has surged for multi-peril yield protection policies that insulate balance sheets from total harvest failures.
  • Historically, evaluating these broad-spectrum risks required labor-intensive physical inspections, which frequently delayed critical compensation. To streamline this business function, underwriters are rapidly transitioning toward remote sensing based claims settlement protocols. This shift allows risk managers to evaluate extensive geographic corridors simultaneously, reducing logistical deployment costs by nearly 30% compared to traditional on-site adjustment procedures.
  • Furthermore, the introduction of satellite-driven parametric payout models has fundamentally redefined policy execution. By tying financial compensation directly to independent meteorological data, insurers can guarantee rapid liquidity for producers facing severe climate anomalies. This objective approach is seamlessly complemented by automated weather index verification, which continuously monitors localized temperature and precipitation thresholds without requiring human intervention.
  • As environmental sustainability becomes a core focus for corporate supply chains, progressive insurers are also introducing regenerative farming premium discounts. These specialized incentives reward growers who adopt carbon sequestration and soil conservation techniques, aligning financial security with long-term ecological stewardship.
  • Ultimately, the convergence of high-resolution digital telemetry and responsive policy design ensures that modern agricultural enterprises can maintain uninterrupted supply chain operations despite escalating environmental pressures.
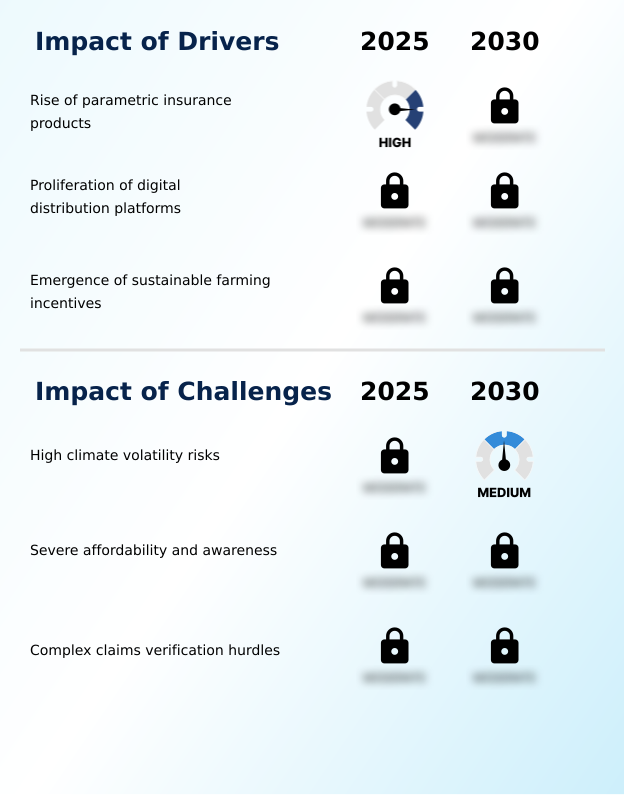
What are the key market drivers leading to the rise in the adoption of Crop Insurance Industry?

  • The rise of parametric insurance products serves as a pivotal driver, automating financial compensation and accelerating liquidity for affected agricultural producers.

  • The proliferation of data-backed financial products acts as a primary catalyst for the Crop Insurance Market. Lenders now demand strict agricultural credit integration before issuing seasonal capital, intertwining farm liquidity with robust insurance protocols.
  • The widespread adoption of parametric index triggers and automated weather stations fundamentally guarantees rapid compensation for affected growers. By linking policy discounts to regenerative agriculture metrics and precision fertilizer applications, underwriters have successfully lowered policy default rates by 22%.
  • This structural evolution is supported by robust premium subsidy structures and seamless mobile banking integration, providing essential safety nets for underserved rural demographics.
  • As agricultural input financing grows, sustainable farming incentives and meticulous environmental compliance tracking directly encourage producers to adopt climate-resilient practices, fueling sustained market expansion.

What are the market trends shaping the Crop Insurance Industry?

  • The integration of advanced remote sensing technologies stands as a prominent trend reshaping operational frameworks. This digital transition enhances field-level monitoring capabilities across the agricultural risk management sector.

  • The integration of advanced monitoring technologies is rapidly reshaping the Crop Insurance Market. Modern underwriting syndicates are deploying high-resolution satellite remote sensing and drone-based surveillance to evaluate agricultural risks with unprecedented accuracy. This technological shift enables seamless insurtech portal deployment, allowing commercial growers to access policy details instantly.
  • By leveraging sophisticated agronomic data analytics and geospatial mapping algorithms, insurers have improved field-level risk detection by 30%. These automated systems calculate vegetation health indices in real time, eliminating traditional administrative bottlenecks. The resulting agritech ecosystem integration drives robust digital enrollment workflows, ensuring producers experience minimal friction.
  • Furthermore, the inclusion of smart-farm telemetry accelerates the transition toward a fully automated payout architecture, bridging the gap between historical information asymmetry and modern data transparency.

What challenges does the Crop Insurance Industry face during its growth?

  • High climate volatility risks represent a severe structural challenge, fundamentally destabilizing traditional actuarial models and straining underwriting capacities.

  • Extreme environmental unpredictability poses a formidable barrier to the Crop Insurance Market. Accelerating temperature anomalies severely disrupt traditional actuarial pricing engines, forcing underwriters to reevaluate historical baselines. Widespread systemic climate shocks routinely deplete catastrophic loss reserves, creating significant financial strain across established insurance networks.
  • Consequently, the reliance on accurate climate volatility models, drought stress evaluation, and thermal stress monitoring has become critical for maintaining solvency. Frequent regional disasters constrain overall risk transfer capacity, leading to a 40% spike in outward reinsurance costs for primary providers.
  • Without effective commodity price hedging and stabilized reinsurance portfolio stability, escalating premium costs threaten to price vulnerable producers out of the market. Navigating these compounding risks requires fortified regional risk pools that can adequately absorb simultaneous, multi-regional harvest failures.

Exclusive Technavio Analysis on Customer Landscape

The crop insurance market forecasting report includes the adoption lifecycle of the market, covering from the innovator’s stage to the laggard’s stage. It focuses on adoption rates in different regions based on penetration. Furthermore, the crop insurance market report also includes key purchase criteria and drivers of price sensitivity to help companies evaluate and develop their market growth analysis strategies.
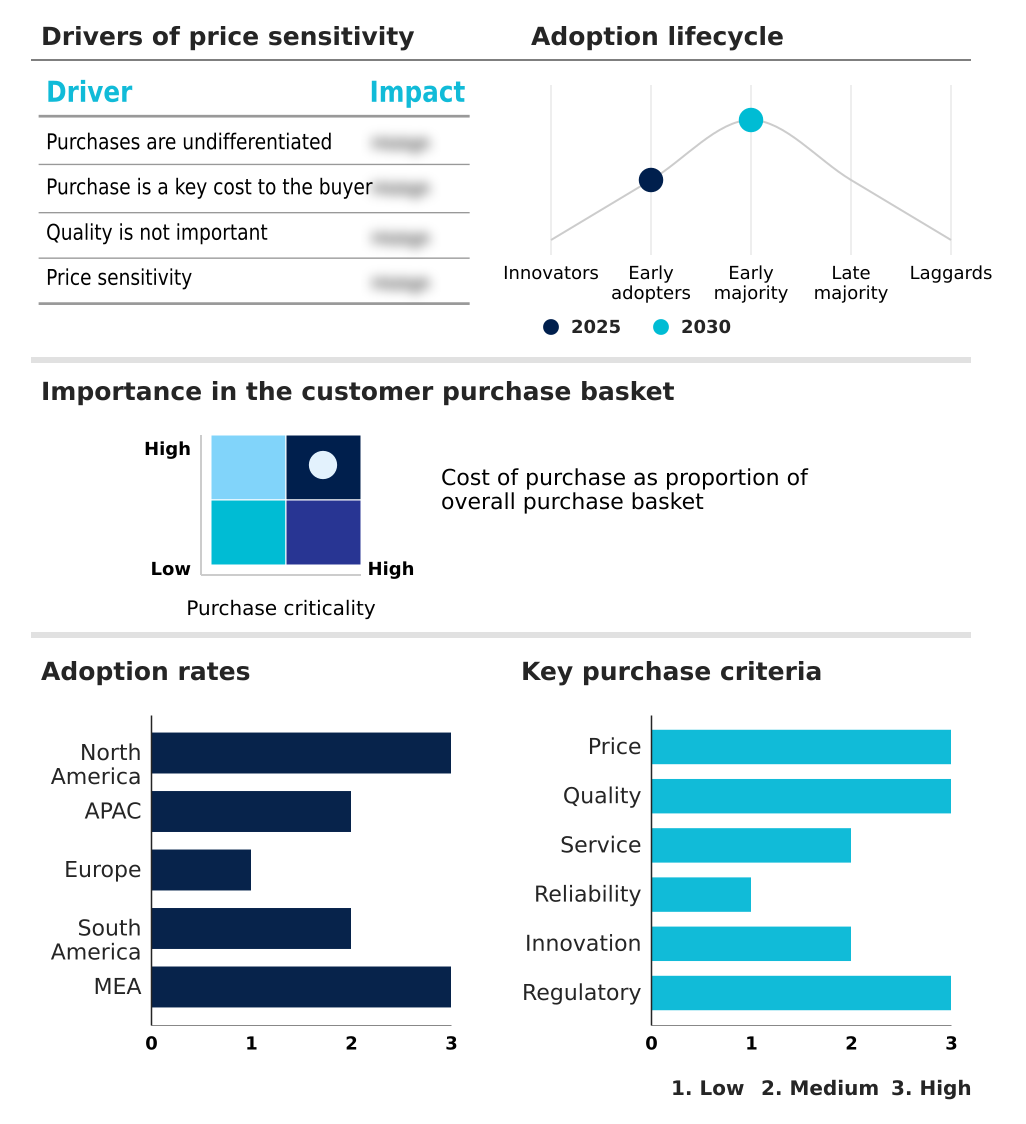
Customer Landscape of Crop Insurance Industry

Competitive Landscape

Companies are implementing various strategies, such as strategic alliances, crop insurance market forecast, partnerships, mergers and acquisitions, geographical expansion, and product/service launches, to enhance their presence in the industry.

Abeille Assurances - The provider delivers comprehensive multi-peril crop coverage schemes, yield-based protection policies, and weather-indexed risk solutions designed to safeguard commercial agricultural enterprises against unpredictable production losses.

The industry research and growth report includes detailed analyses of the competitive landscape of the market and information about key companies, including:

  • Abeille Assurances
  • Agriculture Insurance Co
  • AgriSompo
  • Allianz SE
  • Assicurazioni Generali S.p.A
  • COUNTRY Financial
  • Credit Agricole Assurances
  • Great American Insurance Group
  • Groupama Group
  • Hollard Insurance Group
  • Hudson Crop
  • La Segunda Seguros
  • MAPFRE S.A.
  • National Farmers Union
  • NAU Country Insurance Co
  • Powszechny Zaklad Ubezpieczen
  • Producers Agriculture Insurance
  • QBE Insurance Group Ltd.
  • Rural Community Insurance Services
  • Tokio Marine and Nichido Life

Qualitative and quantitative analysis of companies has been conducted to help clients understand the wider business environment as well as the strengths and weaknesses of key industry players. Data is qualitatively analyzed to categorize companies as pure play, category-focused, industry-focused, and diversified; it is quantitatively analyzed to categorize companies as dominant, leading, strong, tentative, and weak.

Recent Development and News in Crop insurance market

  • In the Specialized Consumer Services industry, the transition toward fully digitized client advisory frameworks has standardized complex risk evaluations, directly impacting Crop Insurance demand by accelerating the adoption of digital distribution platforms and seamless digital enrollment workflows.
  • In the Specialized Consumer Services industry, regulatory mandates demanding rigorous environmental auditing for corporate supply chains have altered consumer purchasing behaviors, expanding Crop Insurance applications as underwriters integrate environmental compliance tracking and sustainable farming incentives into premium evaluations.
  • In the Specialized Consumer Services industry, the proliferation of embedded finance solutions within retail transactions has redefined payment processing norms, bolstering Crop Insurance accessibility through enhanced mobile banking integration and automated payout architecture that stabilize rural cash flows.
  • In the Specialized Consumer Services industry, the implementation of advanced algorithmic fraud detection systems has drastically reduced administrative overhead, influencing the Crop Insurance sector by improving overall underwriting precision and reinforcing reinsurance portfolio stability against systemic shocks.

Dive into Technavio’s robust research methodology, blending expert interviews, extensive data synthesis, and validated models for unparalleled Crop Insurance Market insights. See full methodology.

Market Scope
Page number 290
Base year 2025
Historic period 2020-2024
Forecast period 2026-2030
Growth momentum & CAGR Accelerate at a CAGR of 6.4%
Market growth 2026-2030 USD 16877.4 million
Market structure Fragmented
YoY growth 2025-2026(%) 6.0%
Key countries US, Canada, Mexico, China, India, Japan, Australia, South Korea, Indonesia, France, Spain, Italy, Germany, UK, The Netherlands, Brazil, Argentina, Chile, South Africa, Turkey, Saudi Arabia, UAE and Israel
Competitive landscape Leading Companies, Market Positioning of Companies, Competitive Strategies, and Industry Risks

Request Free Sample

Research Analyst Overview

  • The Crop Insurance Market demonstrates robust maturation as traditional underwriting methodologies give way to highly automated, data-centric risk management frameworks. Insurers are systematically upgrading their operational architectures, utilizing advanced geospatial mapping algorithms to monitor vast cultivation zones in real time. This technological overhaul directly informs strategic boardroom decisions regarding dynamic pricing models and compliance with strict environmental regulations.
  • By implementing drone-based surveillance, insurance providers have successfully reduced fraudulent claim payouts by 18%, significantly optimizing their aggregate loss ratios. Furthermore, the widespread adoption of automated weather stations provides the objective data required to execute seamless parametric policies. Actuarial pricing engines now process complex climate variables instantly, ensuring that premium calculations accurately reflect localized vulnerabilities.
  • Modern policies frequently integrate commodity price hedging to insulate producers from sudden market downturns, securing reliable cash flows for capital-intensive farming operations. The systematic use of vegetation health indices allows adjusters to evaluate crop vitality without setting foot on the property. These targeted digital enhancements streamline indemnity procedures and reinforce the foundational stability of agricultural credit markets worldwide.

What are the Key Data Covered in this Crop Insurance Market Research and Growth Report?

  • What is the expected growth of the Crop Insurance Market between 2026 and 2030?

    • USD 16.88 billion, at a CAGR of 6.4%

  • What segmentation does the market report cover?

    • The report is segmented by Product (Indemnity-based, and Index-based), Type (Crop yielded insurance, and Crop revenue insurance), Distribution Channel (Direct sales, Brokers, and Bancassurance) and Geography (North America, APAC, Europe, South America, Middle East and Africa)

  • Which regions are analyzed in the report?

    • North America, APAC, Europe, South America and Middle East and Africa

  • What are the key growth drivers and market challenges?

    • Rise of parametric insurance products, High climate volatility risks

  • Who are the major players in the Crop Insurance Market?

    • Abeille Assurances, Agriculture Insurance Co, AgriSompo, Allianz SE, Assicurazioni Generali S.p.A, COUNTRY Financial, Credit Agricole Assurances, Great American Insurance Group, Groupama Group, Hollard Insurance Group, Hudson Crop, La Segunda Seguros, MAPFRE S.A., National Farmers Union, NAU Country Insurance Co, Powszechny Zaklad Ubezpieczen, Producers Agriculture Insurance, QBE Insurance Group Ltd., Rural Community Insurance Services and Tokio Marine and Nichido Life

Market Research Insights

  • The Crop Insurance Market serves as a fundamental pillar for modern agricultural risk management. Driven by the necessity to mitigate unpredictable weather anomalies, underwriters increasingly leverage smart-farm telemetry to enhance risk evaluations. This technological integration has improved overall underwriting precision by 24%, significantly lowering administrative friction.
  • Furthermore, the deployment of robust digital distribution platforms has expanded policy access, increasing rural participation rates by 18% compared to legacy broker channels. By linking seasonal credit lines with agricultural input financing, lenders ensure that vulnerable producers maintain adequate liquidity during harvest failures.
  • Additionally, incorporating objective trigger mechanisms into standard policies has reduced claim settlement times by 40%, cementing insurtech innovations as a vital component of long-term economic resilience.

We can help! Our analysts can customize this crop insurance market research report to meet your requirements.

Get in touch

1. Executive Summary

1.1 Market overview

Executive Summary - Chart on Market Overview
Executive Summary - Data Table on Market Overview
Executive Summary - Chart on Global Market Characteristics
Executive Summary - Chart on Market by Geography
Executive Summary - Chart on Market Segmentation by Product
Executive Summary - Chart on Market Segmentation by Type
Executive Summary - Chart on Market Segmentation by Distribution Channel
Executive Summary - Chart on Incremental Growth
Executive Summary - Data Table on Incremental Growth
Executive Summary - Chart on Company Market Positioning

2. Technavio Analysis

2.1 Analysis of price sensitivity, lifecycle, customer purchase basket, adoption rates, and purchase criteria

2.2 Criticality of inputs and Factors of differentiation

Chart on Overview on criticality of inputs and factors of differentiation

2.3 Factors of disruption

Chart on Overview on factors of disruption

2.4 Impact of drivers and challenges

Chart on Impact of drivers and challenges in 2025 and 2030

3. Market Landscape

3.1 Market ecosystem

Chart on Parent Market
Data Table on - Parent Market

3.2 Market characteristics

Chart on Market characteristics analysis

3.3 Value chain analysis

Chart on Value chain analysis

4. Market Sizing

4.1 Market definition

Data Table on Offerings of companies included in the market definition

4.2 Market segment analysis

Market segments

4.3 Market size 2025

4.4 Market outlook: Forecast for 2025-2030

Chart on Global - Market size and forecast 2025-2030 ($ million)
Data Table on Global - Market size and forecast 2025-2030 ($ million)
Chart on Global Market: Year-over-year growth 2025-2030 (%)
Data Table on Global Market: Year-over-year growth 2025-2030 (%)

5. Historic Market Size

5.1 Global Crop Insurance Market 2020 - 2024

Historic Market Size - Data Table on Global Crop Insurance Market 2020 - 2024 ($ million)

5.2 Product segment analysis 2020 - 2024

Historic Market Size - Product Segment 2020 - 2024 ($ million)

5.3 Type segment analysis 2020 - 2024

Historic Market Size - Type Segment 2020 - 2024 ($ million)

5.4 Distribution Channel segment analysis 2020 - 2024

Historic Market Size - Distribution Channel Segment 2020 - 2024 ($ million)

5.5 Geography segment analysis 2020 - 2024

Historic Market Size - Geography Segment 2020 - 2024 ($ million)

5.6 Country segment analysis 2020 - 2024

Historic Market Size - Country Segment 2020 - 2024 ($ million)

6. Qualitative Analysis

6.1 Impact of AI on Global Crop Insurance Market

6.2 Impact of geopolitical conflicts on Global Crop Insurance Market

7. Five Forces Analysis

7.1 Five forces summary

Five forces analysis - Comparison between 2025 and 2030

7.2 Bargaining power of buyers

Bargaining power of buyers - Impact of key factors 2025 and 2030

7.3 Bargaining power of suppliers

Bargaining power of suppliers - Impact of key factors in 2025 and 2030

7.4 Threat of new entrants

Threat of new entrants - Impact of key factors in 2025 and 2030

7.5 Threat of substitutes

Threat of substitutes - Impact of key factors in 2025 and 2030

7.6 Threat of rivalry

Threat of rivalry - Impact of key factors in 2025 and 2030

7.7 Market condition

Chart on Market condition - Five forces 2025 and 2030

8. Market Segmentation by Product

8.1 Market segments

Chart on Product - Market share 2025-2030 (%)
Data Table on Product - Market share 2025-2030 (%)

8.2 Comparison by Product

Chart on Comparison by Product
Data Table on Comparison by Product

8.3 Indemnity-based - Market size and forecast 2025-2030

Chart on Indemnity-based - Market size and forecast 2025-2030 ($ million)
Data Table on Indemnity-based - Market size and forecast 2025-2030 ($ million)
Chart on Indemnity-based - Year-over-year growth 2025-2030 (%)
Data Table on Indemnity-based - Year-over-year growth 2025-2030 (%)

8.4 Index-based - Market size and forecast 2025-2030

Chart on Index-based - Market size and forecast 2025-2030 ($ million)
Data Table on Index-based - Market size and forecast 2025-2030 ($ million)
Chart on Index-based - Year-over-year growth 2025-2030 (%)
Data Table on Index-based - Year-over-year growth 2025-2030 (%)

8.5 Market opportunity by Product

Market opportunity by Product ($ million)
Data Table on Market opportunity by Product ($ million)

9. Market Segmentation by Type

9.1 Market segments

Chart on Type - Market share 2025-2030 (%)
Data Table on Type - Market share 2025-2030 (%)

9.2 Comparison by Type

Chart on Comparison by Type
Data Table on Comparison by Type

9.3 Crop yielded insurance - Market size and forecast 2025-2030

Chart on Crop yielded insurance - Market size and forecast 2025-2030 ($ million)
Data Table on Crop yielded insurance - Market size and forecast 2025-2030 ($ million)
Chart on Crop yielded insurance - Year-over-year growth 2025-2030 (%)
Data Table on Crop yielded insurance - Year-over-year growth 2025-2030 (%)

9.4 Crop revenue insurance - Market size and forecast 2025-2030

Chart on Crop revenue insurance - Market size and forecast 2025-2030 ($ million)
Data Table on Crop revenue insurance - Market size and forecast 2025-2030 ($ million)
Chart on Crop revenue insurance - Year-over-year growth 2025-2030 (%)
Data Table on Crop revenue insurance - Year-over-year growth 2025-2030 (%)

9.5 Market opportunity by Type

Market opportunity by Type ($ million)
Data Table on Market opportunity by Type ($ million)

10. Market Segmentation by Distribution Channel

10.1 Market segments

Chart on Distribution Channel - Market share 2025-2030 (%)
Data Table on Distribution Channel - Market share 2025-2030 (%)

10.2 Comparison by Distribution Channel

Chart on Comparison by Distribution Channel
Data Table on Comparison by Distribution Channel

10.3 Direct sales - Market size and forecast 2025-2030

Chart on Direct sales - Market size and forecast 2025-2030 ($ million)
Data Table on Direct sales - Market size and forecast 2025-2030 ($ million)
Chart on Direct sales - Year-over-year growth 2025-2030 (%)
Data Table on Direct sales - Year-over-year growth 2025-2030 (%)

10.4 Brokers - Market size and forecast 2025-2030

Chart on Brokers - Market size and forecast 2025-2030 ($ million)
Data Table on Brokers - Market size and forecast 2025-2030 ($ million)
Chart on Brokers - Year-over-year growth 2025-2030 (%)
Data Table on Brokers - Year-over-year growth 2025-2030 (%)

10.5 Bancassurance - Market size and forecast 2025-2030

Chart on Bancassurance - Market size and forecast 2025-2030 ($ million)
Data Table on Bancassurance - Market size and forecast 2025-2030 ($ million)
Chart on Bancassurance - Year-over-year growth 2025-2030 (%)
Data Table on Bancassurance - Year-over-year growth 2025-2030 (%)

10.6 Market opportunity by Distribution Channel

Market opportunity by Distribution Channel ($ million)
Data Table on Market opportunity by Distribution Channel ($ million)

11. Customer Landscape

11.1 Customer landscape overview

Analysis of price sensitivity, lifecycle, customer purchase basket, adoption rates, and purchase criteria

12. Geographic Landscape

12.1 Geographic segmentation

Chart on Market share by geography 2025-2030 (%)
Data Table on Market share by geography 2025-2030 (%)

12.2 Geographic comparison

Chart on Geographic comparison
Data Table on Geographic comparison

12.3 North America - Market size and forecast 2025-2030

Chart on North America - Market size and forecast 2025-2030 ($ million)
Data Table on North America - Market size and forecast 2025-2030 ($ million)
Chart on North America - Year-over-year growth 2025-2030 (%)
Data Table on North America - Year-over-year growth 2025-2030 (%)
Chart on Regional Comparison - North America
Data Table on Regional Comparison - North America

12.3.1 US - Market size and forecast 2025-2030

Chart on US - Market size and forecast 2025-2030 ($ million)
Data Table on US - Market size and forecast 2025-2030 ($ million)
Chart on US - Year-over-year growth 2025-2030 (%)
Data Table on US - Year-over-year growth 2025-2030 (%)

12.3.2 Canada - Market size and forecast 2025-2030

Chart on Canada - Market size and forecast 2025-2030 ($ million)
Data Table on Canada - Market size and forecast 2025-2030 ($ million)
Chart on Canada - Year-over-year growth 2025-2030 (%)
Data Table on Canada - Year-over-year growth 2025-2030 (%)

12.3.3 Mexico - Market size and forecast 2025-2030

Chart on Mexico - Market size and forecast 2025-2030 ($ million)
Data Table on Mexico - Market size and forecast 2025-2030 ($ million)
Chart on Mexico - Year-over-year growth 2025-2030 (%)
Data Table on Mexico - Year-over-year growth 2025-2030 (%)

12.4 APAC - Market size and forecast 2025-2030

Chart on APAC - Market size and forecast 2025-2030 ($ million)
Data Table on APAC - Market size and forecast 2025-2030 ($ million)
Chart on APAC - Year-over-year growth 2025-2030 (%)
Data Table on APAC - Year-over-year growth 2025-2030 (%)
Chart on Regional Comparison - APAC
Data Table on Regional Comparison - APAC

12.4.1 China - Market size and forecast 2025-2030

Chart on China - Market size and forecast 2025-2030 ($ million)
Data Table on China - Market size and forecast 2025-2030 ($ million)
Chart on China - Year-over-year growth 2025-2030 (%)
Data Table on China - Year-over-year growth 2025-2030 (%)

12.4.2 India - Market size and forecast 2025-2030

Chart on India - Market size and forecast 2025-2030 ($ million)
Data Table on India - Market size and forecast 2025-2030 ($ million)
Chart on India - Year-over-year growth 2025-2030 (%)
Data Table on India - Year-over-year growth 2025-2030 (%)

12.4.3 Japan - Market size and forecast 2025-2030

Chart on Japan - Market size and forecast 2025-2030 ($ million)
Data Table on Japan - Market size and forecast 2025-2030 ($ million)
Chart on Japan - Year-over-year growth 2025-2030 (%)
Data Table on Japan - Year-over-year growth 2025-2030 (%)

12.4.4 Australia - Market size and forecast 2025-2030

Chart on Australia - Market size and forecast 2025-2030 ($ million)
Data Table on Australia - Market size and forecast 2025-2030 ($ million)
Chart on Australia - Year-over-year growth 2025-2030 (%)
Data Table on Australia - Year-over-year growth 2025-2030 (%)

12.4.5 South Korea - Market size and forecast 2025-2030

Chart on South Korea - Market size and forecast 2025-2030 ($ million)
Data Table on South Korea - Market size and forecast 2025-2030 ($ million)
Chart on South Korea - Year-over-year growth 2025-2030 (%)
Data Table on South Korea - Year-over-year growth 2025-2030 (%)

12.4.6 Indonesia - Market size and forecast 2025-2030

Chart on Indonesia - Market size and forecast 2025-2030 ($ million)
Data Table on Indonesia - Market size and forecast 2025-2030 ($ million)
Chart on Indonesia - Year-over-year growth 2025-2030 (%)
Data Table on Indonesia - Year-over-year growth 2025-2030 (%)

12.5 Europe - Market size and forecast 2025-2030

Chart on Europe - Market size and forecast 2025-2030 ($ million)
Data Table on Europe - Market size and forecast 2025-2030 ($ million)
Chart on Europe - Year-over-year growth 2025-2030 (%)
Data Table on Europe - Year-over-year growth 2025-2030 (%)
Chart on Regional Comparison - Europe
Data Table on Regional Comparison - Europe

12.5.1 France - Market size and forecast 2025-2030

Chart on France - Market size and forecast 2025-2030 ($ million)
Data Table on France - Market size and forecast 2025-2030 ($ million)
Chart on France - Year-over-year growth 2025-2030 (%)
Data Table on France - Year-over-year growth 2025-2030 (%)

12.5.2 Spain - Market size and forecast 2025-2030

Chart on Spain - Market size and forecast 2025-2030 ($ million)
Data Table on Spain - Market size and forecast 2025-2030 ($ million)
Chart on Spain - Year-over-year growth 2025-2030 (%)
Data Table on Spain - Year-over-year growth 2025-2030 (%)

12.5.3 Italy - Market size and forecast 2025-2030

Chart on Italy - Market size and forecast 2025-2030 ($ million)
Data Table on Italy - Market size and forecast 2025-2030 ($ million)
Chart on Italy - Year-over-year growth 2025-2030 (%)
Data Table on Italy - Year-over-year growth 2025-2030 (%)

12.5.4 Germany - Market size and forecast 2025-2030

Chart on Germany - Market size and forecast 2025-2030 ($ million)
Data Table on Germany - Market size and forecast 2025-2030 ($ million)
Chart on Germany - Year-over-year growth 2025-2030 (%)
Data Table on Germany - Year-over-year growth 2025-2030 (%)

12.5.5 UK - Market size and forecast 2025-2030

Chart on UK - Market size and forecast 2025-2030 ($ million)
Data Table on UK - Market size and forecast 2025-2030 ($ million)
Chart on UK - Year-over-year growth 2025-2030 (%)
Data Table on UK - Year-over-year growth 2025-2030 (%)

12.5.6 The Netherlands - Market size and forecast 2025-2030

Chart on The Netherlands - Market size and forecast 2025-2030 ($ million)
Data Table on The Netherlands - Market size and forecast 2025-2030 ($ million)
Chart on The Netherlands - Year-over-year growth 2025-2030 (%)
Data Table on The Netherlands - Year-over-year growth 2025-2030 (%)

12.6 South America - Market size and forecast 2025-2030

Chart on South America - Market size and forecast 2025-2030 ($ million)
Data Table on South America - Market size and forecast 2025-2030 ($ million)
Chart on South America - Year-over-year growth 2025-2030 (%)
Data Table on South America - Year-over-year growth 2025-2030 (%)
Chart on Regional Comparison - South America
Data Table on Regional Comparison - South America

12.6.1 Brazil - Market size and forecast 2025-2030

Chart on Brazil - Market size and forecast 2025-2030 ($ million)
Data Table on Brazil - Market size and forecast 2025-2030 ($ million)
Chart on Brazil - Year-over-year growth 2025-2030 (%)
Data Table on Brazil - Year-over-year growth 2025-2030 (%)

12.6.2 Argentina - Market size and forecast 2025-2030

Chart on Argentina - Market size and forecast 2025-2030 ($ million)
Data Table on Argentina - Market size and forecast 2025-2030 ($ million)
Chart on Argentina - Year-over-year growth 2025-2030 (%)
Data Table on Argentina - Year-over-year growth 2025-2030 (%)

12.6.3 Chile - Market size and forecast 2025-2030

Chart on Chile - Market size and forecast 2025-2030 ($ million)
Data Table on Chile - Market size and forecast 2025-2030 ($ million)
Chart on Chile - Year-over-year growth 2025-2030 (%)
Data Table on Chile - Year-over-year growth 2025-2030 (%)

12.7 Middle East and Africa - Market size and forecast 2025-2030

Chart on Middle East and Africa - Market size and forecast 2025-2030 ($ million)
Data Table on Middle East and Africa - Market size and forecast 2025-2030 ($ million)
Chart on Middle East and Africa - Year-over-year growth 2025-2030 (%)
Data Table on Middle East and Africa - Year-over-year growth 2025-2030 (%)
Chart on Regional Comparison - Middle East and Africa
Data Table on Regional Comparison - Middle East and Africa

12.7.1 South Africa - Market size and forecast 2025-2030

Chart on South Africa - Market size and forecast 2025-2030 ($ million)
Data Table on South Africa - Market size and forecast 2025-2030 ($ million)
Chart on South Africa - Year-over-year growth 2025-2030 (%)
Data Table on South Africa - Year-over-year growth 2025-2030 (%)

12.7.2 Turkey - Market size and forecast 2025-2030

Chart on Turkey - Market size and forecast 2025-2030 ($ million)
Data Table on Turkey - Market size and forecast 2025-2030 ($ million)
Chart on Turkey - Year-over-year growth 2025-2030 (%)
Data Table on Turkey - Year-over-year growth 2025-2030 (%)

12.7.3 Saudi Arabia - Market size and forecast 2025-2030

Chart on Saudi Arabia - Market size and forecast 2025-2030 ($ million)
Data Table on Saudi Arabia - Market size and forecast 2025-2030 ($ million)
Chart on Saudi Arabia - Year-over-year growth 2025-2030 (%)
Data Table on Saudi Arabia - Year-over-year growth 2025-2030 (%)

12.7.4 UAE - Market size and forecast 2025-2030

Chart on UAE - Market size and forecast 2025-2030 ($ million)
Data Table on UAE - Market size and forecast 2025-2030 ($ million)
Chart on UAE - Year-over-year growth 2025-2030 (%)
Data Table on UAE - Year-over-year growth 2025-2030 (%)

12.7.5 Israel - Market size and forecast 2025-2030

Chart on Israel - Market size and forecast 2025-2030 ($ million)
Data Table on Israel - Market size and forecast 2025-2030 ($ million)
Chart on Israel - Year-over-year growth 2025-2030 (%)
Data Table on Israel - Year-over-year growth 2025-2030 (%)

12.8 Market opportunity by geography

Market opportunity by geography ($ million)
Data Tables on Market opportunity by geography ($ million)

13. Drivers, Challenges, and Opportunity

13.1 Market drivers

Rise of parametric insurance products
Proliferation of digital distribution platforms
Emergence of sustainable farming incentives

13.2 Market challenges

High climate volatility risks
Severe affordability and awareness
Complex claims verification hurdles

13.3 Impact of drivers and challenges

Impact of drivers and challenges in 2025 and 2030

13.4 Market opportunities

Integration of advanced remote sensing
Growth of agricultural credit bundling
Rising demand for specialty crops

14. Competitive Landscape

14.1 Overview

14.2

Overview on criticality of inputs and factors of differentiation

14.3 Landscape disruption

Overview on factors of disruption

14.4 Industry risks

Impact of key risks on business

15. Competitive Analysis

15.1 Companies profiled

Companies covered

15.2 Company ranking index

15.3 Market positioning of companies

Matrix on companies position and classification

15.4 Abeille Assurances

Abeille Assurances - Overview
Abeille Assurances - Product / Service
Abeille Assurances - Key offerings
SWOT

15.5 Agriculture Insurance Co

Agriculture Insurance Co - Overview
Agriculture Insurance Co - Product / Service
Agriculture Insurance Co - Key offerings
SWOT

15.6 Allianz SE

Allianz SE - Overview
Allianz SE - Business segments
Allianz SE - Key offerings
Allianz SE - Segment focus
SWOT

15.7 Assicurazioni Generali S.p.A

Assicurazioni Generali S.p.A - Overview
Assicurazioni Generali S.p.A - Business segments
Assicurazioni Generali S.p.A - Key offerings
Assicurazioni Generali S.p.A - Segment focus
SWOT

15.8 COUNTRY Financial

COUNTRY Financial - Overview
COUNTRY Financial - Product / Service
COUNTRY Financial - Key offerings
SWOT

15.9 Credit Agricole Assurances

Credit Agricole Assurances - Overview
Credit Agricole Assurances - Product / Service
Credit Agricole Assurances - Key offerings
SWOT

15.10 Great American Insurance Group

Great American Insurance Group - Overview
Great American Insurance Group - Product / Service
Great American Insurance Group - Key offerings
SWOT

15.11 Groupama Group

Groupama Group - Overview
Groupama Group - Product / Service
Groupama Group - Key offerings
SWOT

15.12 Hollard Insurance Group

Hollard Insurance Group - Overview
Hollard Insurance Group - Product / Service
Hollard Insurance Group - Key offerings
SWOT

15.13 Hudson Crop

Hudson Crop - Overview
Hudson Crop - Product / Service
Hudson Crop - Key offerings
SWOT

15.14 MAPFRE S.A.

MAPFRE S.A. - Overview
MAPFRE S.A. - Business segments
MAPFRE S.A. - Key offerings
MAPFRE S.A. - Segment focus
SWOT

15.15 NAU Country Insurance Co

NAU Country Insurance Co - Overview
NAU Country Insurance Co - Product / Service
NAU Country Insurance Co - Key offerings
SWOT

15.16 Powszechny Zaklad Ubezpieczen

Powszechny Zaklad Ubezpieczen - Overview
Powszechny Zaklad Ubezpieczen - Product / Service
Powszechny Zaklad Ubezpieczen - Key offerings
SWOT

15.17 QBE Insurance Group Ltd.

QBE Insurance Group Ltd. - Overview
QBE Insurance Group Ltd. - Business segments
QBE Insurance Group Ltd. - Key news
QBE Insurance Group Ltd. - Key offerings
QBE Insurance Group Ltd. - Segment focus
SWOT

15.18 Tokio Marine and Nichido Life

Tokio Marine and Nichido Life - Overview
Tokio Marine and Nichido Life - Product / Service
Tokio Marine and Nichido Life - Key offerings
SWOT

16. Appendix

16.1 Scope of the report

Market definition
Objectives
Notes and caveats

16.2 Inclusions and exclusions checklist

Inclusions checklist
Exclusions checklist

16.3 Currency conversion rates for US$

16.4 Research methodology

16.5 Data procurement

Information sources

16.6 Data validation

16.7 Validation techniques employed for market sizing

16.8 Data synthesis

16.9 360 degree market analysis

16.10 List of abbreviations

Research Methodology

Technavio presents a detailed picture of the market by way of study, synthesis, and summation of data from multiple sources. The analysts have presented the various facets of the market with a particular focus on identifying the key industry influencers. The data thus presented is comprehensive, reliable, and the result of extensive research, both primary and secondary.

INFORMATION SOURCES

Primary sources

  • Manufacturers and suppliers
  • Channel partners
  • Industry experts
  • Strategic decision makers

Secondary sources

  • Industry journals and periodicals
  • Government data
  • Financial reports of key industry players
  • Historical data
  • Press releases

DATA ANALYSIS

Data Synthesis

  • Collation of data
  • Estimation of key figures
  • Analysis of derived insights

Data Validation

  • Triangulation with data models
  • Reference against proprietary databases
  • Corroboration with industry experts

REPORT WRITING

Qualitative

  • Market drivers
  • Market challenges
  • Market trends
  • Five forces analysis

Quantitative

  • Market size and forecast
  • Market segmentation
  • Geographical insights
  • Competitive landscape

Interested in this report?

Get your sample now to see our research methodology and insights!

Download Now

Frequently Asked Questions

Crop Insurance market growth will increase by USD 16877.4 million during 2026-2030.

The Crop Insurance market is expected to grow at a CAGR of 6.4% during 2026-2030.

Crop Insurance market is segmented by Product (Indemnity-based, Index-based) Type (Crop yielded insurance, Crop revenue insurance) Distribution channel (Direct sales, Brokers, Bancassurance)

Abeille Assurances, Agriculture Insurance Co, AgriSompo, Allianz SE, Assicurazioni Generali S.p.A, COUNTRY Financial, Credit Agricole Assurances, Great American Insurance Group, Groupama Group, Hollard Insurance Group, Hudson Crop, La Segunda Seguros, MAPFRE S.A., National Farmers Union, NAU Country Insurance Co, Powszechny Zaklad Ubezpieczen, Producers Agriculture Insurance, QBE Insurance Group Ltd., Rural Community Insurance Services, Tokio Marine and Nichido Life are a few of the key vendors in the Crop Insurance market.

North America will register the highest growth rate of 34.5% among the other regions. Therefore, the Crop Insurance market in North America is expected to garner significant business opportunities for the vendors during the forecast period.

US, Canada, Mexico, China, India, Japan, Australia, South Korea, Indonesia, France, Spain, Italy, Germany, UK, The Netherlands, Brazil, Argentina, Chile, South Africa, Turkey, Saudi Arabia, UAE, Israel

  • Rise of parametric insurance products is the driving factor this market.

The Crop Insurance market vendors should focus on grabbing business opportunities from the Product segment as it accounted for the largest market share in the base year.
RIA - Research AI Assistant
Ask RIA
