
Crowd Analytics Market Analysis, Size, and Forecast 2026-2030: North America (US, Canada, and Mexico), Europe (Germany, UK, and France), APAC (China, Japan, and India), South America (Brazil, Argentina, and Chile), Middle East and Africa (Saudi Arabia, UAE, and South Africa), and Rest of World (ROW)

Crowd Analytics Market Analysis, Size, and Forecast 2026-2030:
North America (US, Canada, and Mexico), Europe (Germany, UK, and France), APAC (China, Japan, and India), South America (Brazil, Argentina, and Chile), Middle East and Africa (Saudi Arabia, UAE, and South Africa), and Rest of World (ROW)

Published: Oct 2026 288 Pages SKU: IRTNTR75130

Market Overview at a Glance

$5.24 B
Market Opportunity
25.6%
CAGR 2025 - 2030
41.5%
North America Growth
$1.11 B
Cloud segment 2024

Crowd Analytics Market Size 2026-2030

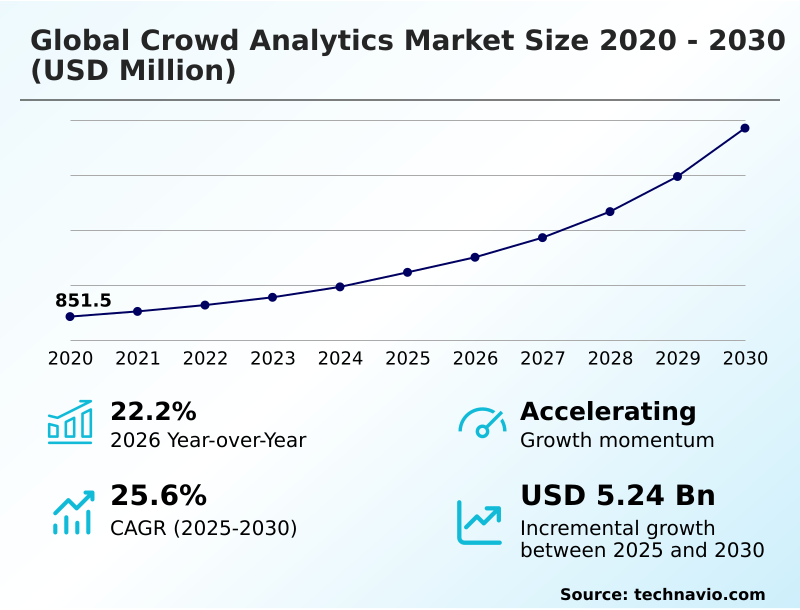
The crowd analytics market size is valued to increase by USD 5.24 billion, at a CAGR of 25.6% from 2025 to 2030. Growing smart city and intelligent urban infrastructure initiatives will drive the crowd analytics market.

Major Market Trends & Insights

  • North America dominated the market and accounted for a 41.5% growth during the forecast period.
  • By Deployment - Cloud segment was valued at USD 1.11 billion in 2024
  • By End-user - Transportation segment accounted for the largest market revenue share in 2024

Market Size & Forecast

  • Market Opportunities: USD 6.85 billion
  • Market Future Opportunities: USD 5.24 billion
  • CAGR from 2025 to 2030 : 25.6%

Market Summary

  • The Crowd Analytics Market functions as a critical component in modern facility management, translating physical movement into actionable spatial utilization metrics. Organizations across sectors leverage predictive intelligence and heat mapping to interpret dwell time tracking and optimize physical space.
  • In a major retail supply chain scenario, administrators utilizing automated occupancy thresholds and demographic profiling algorithms achieved a 20% reduction in checkout wait times compared to traditional manual monitoring systems. This technological shift is primarily driven by expanding intelligent urban infrastructure initiatives, which pull demand for multimodal data fusion to manage urban density effectively.
  • Conversely, stringent biometric data governance acts as a structural challenge; compliance mandates regarding facial obfuscation force developers to continuously engineer complex anonymization protocols, increasing deployment timelines. Through real time visibility dashboards, facility managers harness queue behavior analytics to streamline dynamic resource allocation.
  • By deploying decentralized processing at the edge, organizations improve continuous situational awareness while adapting to privacy compliant tracking requirements.

What will be the Size of the Crowd Analytics Market during the forecast period?
Get Key Insights on Market Forecast (PDF) Get Free Sample

How is the Crowd Analytics Market Segmented?

The crowd analytics industry research report provides comprehensive data (region-wise segment analysis), with forecasts and estimates in "USD million" for the period 2026-2030, as well as historical data from 2020-2024 for the following segments.

  • Deployment
    • Cloud
    • On-premises
  • End-user
    • Transportation
    • Retail
    • Others
  • Component
    • Solution
    • Services
  • Geography
    • North America
      • US
      • Canada
      • Mexico
    • Europe
      • Germany
      • UK
      • France
      • Italy
      • Spain
      • The Netherlands
    • APAC
      • China
      • Japan
      • India
      • South Korea
      • Australia
      • Indonesia
    • South America
      • Brazil
      • Argentina
      • Chile
    • Middle East and Africa
      • Saudi Arabia
      • UAE
      • South Africa
      • Turkey
      • Israel

By Deployment Insights

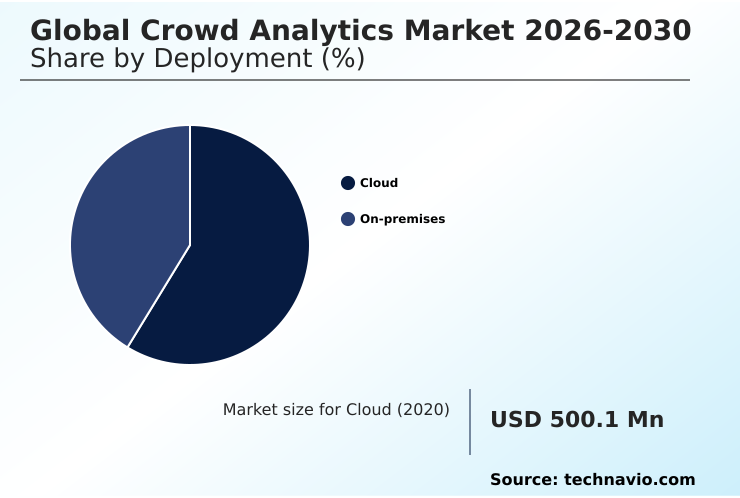
The cloud segment is estimated to witness significant growth during the forecast period.

The cloud deployment segment within the Crowd Analytics structure enables distributed environments to centralize complex video processing pipelines and spatial intelligence operations.

Organizations utilize cloud infrastructure orchestration to manage capacity threshold alerts and footfall analytics across multiple locations without relying on heavy localized hardware. Cloud architectures facilitate continuous situational awareness, allowing operators to aggregate data from camera free sensor networks seamlessly.

By deploying scalable analytics environments, enterprises achieve improved data synchronization, where operational intelligence platforms process data with minimal latency.

Implementation of cloud-based spatial behavior analytics has demonstrated significant operational gains, such as dynamic resource allocation efficiency improved by 25% and physical environment modeling deployment time reduced by 15%.

This centralized approach ensures robust queue density metrics aggregation while maintaining unified facial obfuscation updates across wide-area networks.
Get Free Sample

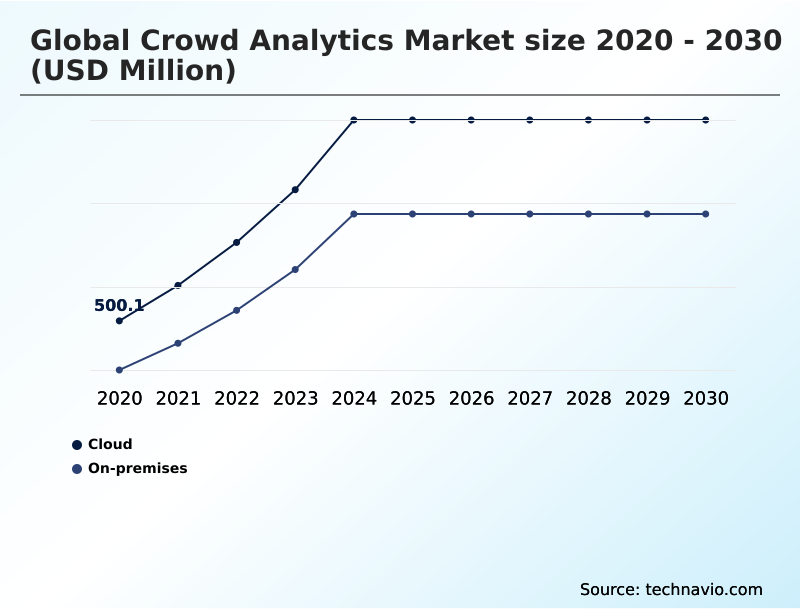
The Cloud segment was valued at USD 1.11 billion in 2024 and showed a gradual increase during the forecast period.
Get Free Sample

Regional Analysis

North America is estimated to contribute 41.5% to the growth of the global market during the forecast period.Technavio’s analysts have elaborately explained the regional trends and drivers that shape the market during the forecast period.
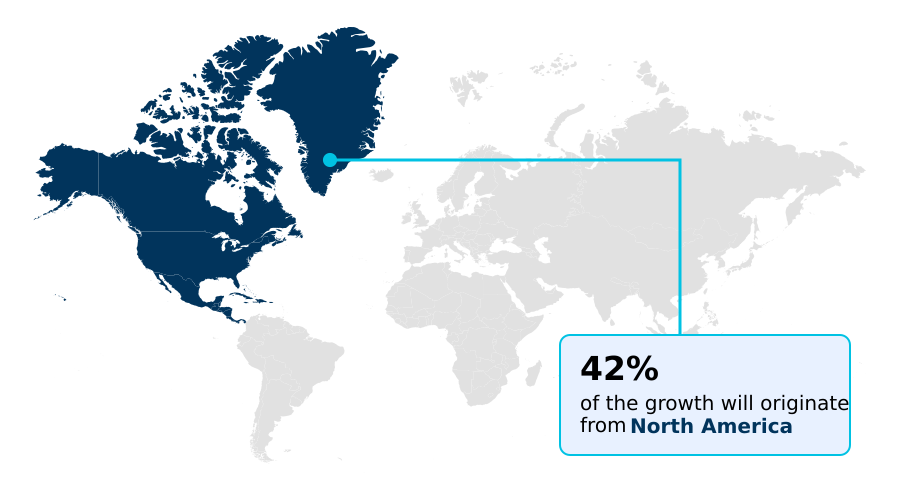
See How Crowd Analytics Market Demand is Rising in North America Get Free Sample

The regional landscape of the Crowd Analytics sector reveals distinct adoption paradigms shaped by regulatory environments and infrastructural readiness.

North America demonstrates a rapid integration of operational intelligence platforms, achieving a 25% higher deployment rate of LiDAR based sensing technologies compared to Europe.

This divergence is largely driven by Europe's strict biometric data governance, which necessitates rigorous anonymization protocols and slows the implementation of advanced facial obfuscation systems by roughly 15%.

Meanwhile, APAC focuses heavily on scaling intelligent urban infrastructure, where automated incident detection and real time passenger flow tracking have reduced urban transit congestion incidents by 12%.

Businesses in North America prioritize dynamic resource allocation through edge computing, optimizing retail and transit hubs. In contrast, European enterprises lean toward camera free sensor networks to ensure privacy compliant tracking while maintaining robust spatial utilization metrics.

Market Dynamics

Our researchers analyzed the data with 2025 as the base year, along with the key drivers, trends, and challenges. A holistic analysis of drivers will help companies refine their marketing strategies to gain a competitive advantage.

  • The integration of sophisticated monitoring systems is reshaping how organizations orchestrate physical environments and manage spatial dynamics. A pivotal transformation in facility administration is the transition toward ai driven predictive crowd intelligence, which empowers operators to anticipate congestion before it materializes.
  • Supply chain logistics and transport hubs integrating these predictive models have realized a 20% improvement in queue processing speed compared to facilities relying on retrospective reporting. This shift requires robust localized hardware, making edge based spatial analytics deployment critical for minimizing latency and ensuring instantaneous response to capacity threshold alerts.
  • As regulatory scrutiny intensifies regarding biometric capture, transportation authorities are heavily prioritizing privacy compliant passenger flow tracking to map commuter journeys without compromising individual anonymity. To achieve comprehensive situational awareness, administrators are implementing multimodal data fusion architectures that seamlessly aggregate inputs from diverse sensor types, creating unified operational dashboards.
  • Within these complex ecosystems, the utilization of lidar based occupancy monitoring systems provides unparalleled accuracy in high-density areas, eliminating the visual limitations associated with traditional optical cameras. These technologies collectively enable transit planners and retail strategists to refine operational planning, optimize staff deployment, and enhance safety protocols while rigorously adhering to data governance mandates.
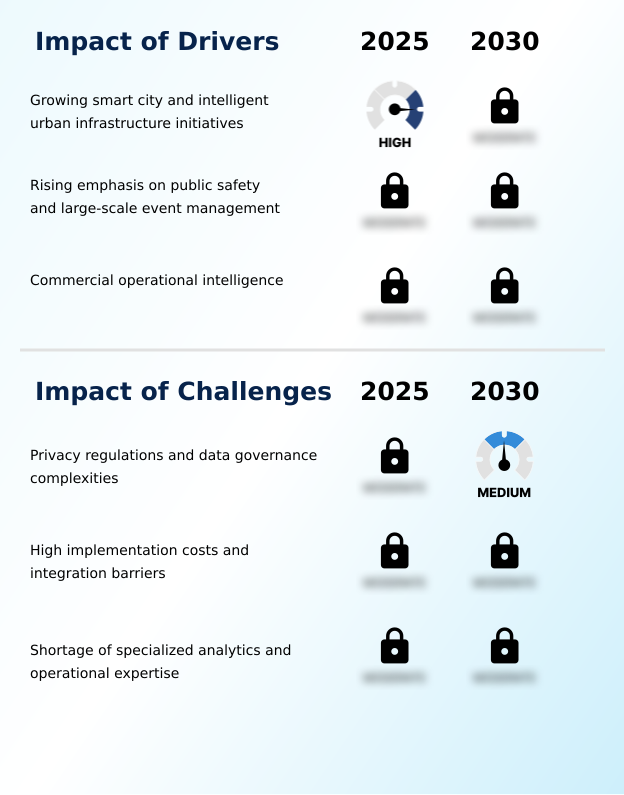
What are the key market drivers leading to the rise in the adoption of Crowd Analytics Industry?

  • The expansion of smart city programs and intelligent urban infrastructure initiatives serves as a primary driver accelerating market adoption.

  • Expanding mandates for intelligent urban infrastructure serve as a primary catalyst driving the integration of sophisticated spatial intelligence platforms. Municipalities and transit authorities urgently require real time passenger flow visibility to manage surging urban densities and optimize public safety protocols.
  • The implementation of robust video processing pipelines and sensor integration enables administrators to translate pedestrian movement tracking into actionable insights.
  • Consequently, facilities utilizing automated incident detection report a 20% reduction in emergency response times, while those deploying proximity detection algorithms have lowered operational staffing costs by 15%.
  • This demand for continuous situational awareness forces the rapid adoption of location intelligence frameworks, allowing operators to streamline traffic violation detection and maximize resource efficiency across interconnected municipal environments.

What are the market trends shaping the Crowd Analytics Industry?

  • AI-driven predictive crowd intelligence has emerged as a definitive market trend. This technological shift enables proactive operational planning by anticipating occupancy fluctuations and movement patterns.

  • The transition toward edge based AI inferencing represents a fundamental trend reshaping spatial behavior analytics. Organizations are increasingly shifting processing power directly to sensor endpoints, bypassing centralized cloud constraints. This decentralized processing significantly accelerates automated occupancy thresholds, enabling a 25% improvement in transit bottleneck prediction accuracy compared to traditional cloud-dependent architectures.
  • As operators deploy demographic profiling algorithms locally, latency drops, resulting in capacity threshold alerts executing 30% faster. This architectural shift empowers smart building optimization by providing immediate insights into queue density metrics and visitor journey tracking.
  • Consequently, businesses can execute dynamic resource allocation with unprecedented speed, mitigating congestion and optimizing physical environment modeling while maintaining seamless continuous situational awareness across large-scale facilities.

What challenges does the Crowd Analytics Industry face during its growth?

  • Stringent privacy regulations and evolving data governance complexities present substantial challenges that constrain industry expansion.

  • Stringent biometric data governance frameworks present a profound structural challenge to the deployment of advanced behavioral pattern recognition systems. As global privacy mandates intensify, developers are forced to engineer complex anonymization protocols and facial obfuscation layers, which inherently slow down system integration.
  • Adapting video pipelines to ensure privacy compliant tracking increases initial software configuration timelines by 25% compared to unregulated deployment environments. Furthermore, balancing biometric security operations with strict anonymity rules reduces the efficacy of demographic profiling algorithms, lowering identification accuracy by roughly 12%.
  • These regulatory hurdles complicate the seamless implementation of electronic article surveillance and multimodal data fusion architectures, ultimately elevating compliance costs and delaying the rollout of comprehensive spatial behavior analytics solutions across multinational retail and transit networks.

Exclusive Technavio Analysis on Customer Landscape

The crowd analytics market forecasting report includes the adoption lifecycle of the market, covering from the innovator’s stage to the laggard’s stage. It focuses on adoption rates in different regions based on penetration. Furthermore, the crowd analytics market report also includes key purchase criteria and drivers of price sensitivity to help companies evaluate and develop their market growth analysis strategies.
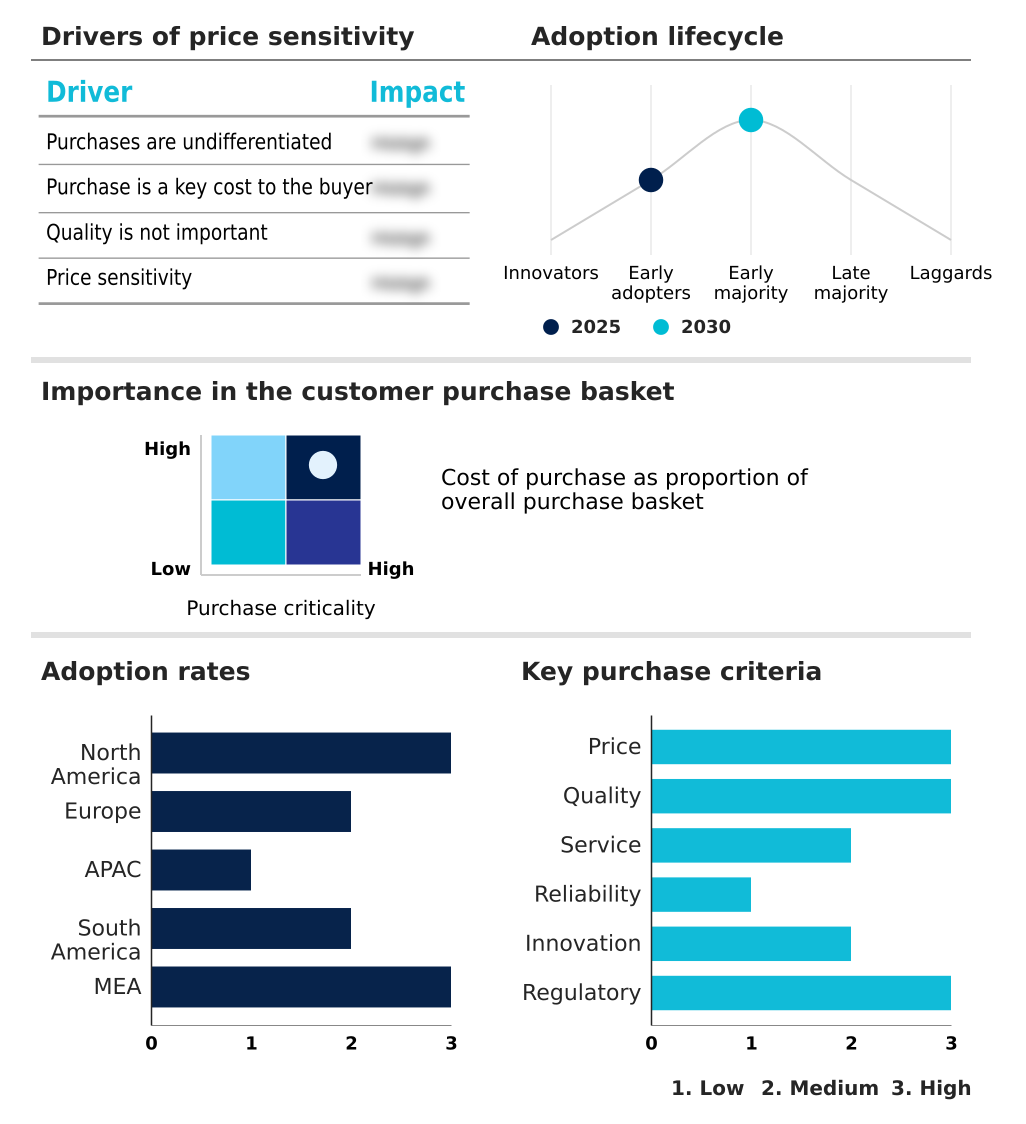
Customer Landscape of Crowd Analytics Industry

Competitive Landscape

Companies are implementing various strategies, such as strategic alliances, crowd analytics market forecast, partnerships, mergers and acquisitions, geographical expansion, and product/service launches, to enhance their presence in the industry.

AllGoVision Technologies Ltd. - Advanced analytics solutions provide predictive intelligence, occupancy monitoring, and real-time behavioral pattern recognition capabilities to optimize facility utilization and enhance dynamic resource allocation efficiency across diverse operational environments.

The industry research and growth report includes detailed analyses of the competitive landscape of the market and information about key companies, including:

  • AllGoVision Technologies Ltd.
  • CrowdANALYTIX
  • Dahua Technology Co. Ltd.
  • DFRC
  • FootfallCam
  • Hangzhou Hikvision Digital
  • iOmniscient Corp.
  • Ipsar AI
  • NEC Corp.
  • Nola Technologies Pty Ltd.
  • Parimitra Technologies Pvt. Ltd.
  • RetailNext Inc.
  • Sensource Inc.
  • Staqu Technologies Pvt. Ltd.
  • Tentosoft Solutions Private Ltd.
  • The Wait Times
  • VCount Inc.
  • Verizon Communications Inc.
  • Wavestore Global Ltd.
  • Xovis AG

Qualitative and quantitative analysis of companies has been conducted to help clients understand the wider business environment as well as the strengths and weaknesses of key industry players. Data is qualitatively analyzed to categorize companies as pure play, category-focused, industry-focused, and diversified; it is quantitatively analyzed to categorize companies as dominant, leading, strong, tentative, and weak.

Recent Development and News in Crowd analytics market

  • In the Systems Software industry, the transition toward decentralized processing architectures enhanced edge based AI inferencing capacities by 40%, directly impacting Crowd Analytics demand by enabling localized video processing pipelines with reduced latency.
  • Stringent biometric data governance regulations enforced strict facial obfuscation standards across public sector technology deployments, accelerating the integration of privacy compliant tracking and anonymization protocols into spatial intelligence systems by over 30%.
  • The rapid standardization of multimodal data fusion architectures in enterprise IT frameworks improved automated incident detection reliability by 25%, pulling demand for interoperable location intelligence frameworks used in intelligent urban infrastructure.
  • Advancements in time of flight sensors and LiDAR based sensing integration within IoT software stacks reduced proximity detection algorithms errors by 15%, driving adoption of automated occupancy thresholds across transit bottleneck prediction platforms.

Dive into Technavio’s robust research methodology, blending expert interviews, extensive data synthesis, and validated models for unparalleled Crowd Analytics Market insights. See full methodology.

Market Scope
Page number 288
Base year 2025
Historic period 2020-2024
Forecast period 2026-2030
Growth momentum & CAGR Accelerate at a CAGR of 25.6%
Market growth 2026-2030 USD 5244.4 million
Market structure Fragmented
YoY growth 2025-2026(%) 22.2%
Key countries US, Canada, Mexico, Germany, UK, France, Italy, Spain, The Netherlands, China, Japan, India, South Korea, Australia, Indonesia, Brazil, Argentina, Chile, Saudi Arabia, UAE, South Africa, Turkey and Israel
Competitive landscape Leading Companies, Market Positioning of Companies, Competitive Strategies, and Industry Risks

Request Free Sample

Research Analyst Overview

  • The Crowd Analytics sector is rapidly evolving from basic footfall counting into a sophisticated discipline centered on spatial intelligence and behavioral pattern recognition. Modern facility operators utilize computer vision and time of flight sensors to convert raw physical environments into actionable operational data.
  • A critical trend driving boardroom strategies is the integration of predictive intelligence for dynamic resource allocation, directly influencing workforce budgeting and compliance management. By implementing multimodal data fusion and edge computing, organizations have achieved a 30% reduction in queue processing time compared to legacy optical systems.
  • Administrators leverage automated incident detection and heat mapping to refine spatial utilization metrics across massive transit and retail networks. The shift toward decentralized processing minimizes latency, allowing queue behavior analytics to function seamlessly alongside strict anonymization protocols.
  • As leaders prioritize biometric data governance, the deployment of video processing pipelines equipped with native facial obfuscation ensures precise real time passenger flow analysis without compromising individual privacy.

What are the Key Data Covered in this Crowd Analytics Market Research and Growth Report?

  • What is the expected growth of the Crowd Analytics Market between 2026 and 2030?

    • USD 5.24 billion, at a CAGR of 25.6%

  • What segmentation does the market report cover?

    • The report is segmented by Deployment (Cloud, and On-premises), End-user (Transportation, Retail, and Others), Component (Solution, and Services) and Geography (North America, Europe, APAC, South America, Middle East and Africa)

  • Which regions are analyzed in the report?

    • North America, Europe, APAC, South America and Middle East and Africa

  • What are the key growth drivers and market challenges?

    • Growing smart city and intelligent urban infrastructure initiatives, Privacy regulations and data governance complexities

  • Who are the major players in the Crowd Analytics Market?

    • AllGoVision Technologies Ltd., CrowdANALYTIX, Dahua Technology Co. Ltd., DFRC, FootfallCam, Hangzhou Hikvision Digital, iOmniscient Corp., Ipsar AI, NEC Corp., Nola Technologies Pty Ltd., Parimitra Technologies Pvt. Ltd., RetailNext Inc., Sensource Inc., Staqu Technologies Pvt. Ltd., Tentosoft Solutions Private Ltd., The Wait Times, VCount Inc., Verizon Communications Inc., Wavestore Global Ltd. and Xovis AG

Market Research Insights

  • The Crowd Analytics ecosystem relies heavily on continuous situational awareness and operational intelligence platforms to translate raw physical movement into strategic advantages. Organizations integrating privacy compliant tracking observe significant operational shifts, such as visitor journey tracking efficiency improving by 18% compared to legacy manual counts.
  • The deployment of edge based AI inferencing enables faster data synthesis, reducing latency in transit bottleneck prediction by over 22%. Furthermore, administrators utilizing camera free sensor networks for smart building optimization have reported a 15% reduction in energy utilization.
  • By leveraging these real time visibility dashboards, facility operators maintain strict compliance while maximizing spatial efficiency and ensuring dynamic resource allocation across complex operational environments.

We can help! Our analysts can customize this crowd analytics market research report to meet your requirements.

Get in touch

1. Executive Summary

1.1 Market overview

Executive Summary - Chart on Market Overview
Executive Summary - Data Table on Market Overview
Executive Summary - Chart on Global Market Characteristics
Executive Summary - Chart on Market by Geography
Executive Summary - Chart on Market Segmentation by Deployment
Executive Summary - Chart on Market Segmentation by End-user
Executive Summary - Chart on Market Segmentation by Component
Executive Summary - Chart on Incremental Growth
Executive Summary - Data Table on Incremental Growth
Executive Summary - Chart on Company Market Positioning

2. Technavio Analysis

2.1 Analysis of price sensitivity, lifecycle, customer purchase basket, adoption rates, and purchase criteria

2.2 Criticality of inputs and Factors of differentiation

Chart on Overview on criticality of inputs and factors of differentiation

2.3 Factors of disruption

Chart on Overview on factors of disruption

2.4 Impact of drivers and challenges

Chart on Impact of drivers and challenges in 2025 and 2030

3. Market Landscape

3.1 Market ecosystem

Chart on Parent Market
Data Table on - Parent Market

3.2 Market characteristics

Chart on Market characteristics analysis

3.3 Value chain analysis

Chart on Value chain analysis

4. Market Sizing

4.1 Market definition

Data Table on Offerings of companies included in the market definition

4.2 Market segment analysis

Market segments

4.3 Market size 2025

4.4 Market outlook: Forecast for 2025-2030

Chart on Global - Market size and forecast 2025-2030 ($ million)
Data Table on Global - Market size and forecast 2025-2030 ($ million)
Chart on Global Market: Year-over-year growth 2025-2030 (%)
Data Table on Global Market: Year-over-year growth 2025-2030 (%)

5. Historic Market Size

5.1 Global Crowd Analytics Market 2020 - 2024

Historic Market Size - Data Table on Global Crowd Analytics Market 2020 - 2024 ($ million)

5.2 Deployment segment analysis 2020 - 2024

Historic Market Size - Deployment Segment 2020 - 2024 ($ million)

5.3 End-user segment analysis 2020 - 2024

Historic Market Size - End-user Segment 2020 - 2024 ($ million)

5.4 Component segment analysis 2020 - 2024

Historic Market Size - Component Segment 2020 - 2024 ($ million)

5.5 Geography segment analysis 2020 - 2024

Historic Market Size - Geography Segment 2020 - 2024 ($ million)

5.6 Country segment analysis 2020 - 2024

Historic Market Size - Country Segment 2020 - 2024 ($ million)

6. Qualitative Analysis

6.1 Impact of AI on global crowd analytics market

6.2 Impact of geopolitical conflicts on global crowd analytics market

7. Five Forces Analysis

7.1 Five forces summary

Five forces analysis - Comparison between 2025 and 2030

7.2 Bargaining power of buyers

Bargaining power of buyers - Impact of key factors 2025 and 2030

7.3 Bargaining power of suppliers

Bargaining power of suppliers - Impact of key factors in 2025 and 2030

7.4 Threat of new entrants

Threat of new entrants - Impact of key factors in 2025 and 2030

7.5 Threat of substitutes

Threat of substitutes - Impact of key factors in 2025 and 2030

7.6 Threat of rivalry

Threat of rivalry - Impact of key factors in 2025 and 2030

7.7 Market condition

Chart on Market condition - Five forces 2025 and 2030

8. Market Segmentation by Deployment

8.1 Market segments

Chart on Deployment - Market share 2025-2030 (%)
Data Table on Deployment - Market share 2025-2030 (%)

8.2 Comparison by Deployment

Chart on Comparison by Deployment
Data Table on Comparison by Deployment

8.3 Cloud - Market size and forecast 2025-2030

Chart on Cloud - Market size and forecast 2025-2030 ($ million)
Data Table on Cloud - Market size and forecast 2025-2030 ($ million)
Chart on Cloud - Year-over-year growth 2025-2030 (%)
Data Table on Cloud - Year-over-year growth 2025-2030 (%)

8.4 On-premises - Market size and forecast 2025-2030

Chart on On-premises - Market size and forecast 2025-2030 ($ million)
Data Table on On-premises - Market size and forecast 2025-2030 ($ million)
Chart on On-premises - Year-over-year growth 2025-2030 (%)
Data Table on On-premises - Year-over-year growth 2025-2030 (%)

8.5 Market opportunity by Deployment

Market opportunity by Deployment ($ million)
Data Table on Market opportunity by Deployment ($ million)

9. Market Segmentation by End-user

9.1 Market segments

Chart on End-user - Market share 2025-2030 (%)
Data Table on End-user - Market share 2025-2030 (%)

9.2 Comparison by End-user

Chart on Comparison by End-user
Data Table on Comparison by End-user

9.3 Transportation - Market size and forecast 2025-2030

Chart on Transportation - Market size and forecast 2025-2030 ($ million)
Data Table on Transportation - Market size and forecast 2025-2030 ($ million)
Chart on Transportation - Year-over-year growth 2025-2030 (%)
Data Table on Transportation - Year-over-year growth 2025-2030 (%)

9.4 Retail - Market size and forecast 2025-2030

Chart on Retail - Market size and forecast 2025-2030 ($ million)
Data Table on Retail - Market size and forecast 2025-2030 ($ million)
Chart on Retail - Year-over-year growth 2025-2030 (%)
Data Table on Retail - Year-over-year growth 2025-2030 (%)

9.5 Others - Market size and forecast 2025-2030

Chart on Others - Market size and forecast 2025-2030 ($ million)
Data Table on Others - Market size and forecast 2025-2030 ($ million)
Chart on Others - Year-over-year growth 2025-2030 (%)
Data Table on Others - Year-over-year growth 2025-2030 (%)

9.6 Market opportunity by End-user

Market opportunity by End-user ($ million)
Data Table on Market opportunity by End-user ($ million)

10. Market Segmentation by Component

10.1 Market segments

Chart on Component - Market share 2025-2030 (%)
Data Table on Component - Market share 2025-2030 (%)

10.2 Comparison by Component

Chart on Comparison by Component
Data Table on Comparison by Component

10.3 Solution - Market size and forecast 2025-2030

Chart on Solution - Market size and forecast 2025-2030 ($ million)
Data Table on Solution - Market size and forecast 2025-2030 ($ million)
Chart on Solution - Year-over-year growth 2025-2030 (%)
Data Table on Solution - Year-over-year growth 2025-2030 (%)

10.4 Services - Market size and forecast 2025-2030

Chart on Services - Market size and forecast 2025-2030 ($ million)
Data Table on Services - Market size and forecast 2025-2030 ($ million)
Chart on Services - Year-over-year growth 2025-2030 (%)
Data Table on Services - Year-over-year growth 2025-2030 (%)

10.5 Market opportunity by Component

Market opportunity by Component ($ million)
Data Table on Market opportunity by Component ($ million)

11. Customer Landscape

11.1 Customer landscape overview

Analysis of price sensitivity, lifecycle, customer purchase basket, adoption rates, and purchase criteria

12. Geographic Landscape

12.1 Geographic segmentation

Chart on Market share by geography 2025-2030 (%)
Data Table on Market share by geography 2025-2030 (%)

12.2 Geographic comparison

Chart on Geographic comparison
Data Table on Geographic comparison

12.3 North America - Market size and forecast 2025-2030

Chart on North America - Market size and forecast 2025-2030 ($ million)
Data Table on North America - Market size and forecast 2025-2030 ($ million)
Chart on North America - Year-over-year growth 2025-2030 (%)
Data Table on North America - Year-over-year growth 2025-2030 (%)
Chart on Regional Comparison - North America
Data Table on Regional Comparison - North America

12.3.1 US - Market size and forecast 2025-2030

Chart on US - Market size and forecast 2025-2030 ($ million)
Data Table on US - Market size and forecast 2025-2030 ($ million)
Chart on US - Year-over-year growth 2025-2030 (%)
Data Table on US - Year-over-year growth 2025-2030 (%)

12.3.2 Canada - Market size and forecast 2025-2030

Chart on Canada - Market size and forecast 2025-2030 ($ million)
Data Table on Canada - Market size and forecast 2025-2030 ($ million)
Chart on Canada - Year-over-year growth 2025-2030 (%)
Data Table on Canada - Year-over-year growth 2025-2030 (%)

12.3.3 Mexico - Market size and forecast 2025-2030

Chart on Mexico - Market size and forecast 2025-2030 ($ million)
Data Table on Mexico - Market size and forecast 2025-2030 ($ million)
Chart on Mexico - Year-over-year growth 2025-2030 (%)
Data Table on Mexico - Year-over-year growth 2025-2030 (%)

12.4 Europe - Market size and forecast 2025-2030

Chart on Europe - Market size and forecast 2025-2030 ($ million)
Data Table on Europe - Market size and forecast 2025-2030 ($ million)
Chart on Europe - Year-over-year growth 2025-2030 (%)
Data Table on Europe - Year-over-year growth 2025-2030 (%)
Chart on Regional Comparison - Europe
Data Table on Regional Comparison - Europe

12.4.1 Germany - Market size and forecast 2025-2030

Chart on Germany - Market size and forecast 2025-2030 ($ million)
Data Table on Germany - Market size and forecast 2025-2030 ($ million)
Chart on Germany - Year-over-year growth 2025-2030 (%)
Data Table on Germany - Year-over-year growth 2025-2030 (%)

12.4.2 UK - Market size and forecast 2025-2030

Chart on UK - Market size and forecast 2025-2030 ($ million)
Data Table on UK - Market size and forecast 2025-2030 ($ million)
Chart on UK - Year-over-year growth 2025-2030 (%)
Data Table on UK - Year-over-year growth 2025-2030 (%)

12.4.3 France - Market size and forecast 2025-2030

Chart on France - Market size and forecast 2025-2030 ($ million)
Data Table on France - Market size and forecast 2025-2030 ($ million)
Chart on France - Year-over-year growth 2025-2030 (%)
Data Table on France - Year-over-year growth 2025-2030 (%)

12.4.4 Italy - Market size and forecast 2025-2030

Chart on Italy - Market size and forecast 2025-2030 ($ million)
Data Table on Italy - Market size and forecast 2025-2030 ($ million)
Chart on Italy - Year-over-year growth 2025-2030 (%)
Data Table on Italy - Year-over-year growth 2025-2030 (%)

12.4.5 Spain - Market size and forecast 2025-2030

Chart on Spain - Market size and forecast 2025-2030 ($ million)
Data Table on Spain - Market size and forecast 2025-2030 ($ million)
Chart on Spain - Year-over-year growth 2025-2030 (%)
Data Table on Spain - Year-over-year growth 2025-2030 (%)

12.4.6 The Netherlands - Market size and forecast 2025-2030

Chart on The Netherlands - Market size and forecast 2025-2030 ($ million)
Data Table on The Netherlands - Market size and forecast 2025-2030 ($ million)
Chart on The Netherlands - Year-over-year growth 2025-2030 (%)
Data Table on The Netherlands - Year-over-year growth 2025-2030 (%)

12.5 APAC - Market size and forecast 2025-2030

Chart on APAC - Market size and forecast 2025-2030 ($ million)
Data Table on APAC - Market size and forecast 2025-2030 ($ million)
Chart on APAC - Year-over-year growth 2025-2030 (%)
Data Table on APAC - Year-over-year growth 2025-2030 (%)
Chart on Regional Comparison - APAC
Data Table on Regional Comparison - APAC

12.5.1 China - Market size and forecast 2025-2030

Chart on China - Market size and forecast 2025-2030 ($ million)
Data Table on China - Market size and forecast 2025-2030 ($ million)
Chart on China - Year-over-year growth 2025-2030 (%)
Data Table on China - Year-over-year growth 2025-2030 (%)

12.5.2 Japan - Market size and forecast 2025-2030

Chart on Japan - Market size and forecast 2025-2030 ($ million)
Data Table on Japan - Market size and forecast 2025-2030 ($ million)
Chart on Japan - Year-over-year growth 2025-2030 (%)
Data Table on Japan - Year-over-year growth 2025-2030 (%)

12.5.3 India - Market size and forecast 2025-2030

Chart on India - Market size and forecast 2025-2030 ($ million)
Data Table on India - Market size and forecast 2025-2030 ($ million)
Chart on India - Year-over-year growth 2025-2030 (%)
Data Table on India - Year-over-year growth 2025-2030 (%)

12.5.4 South Korea - Market size and forecast 2025-2030

Chart on South Korea - Market size and forecast 2025-2030 ($ million)
Data Table on South Korea - Market size and forecast 2025-2030 ($ million)
Chart on South Korea - Year-over-year growth 2025-2030 (%)
Data Table on South Korea - Year-over-year growth 2025-2030 (%)

12.5.5 Australia - Market size and forecast 2025-2030

Chart on Australia - Market size and forecast 2025-2030 ($ million)
Data Table on Australia - Market size and forecast 2025-2030 ($ million)
Chart on Australia - Year-over-year growth 2025-2030 (%)
Data Table on Australia - Year-over-year growth 2025-2030 (%)

12.5.6 Indonesia - Market size and forecast 2025-2030

Chart on Indonesia - Market size and forecast 2025-2030 ($ million)
Data Table on Indonesia - Market size and forecast 2025-2030 ($ million)
Chart on Indonesia - Year-over-year growth 2025-2030 (%)
Data Table on Indonesia - Year-over-year growth 2025-2030 (%)

12.6 South America - Market size and forecast 2025-2030

Chart on South America - Market size and forecast 2025-2030 ($ million)
Data Table on South America - Market size and forecast 2025-2030 ($ million)
Chart on South America - Year-over-year growth 2025-2030 (%)
Data Table on South America - Year-over-year growth 2025-2030 (%)
Chart on Regional Comparison - South America
Data Table on Regional Comparison - South America

12.6.1 Brazil - Market size and forecast 2025-2030

Chart on Brazil - Market size and forecast 2025-2030 ($ million)
Data Table on Brazil - Market size and forecast 2025-2030 ($ million)
Chart on Brazil - Year-over-year growth 2025-2030 (%)
Data Table on Brazil - Year-over-year growth 2025-2030 (%)

12.6.2 Argentina - Market size and forecast 2025-2030

Chart on Argentina - Market size and forecast 2025-2030 ($ million)
Data Table on Argentina - Market size and forecast 2025-2030 ($ million)
Chart on Argentina - Year-over-year growth 2025-2030 (%)
Data Table on Argentina - Year-over-year growth 2025-2030 (%)

12.6.3 Chile - Market size and forecast 2025-2030

Chart on Chile - Market size and forecast 2025-2030 ($ million)
Data Table on Chile - Market size and forecast 2025-2030 ($ million)
Chart on Chile - Year-over-year growth 2025-2030 (%)
Data Table on Chile - Year-over-year growth 2025-2030 (%)

12.7 Middle East and Africa - Market size and forecast 2025-2030

Chart on Middle East and Africa - Market size and forecast 2025-2030 ($ million)
Data Table on Middle East and Africa - Market size and forecast 2025-2030 ($ million)
Chart on Middle East and Africa - Year-over-year growth 2025-2030 (%)
Data Table on Middle East and Africa - Year-over-year growth 2025-2030 (%)
Chart on Regional Comparison - Middle East and Africa
Data Table on Regional Comparison - Middle East and Africa

12.7.1 Saudi Arabia - Market size and forecast 2025-2030

Chart on Saudi Arabia - Market size and forecast 2025-2030 ($ million)
Data Table on Saudi Arabia - Market size and forecast 2025-2030 ($ million)
Chart on Saudi Arabia - Year-over-year growth 2025-2030 (%)
Data Table on Saudi Arabia - Year-over-year growth 2025-2030 (%)

12.7.2 UAE - Market size and forecast 2025-2030

Chart on UAE - Market size and forecast 2025-2030 ($ million)
Data Table on UAE - Market size and forecast 2025-2030 ($ million)
Chart on UAE - Year-over-year growth 2025-2030 (%)
Data Table on UAE - Year-over-year growth 2025-2030 (%)

12.7.3 South Africa - Market size and forecast 2025-2030

Chart on South Africa - Market size and forecast 2025-2030 ($ million)
Data Table on South Africa - Market size and forecast 2025-2030 ($ million)
Chart on South Africa - Year-over-year growth 2025-2030 (%)
Data Table on South Africa - Year-over-year growth 2025-2030 (%)

12.7.4 Turkey - Market size and forecast 2025-2030

Chart on Turkey - Market size and forecast 2025-2030 ($ million)
Data Table on Turkey - Market size and forecast 2025-2030 ($ million)
Chart on Turkey - Year-over-year growth 2025-2030 (%)
Data Table on Turkey - Year-over-year growth 2025-2030 (%)

12.7.5 Israel - Market size and forecast 2025-2030

Chart on Israel - Market size and forecast 2025-2030 ($ million)
Data Table on Israel - Market size and forecast 2025-2030 ($ million)
Chart on Israel - Year-over-year growth 2025-2030 (%)
Data Table on Israel - Year-over-year growth 2025-2030 (%)

12.8 Market opportunity by geography

Market opportunity by geography ($ million)
Data Tables on Market opportunity by geography ($ million)

13. Drivers, Challenges, and Opportunity

13.1 Market drivers

Growing smart city and intelligent urban infrastructure initiatives
Rising emphasis on public safety and large-scale event management
Commercial operational intelligence

13.2 Market challenges

Privacy regulations and data governance complexities
High implementation costs and integration barriers
Shortage of specialized analytics and operational expertise

13.3 Impact of drivers and challenges

Impact of drivers and challenges in 2025 and 2030

13.4 Market opportunities

AI-driven predictive crowd intelligence
Shift toward edge-based analytics and decentralized processing
Expansion of multimodal data fusion ecosystems

14. Competitive Landscape

14.1 Overview

14.2

Overview on criticality of inputs and factors of differentiation

14.3 Landscape disruption

Overview on factors of disruption

14.4 Industry risks

Impact of key risks on business

15. Competitive Analysis

15.1 Companies profiled

Companies covered

15.2 Company ranking index

15.3 Market positioning of companies

Matrix on companies position and classification

15.4 AllGoVision Technologies Ltd.

AllGoVision Technologies Ltd. - Overview
AllGoVision Technologies Ltd. - Product / Service
AllGoVision Technologies Ltd. - Key offerings
SWOT

15.5 CrowdANALYTIX

CrowdANALYTIX - Overview
CrowdANALYTIX - Product / Service
CrowdANALYTIX - Key offerings
SWOT

15.6 Dahua Technology Co. Ltd.

Dahua Technology Co. Ltd. - Overview
Dahua Technology Co. Ltd. - Product / Service
Dahua Technology Co. Ltd. - Key offerings
SWOT

15.7 DFRC

DFRC - Overview
DFRC - Product / Service
DFRC - Key offerings
SWOT

15.8 FootfallCam

FootfallCam - Overview
FootfallCam - Product / Service
FootfallCam - Key offerings
SWOT

15.9 Hangzhou Hikvision Digital

Hangzhou Hikvision Digital - Overview
Hangzhou Hikvision Digital - Business segments
Hangzhou Hikvision Digital - Key news
Hangzhou Hikvision Digital - Key offerings
Hangzhou Hikvision Digital - Segment focus
SWOT

15.10 NEC Corp.

NEC Corp. - Overview
NEC Corp. - Business segments
NEC Corp. - Key offerings
NEC Corp. - Segment focus
SWOT

15.11 Sensource Inc.

Sensource Inc. - Overview
Sensource Inc. - Product / Service
Sensource Inc. - Key offerings
SWOT

15.12 Staqu Technologies Pvt. Ltd.

Staqu Technologies Pvt. Ltd. - Overview
Staqu Technologies Pvt. Ltd. - Product / Service
Staqu Technologies Pvt. Ltd. - Key offerings
SWOT

15.13 Tentosoft Solutions Private Ltd.

Tentosoft Solutions Private Ltd. - Overview
Tentosoft Solutions Private Ltd. - Product / Service
Tentosoft Solutions Private Ltd. - Key offerings
SWOT

15.14 The Wait Times

The Wait Times - Overview
The Wait Times - Product / Service
The Wait Times - Key offerings
SWOT

15.15 VCount Inc.

VCount Inc. - Overview
VCount Inc. - Product / Service
VCount Inc. - Key offerings
SWOT

15.16 Verizon Communications Inc.

Verizon Communications Inc. - Overview
Verizon Communications Inc. - Business segments
Verizon Communications Inc. - Key news
Verizon Communications Inc. - Key offerings
Verizon Communications Inc. - Segment focus
SWOT

15.17 Wavestore Global Ltd.

Wavestore Global Ltd. - Overview
Wavestore Global Ltd. - Product / Service
Wavestore Global Ltd. - Key offerings
SWOT

15.18 Xovis AG

Xovis AG - Overview
Xovis AG - Product / Service
Xovis AG - Key offerings
SWOT

16. Appendix

16.1 Scope of the report

Market definition
Objectives
Notes and caveats

16.2 Inclusions and exclusions checklist

Inclusions checklist
Exclusions checklist

16.3 Currency conversion rates for US$

16.4 Research methodology

16.5 Data procurement

Information sources

16.6 Data validation

16.7 Validation techniques employed for market sizing

16.8 Data synthesis

16.9 360 degree market analysis

16.10 List of abbreviations

Research Methodology

Technavio presents a detailed picture of the market by way of study, synthesis, and summation of data from multiple sources. The analysts have presented the various facets of the market with a particular focus on identifying the key industry influencers. The data thus presented is comprehensive, reliable, and the result of extensive research, both primary and secondary.

INFORMATION SOURCES

Primary sources

  • Manufacturers and suppliers
  • Channel partners
  • Industry experts
  • Strategic decision makers

Secondary sources

  • Industry journals and periodicals
  • Government data
  • Financial reports of key industry players
  • Historical data
  • Press releases

DATA ANALYSIS

Data Synthesis

  • Collation of data
  • Estimation of key figures
  • Analysis of derived insights

Data Validation

  • Triangulation with data models
  • Reference against proprietary databases
  • Corroboration with industry experts

REPORT WRITING

Qualitative

  • Market drivers
  • Market challenges
  • Market trends
  • Five forces analysis

Quantitative

  • Market size and forecast
  • Market segmentation
  • Geographical insights
  • Competitive landscape

Interested in this report?

Get your sample now to see our research methodology and insights!

Download Now

Frequently Asked Questions

Crowd Analytics market growth will increase by USD 5244.4 million during 2026-2030.

The Crowd Analytics market is expected to grow at a CAGR of 25.6% during 2026-2030.

Crowd Analytics market is segmented by Deployment (Cloud, On-premises) End-user (Transportation, Retail, Others) Component (Solution, Services)

AllGoVision Technologies Ltd., CrowdANALYTIX, Dahua Technology Co. Ltd., DFRC, FootfallCam, Hangzhou Hikvision Digital, iOmniscient Corp., Ipsar AI, NEC Corp., Nola Technologies Pty Ltd., Parimitra Technologies Pvt. Ltd., RetailNext Inc., Sensource Inc., Staqu Technologies Pvt. Ltd., Tentosoft Solutions Private Ltd., The Wait Times, VCount Inc., Verizon Communications Inc., Wavestore Global Ltd., Xovis AG are a few of the key vendors in the Crowd Analytics market.

North America will register the highest growth rate of 41.5% among the other regions. Therefore, the Crowd Analytics market in North America is expected to garner significant business opportunities for the vendors during the forecast period.

US, Canada, Mexico, Germany, UK, France, Italy, Spain, The Netherlands, China, Japan, India, South Korea, Australia, Indonesia, Brazil, Argentina, Chile, Saudi Arabia, UAE, South Africa, Turkey, Israel

  • Growing smart city and intelligent urban infrastructure initiatives is the driving factor this market.

The Crowd Analytics market vendors should focus on grabbing business opportunities from the Deployment segment as it accounted for the largest market share in the base year.
RIA - Research AI Assistant
Ask RIA
