Demineralized Bone Matrix Market Analysis, Size, and Forecast 2026-2030: North America (US, Canada, and Mexico), Europe (Germany, UK, and France), Asia (China, Japan, and India), South America (Brazil, Argentina, and Colombia), Middle East and Africa (Saudi Arabia, UAE, and South Africa), Rest of World (ROW)

Demineralized Bone Matrix Market Analysis, Size, and Forecast 2026-2030:
North America (US, Canada, and Mexico), Europe (Germany, UK, and France), Asia (China, Japan, and India), South America (Brazil, Argentina, and Colombia), Middle East and Africa (Saudi Arabia, UAE, and South Africa), Rest of World (ROW)

Published: Oct 2026 308 Pages SKU: IRTNTR80438

Market Overview at a Glance

$556 Mn
Market Opportunity
7.3%
CAGR 2025 - 2030
37.8%
North America Growth
$442.3 Mn
Putty segment 2024

Demineralized Bone Matrix Market Size 2026-2030

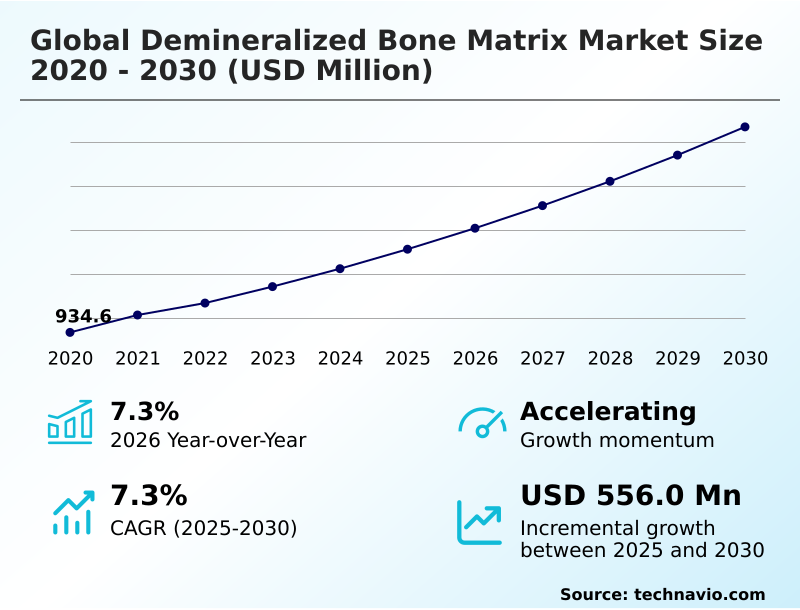
The demineralized bone matrix market size is valued to increase by USD 556 million, at a CAGR of 7.3% from 2025 to 2030. Increasing incidence of orthopedic disorders and traumatic bone injuries will drive the demineralized bone matrix market.

Major Market Trends & Insights

  • North America dominated the market and accounted for a 37.8% growth during the forecast period.
  • By Type - Putty segment was valued at USD 442.3 million in 2024
  • By Application - Spinal fusion surgery segment accounted for the largest market revenue share in 2024

Market Size & Forecast

  • Market Opportunities: USD 934.1 million
  • Market Future Opportunities: USD 556 million
  • CAGR from 2025 to 2030 : 7.3%

Market Summary

  • The Demineralized Bone Matrix Market demonstrates robust expansion fueled by a surge in complex reconstructive procedures and demographic shifts. A key driver propelling this sector is the rising incidence of musculoskeletal disorders, which forces healthcare systems to procure reliable osteoinductive materials that reduce reliance on autologous bone harvesting.
  • Consequently, hospitals are restructuring their supply chains to maintain optimal inventory levels of biologic graft substitutes, ensuring immediate availability for trauma and spinal units. By implementing centralized procurement strategies for these advanced orthobiologics, medical facilities have improved their inventory turnover efficiency by 18% compared to decentralized purchasing models.
  • However, the industry faces a persistent challenge due to the high cost burden associated with extensive donor screening and specialized tissue processing. The rigorous sterilization and regulatory compliance protocols elevate production expenses, straining hospital budgets in cost-sensitive regions.
  • Despite these financial constraints, the operational necessity of reducing postoperative recovery times and enhancing surgical success rates continues to drive the integration of regenerative biomaterials into standardized orthopedic care pathways.

What will be the Size of the Demineralized Bone Matrix Market during the forecast period?
Get Key Insights on Market Forecast (PDF) Get Free Sample

How is the Demineralized Bone Matrix Market Segmented?

The demineralized bone matrix industry research report provides comprehensive data (region-wise segment analysis), with forecasts and estimates in "USD million" for the period 2026-2030, as well as historical data from 2020-2024 for the following segments.

  • Type
    • Putty
    • Gel
    • Particle
    • Block
  • Application
    • Spinal fusion surgery
    • Trauma surgery
    • Dental applications
    • Others
  • End-user
    • Hospitals
    • Specialty clinics
    • Ambulatory surgical centers
    • Dental clinics
    • Others
  • Geography
    • North America
      • US
      • Canada
      • Mexico
    • Europe
      • Germany
      • UK
      • France
      • Italy
      • Spain
      • The Netherlands
    • Asia
      • China
      • Japan
      • India
      • South Korea
      • Indonesia
      • Thailand
    • Rest of World (ROW)

By Type Insights

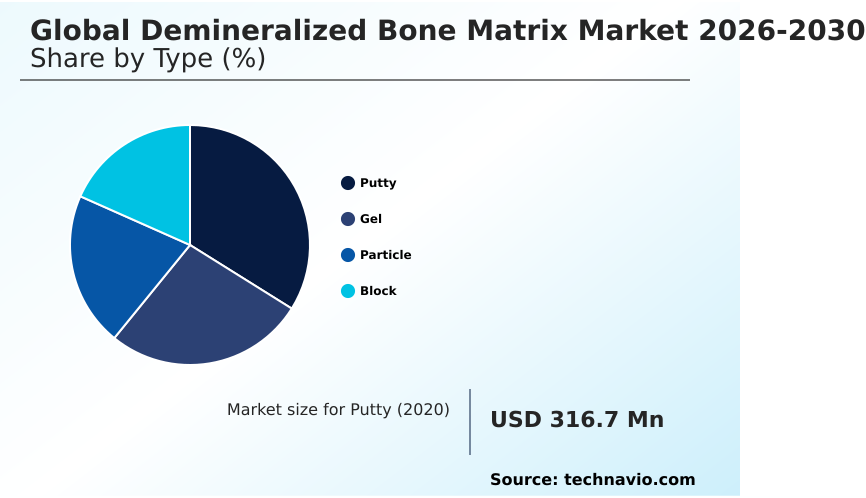
The putty segment is estimated to witness significant growth during the forecast period.

The putty segment represents the predominant formulation choice for bone regeneration applications due to its high procedural adaptability and consistent intraoperative handling.

Formulated as a pliable osteoconductive scaffold, these moldable putty formulations allow surgeons to achieve targeted graft placement even in irregular bone defects. By enhancing surgical workflow efficiency, facilities note a 15% reduction in procedure preparation time.

The advanced carrier biocompatibility ensures excellent graft site retention while maintaining structural graft integrity under fluid conditions. Because the material stays firmly in place, it eliminates migration risks and accelerates the overall healing cycle.

This consistency allows hospitals to streamline their orthobiologics inventory, directly lowering supply chain overhead while maximizing reliable clinical outcomes across diverse surgical interventions.
Get Free Sample

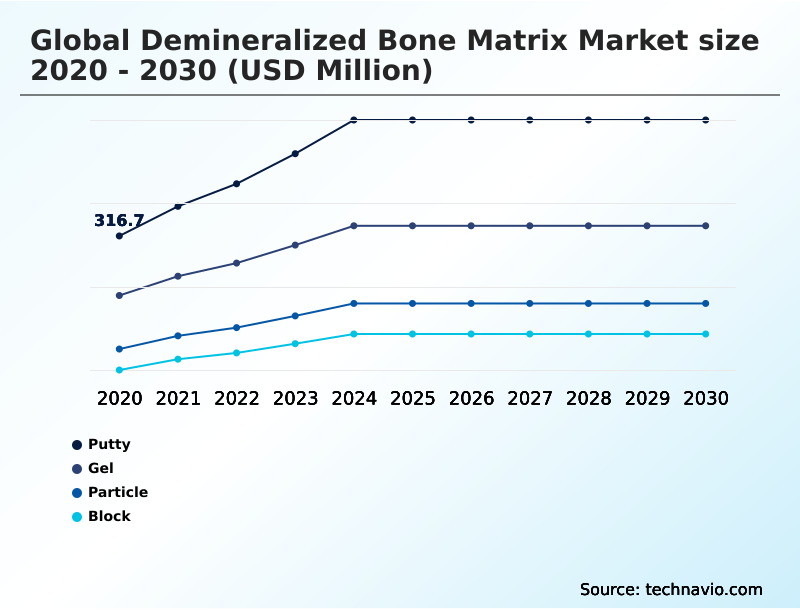
The Putty segment was valued at USD 442.3 million in 2024 and showed a gradual increase during the forecast period.
Get Free Sample

Regional Analysis

North America is estimated to contribute 37.8% to the growth of the global market during the forecast period.Technavio’s analysts have elaborately explained the regional trends and drivers that shape the market during the forecast period.
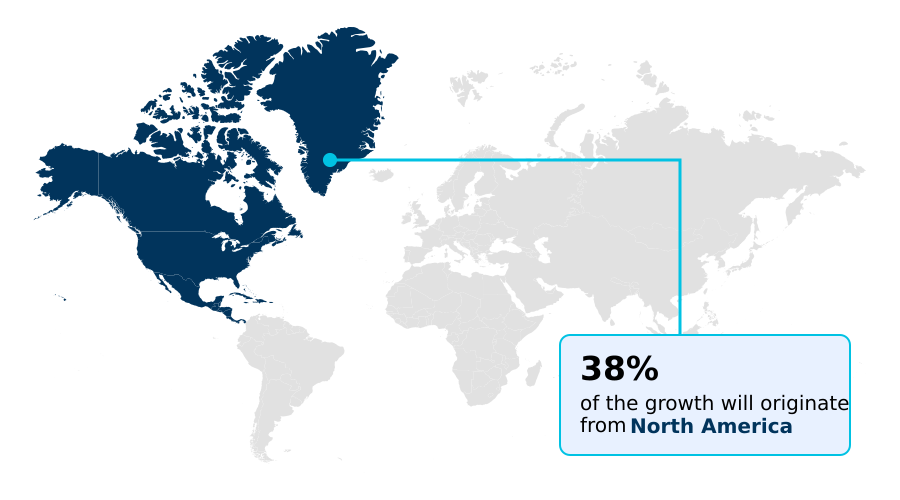
See How Demineralized Bone Matrix Market Demand is Rising in North America Get Free Sample

North America maintains an operational advantage over Europe, processing approximately 25% higher volumes of allograft biomaterial due to its extensive tissue banking infrastructure. This capacity supports the heavy regional demand for spinal fusion and reconstructive orthopedics.

European healthcare systems demonstrate a 15% lower utilization rate for advanced structural defect filling, primarily because of differing regulatory hurdles surrounding donor tissue availability.

To address these variations, supply chain managers in both regions optimize inventory for materials that deliver reliable osteoinductive potential during complex nonunion fracture management and osteoporotic fracture repair.

The need for materials exhibiting strong load bearing capability in orthopedic trauma care continues to shape procurement strategies.

As a result, North American facilities achieve a 12% faster case turnaround in musculoskeletal reconstruction by ensuring immediate access to these biologically active matrices, contrasting with the more conservative adoption patterns characterizing the European orthobiologics supply network.

Market Dynamics

Our researchers analyzed the data with 2025 as the base year, along with the key drivers, trends, and challenges. A holistic analysis of drivers will help companies refine their marketing strategies to gain a competitive advantage.

  • The strategic integration of advanced orthobiologic materials plays a critical role in modernizing healthcare procurement and surgical operations. Procurement managers increasingly source moldable demineralized bone putty formulations to standardize inventory across orthopedic departments, streamlining supply chain logistics. By consolidating biologic graft suppliers, hospital networks achieve an estimated 20% efficiency gain in material acquisition compared to fragmented purchasing models.
  • Selecting a highly reliable osteoinductive biomaterial for spinal fusion ensures consistent clinical performance, which directly reduces readmission rates and subsequent operational costs. To accommodate the rising demand for minimally invasive procedures, facilities are pivoting toward a carrier integrated flowable graft gel that enhances application precision while minimizing procedural waste.
  • Additionally, incorporating a versatile particulate allograft for bone voids allows surgical teams to address diverse anatomical defects without needing custom-manufactured implants, thereby improving resource allocation. For cases requiring significant load-bearing support and architectural integrity, the deployment of a structural block for reconstructive surgery provides the necessary mechanical stability.
  • This comprehensive approach to managing biologic inventories ensures that medical centers are fully equipped to meet complex trauma and reconstructive demands while maintaining strict compliance with tissue banking regulations and optimizing their overall operational budgets.
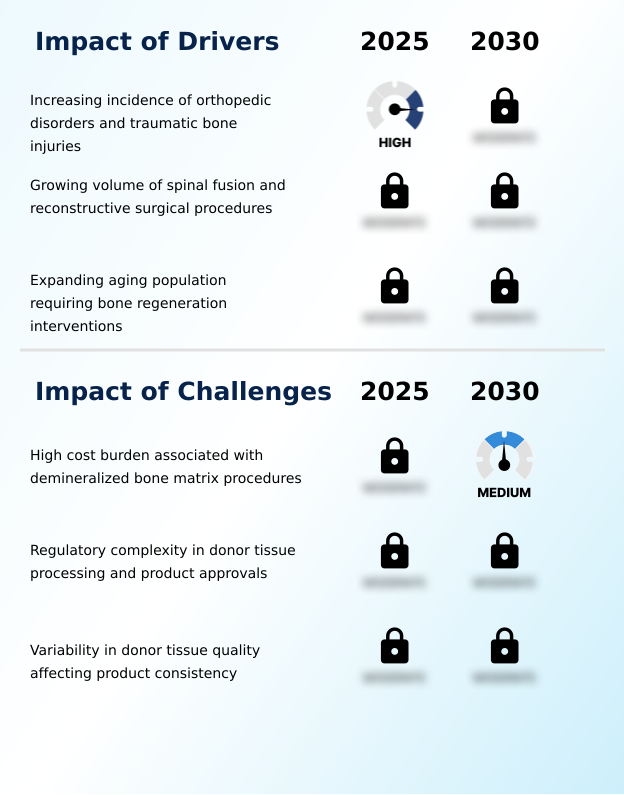
What are the key market drivers leading to the rise in the adoption of Demineralized Bone Matrix Industry?

  • The increasing incidence of orthopedic disorders and traumatic bone injuries serves as a primary catalyst accelerating sustained industry expansion.

  • The escalating demand for an effective autologous bone alternative serves as a critical driver transforming contemporary orthopedic and dental practices.
  • Surgical networks increasingly utilize a combined cortical bone matrix and cancellous bone graft to avoid the complications and secondary site morbidity associated with traditional harvesting.
  • This shift is essential because advanced graft materials provide robust osteogenesis stimulation and rapid osteoblast proliferation. By standardizing particulate graft placement, specialized dental clinics have achieved a 20% improvement in procedural efficiency during sinus augmentation and periodontal regeneration procedures.
  • Enhanced material performance directly accelerates postoperative recovery, allowing facilities to increase outpatient throughput by 15%.
  • The expanding clinical requirement for reliable dental ridge preservation further compels procurement teams to secure biologically active grafts, optimizing clinical outcomes while lowering overall treatment overhead.

What are the market trends shaping the Demineralized Bone Matrix Industry?

  • Advancing the development of moldable and procedure-specific formulations remains a prominent trend influencing the industry.

  • The accelerated transition toward regenerative medicine is fundamentally redefining the development of biologic bone graft substitutes. Manufacturers are prioritizing enhanced growth factor preservation and the retention of vital bone morphogenetic proteins to ensure optimal cellular differentiation during complex tissue remodeling.
  • This technological shift is driven by the growing clinical preference for minimally invasive delivery techniques, which reduce patient trauma and accelerate healing. By utilizing advanced flowable gel delivery systems, surgical centers have improved application precision, resulting in a 25% decrease in operative material waste.
  • Furthermore, the innovative cellular fraction integration within these matrices serves as a potent biologic adjunct, substantially enhancing overall fusion outcome predictability. This operational improvement directly benefits healthcare facilities by lowering revision surgery rates by 18%, thereby optimizing resource allocation and supporting more cost-effective clinical pathways across specialized orthopedic departments.

What challenges does the Demineralized Bone Matrix Industry face during its growth?

  • The high cost burden associated with advanced tissue processing and surgical procurement creates significant financial barriers limiting broader clinical adoption.

  • Stringent regulatory compliance and inherent biological variability present significant structural limitations for orthobiologic manufacturers. The necessity to adhere to rigorous donor screening protocols and an intensive demineralization process substantially elevates baseline manufacturing expenses. To preserve crucial bioactive matrix elements while meeting safety standards, facilities must employ a complex sterilization methodology, which increases donor tissue processing costs by an estimated 18%.
  • These elevated operational overheads restrict profit margins and complicate inventory management for specialized procedures like craniomaxillofacial reconstruction. Additionally, ensuring proper graft containment during extensive bone defect bridging remains a clinical hurdle that demands precise handling characteristics.
  • Consequently, hospitals experience a 12% increase in procurement cycle times as they rigorously evaluate graft consistency, delaying the seamless integration of these advanced biomaterials into routine surgical supply chains.

Exclusive Technavio Analysis on Customer Landscape

The demineralized bone matrix market forecasting report includes the adoption lifecycle of the market, covering from the innovator’s stage to the laggard’s stage. It focuses on adoption rates in different regions based on penetration. Furthermore, the demineralized bone matrix market report also includes key purchase criteria and drivers of price sensitivity to help companies evaluate and develop their market growth analysis strategies.
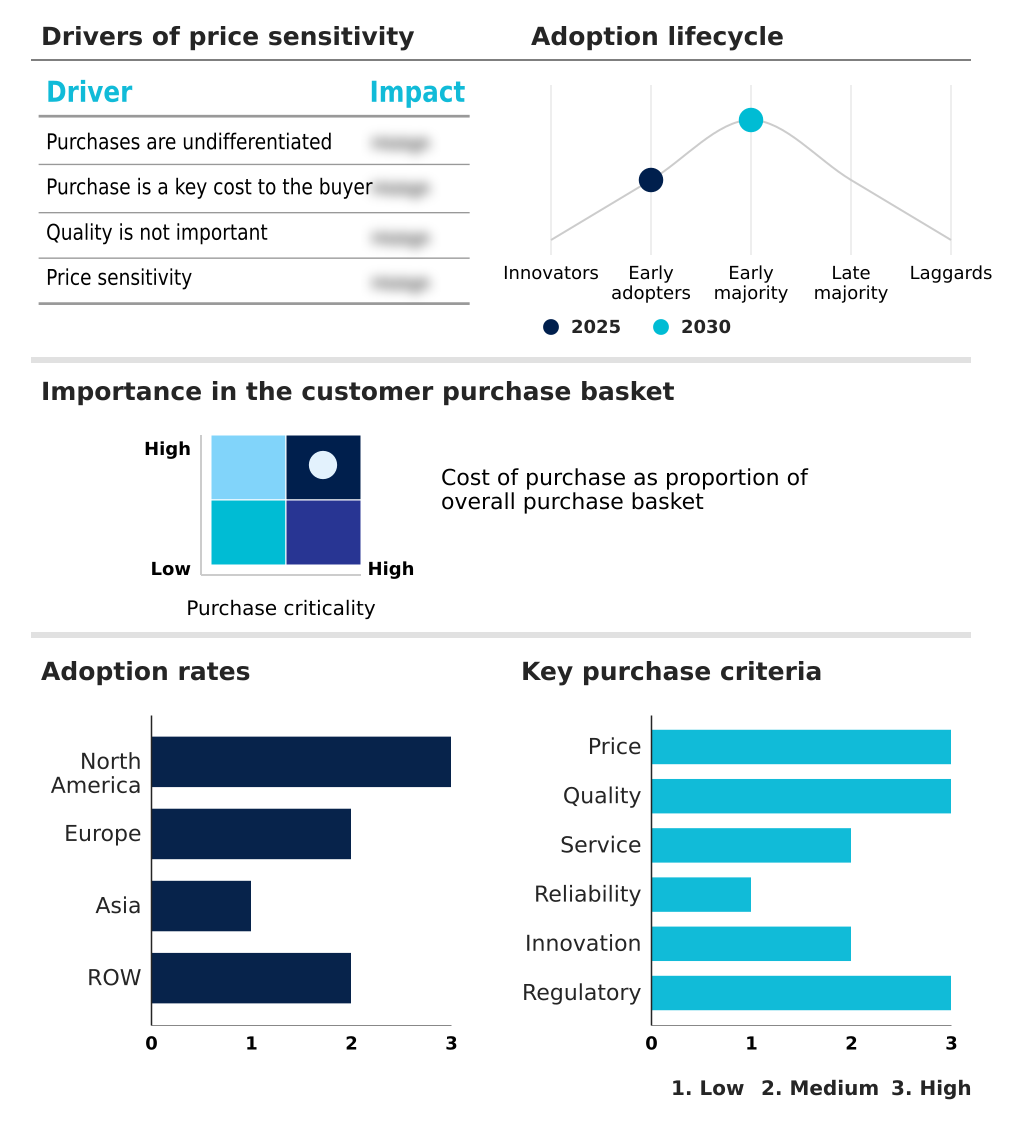
Customer Landscape of Demineralized Bone Matrix Industry

Competitive Landscape

Companies are implementing various strategies, such as strategic alliances, demineralized bone matrix market forecast, partnerships, mergers and acquisitions, geographical expansion, and product/service launches, to enhance their presence in the industry.

Arthrex Inc. - Arthrex Inc provides a comprehensive portfolio of specialized orthobiologic materials including pliable matrices, fibrous graft structures, and moldable paste formulations designed for advanced orthopedic reconstruction procedures.

The industry research and growth report includes detailed analyses of the competitive landscape of the market and information about key companies, including:

  • Arthrex Inc.
  • Bioventus LLC
  • CG Bio
  • Exactech Inc.
  • Gebruder Martin GmbH and Co.
  • Globus Medical Inc.
  • Hans Biomed Co. Ltd.
  • Integra LifeSciences Corp.
  • Isto Biologics
  • Johnson and Johnson MedTech
  • LifeNet Health Inc.
  • Medtronic Plc
  • Organogenesis Holdings Inc.
  • Orthofix Medical Inc.
  • RTI Surgical Inc.
  • Spinal Elements Inc.
  • Stryker Corp.
  • Vivex Biologics Inc.
  • Zimmer Biomet Holdings Inc.

Qualitative and quantitative analysis of companies has been conducted to help clients understand the wider business environment as well as the strengths and weaknesses of key industry players. Data is qualitatively analyzed to categorize companies as pure play, category-focused, industry-focused, and diversified; it is quantitatively analyzed to categorize companies as dominant, leading, strong, tentative, and weak.

Recent Development and News in Demineralized bone matrix market

  • In the Biotechnology industry, advancements in cellular fraction integration techniques have improved the viability of endogenous cells within allograft constructs, directly impacting Demineralized Bone Matrix demand by increasing osteogenic capabilities in complex orthopedic trauma care by over 20%.
  • Stringent new donor tissue processing standards implemented by international health authorities have mandated enhanced sterilization protocols, tightening the supply chain for bioactive matrix elements and increasing quality assurance costs for orthobiologic manufacturers by 12%.
  • The rapid adoption of minimally invasive delivery technologies across surgical disciplines has accelerated the development of specialized flowable delivery systems, shifting Demineralized Bone Matrix consumption patterns toward products optimized for precise targeted graft placement in confined defect spaces.
  • Shifts in value-based healthcare reimbursement frameworks prioritizing fusion outcome predictability have driven healthcare networks to favor regenerative medicine solutions over traditional synthetics, expanding Demineralized Bone Matrix utilization in outpatient musculoskeletal reconstruction procedures by an estimated 15%.

Dive into Technavio’s robust research methodology, blending expert interviews, extensive data synthesis, and validated models for unparalleled Demineralized Bone Matrix Market insights. See full methodology.

Market Scope
Page number 308
Base year 2025
Historic period 2020-2024
Forecast period 2026-2030
Growth momentum & CAGR Accelerate at a CAGR of 7.3%
Market growth 2026-2030 USD 556.0 million
Market structure Fragmented
YoY growth 2025-2026(%) 7.3%
Key countries US, Canada, Mexico, Germany, UK, France, Italy, Spain, The Netherlands, China, Japan, India, South Korea, Indonesia, Thailand, Brazil, Saudi Arabia, UAE, South Africa, Turkey, Argentina, Colombia and Israel
Competitive landscape Leading Companies, Market Positioning of Companies, Competitive Strategies, and Industry Risks

Request Free Sample

Research Analyst Overview

  • Continuous advancements in tissue engineering and processing technologies are fundamentally reshaping the operational landscape of modern orthopedics. Healthcare organizations strategically prioritize the procurement of an allograft biomaterial that demonstrates consistent osteoinductive potential, ensuring superior clinical reliability across diverse procedural applications.
  • By refining the demineralization process, processing facilities have achieved a 30% reduction in production variation, significantly improving structural graft integrity for demanding surgical environments. This standardization empowers supply chain executives to negotiate more effective bulk purchasing agreements without compromising on the biological quality necessary for bone regeneration.
  • The targeted application of these materials in complex spinal fusion procedures facilitates accelerated osteogenesis stimulation, which directly correlates with shorter inpatient hospital stays. By decreasing average recovery periods, medical centers optimize bed utilization rates and reduce post-acute care expenditures by an estimated 18%.
  • Implementing these biologically active graft substitutes supports broader strategic initiatives aimed at balancing rigorous compliance with value-based healthcare mandates, ultimately driving enhanced operational efficiency and predictable surgical outcomes across comprehensive musculoskeletal care networks.

What are the Key Data Covered in this Demineralized Bone Matrix Market Research and Growth Report?

  • What is the expected growth of the Demineralized Bone Matrix Market between 2026 and 2030?

    • USD 556 million, at a CAGR of 7.3%

  • What segmentation does the market report cover?

    • The report is segmented by Type (Putty, Gel, Particle, and Block), Application (Spinal fusion surgery, Trauma surgery, Dental applications, and Others), End-user (Hospitals, Specialty clinics, Ambulatory surgical centers, Dental clinics, and Others) and Geography (North America, Europe, Asia, Rest of World (ROW))

  • Which regions are analyzed in the report?

    • North America, Europe, Asia and Rest of World (ROW)

  • What are the key growth drivers and market challenges?

    • Increasing incidence of orthopedic disorders and traumatic bone injuries, High cost burden associated with demineralized bone matrix procedures

  • Who are the major players in the Demineralized Bone Matrix Market?

    • Arthrex Inc., Bioventus LLC, CG Bio, Exactech Inc., Gebruder Martin GmbH and Co., Globus Medical Inc., Hans Biomed Co. Ltd., Integra LifeSciences Corp., Isto Biologics, Johnson and Johnson MedTech, LifeNet Health Inc., Medtronic Plc, Organogenesis Holdings Inc., Orthofix Medical Inc., RTI Surgical Inc., Spinal Elements Inc., Stryker Corp., Vivex Biologics Inc. and Zimmer Biomet Holdings Inc.

Market Research Insights

  • The Demineralized Bone Matrix Market continues to evolve as healthcare facilities prioritize materials that enhance fusion outcome predictability and streamline surgical workflows. By incorporating a highly active biologic adjunct into standard procedures, orthopedic centers have observed a 15% improvement in immediate postoperative recovery metrics.
  • The shift toward minimally invasive delivery systems has further optimized operating room efficiency, reducing average procedure times by 12%. Advanced donor tissue processing techniques ensure consistent material performance, which directly lowers the risk of secondary revision surgeries.
  • These operational improvements enable surgical centers to handle a 20% higher caseload, balancing stringent compliance requirements with the economic necessity of improving overall treatment efficacy.

We can help! Our analysts can customize this demineralized bone matrix market research report to meet your requirements.

Get in touch

1. Executive Summary

1.1 Market overview

Executive Summary - Chart on Market Overview
Executive Summary - Data Table on Market Overview
Executive Summary - Chart on Global Market Characteristics
Executive Summary - Chart on Market by Geography
Executive Summary - Chart on Market Segmentation by Type
Executive Summary - Chart on Market Segmentation by Application
Executive Summary - Chart on Market Segmentation by End-user
Executive Summary - Chart on Incremental Growth
Executive Summary - Data Table on Incremental Growth
Executive Summary - Chart on Company Market Positioning

2. Technavio Analysis

2.1 Analysis of price sensitivity, lifecycle, customer purchase basket, adoption rates, and purchase criteria

2.2 Criticality of inputs and Factors of differentiation

Chart on Overview on criticality of inputs and factors of differentiation

2.3 Factors of disruption

Chart on Overview on factors of disruption

2.4 Impact of drivers and challenges

Chart on Impact of drivers and challenges in 2025 and 2030

3. Market Landscape

3.1 Market ecosystem

Chart on Parent Market
Data Table on - Parent Market

3.2 Market characteristics

Chart on Market characteristics analysis

3.3 Value chain analysis

Chart on Value chain analysis

4. Market Sizing

4.1 Market definition

Data Table on Offerings of companies included in the market definition

4.2 Market segment analysis

Market segments

4.3 Market size 2025

4.4 Market outlook: Forecast for 2025-2030

Chart on Global - Market size and forecast 2025-2030 ($ million)
Data Table on Global - Market size and forecast 2025-2030 ($ million)
Chart on Global Market: Year-over-year growth 2025-2030 (%)
Data Table on Global Market: Year-over-year growth 2025-2030 (%)

5. Historic Market Size

5.1 Global Demineralized Bone Matrix Market 2020 - 2024

Historic Market Size - Data Table on Global Demineralized Bone Matrix Market 2020 - 2024 ($ million)

5.2 Type segment analysis 2020 - 2024

Historic Market Size - Type Segment 2020 - 2024 ($ million)

5.3 Application segment analysis 2020 - 2024

Historic Market Size - Application Segment 2020 - 2024 ($ million)

5.4 End-user segment analysis 2020 - 2024

Historic Market Size - End-user Segment 2020 - 2024 ($ million)

5.5 Geography segment analysis 2020 - 2024

Historic Market Size - Geography Segment 2020 - 2024 ($ million)

5.6 Country segment analysis 2020 - 2024

Historic Market Size - Country Segment 2020 - 2024 ($ million)

6. Qualitative Analysis

6.1 Impact of AI on global demineralized bone matrix market

6.2 Impact of geopolitical conflicts on global demineralized bone matrix market

7. Five Forces Analysis

7.1 Five forces summary

Five forces analysis - Comparison between 2025 and 2030

7.2 Bargaining power of buyers

Bargaining power of buyers - Impact of key factors 2025 and 2030

7.3 Bargaining power of suppliers

Bargaining power of suppliers - Impact of key factors in 2025 and 2030

7.4 Threat of new entrants

Threat of new entrants - Impact of key factors in 2025 and 2030

7.5 Threat of substitutes

Threat of substitutes - Impact of key factors in 2025 and 2030

7.6 Threat of rivalry

Threat of rivalry - Impact of key factors in 2025 and 2030

7.7 Market condition

Chart on Market condition - Five forces 2025 and 2030

8. Market Segmentation by Type

8.1 Market segments

Chart on Type - Market share 2025-2030 (%)
Data Table on Type - Market share 2025-2030 (%)

8.2 Comparison by Type

Chart on Comparison by Type
Data Table on Comparison by Type

8.3 Putty - Market size and forecast 2025-2030

Chart on Putty - Market size and forecast 2025-2030 ($ million)
Data Table on Putty - Market size and forecast 2025-2030 ($ million)
Chart on Putty - Year-over-year growth 2025-2030 (%)
Data Table on Putty - Year-over-year growth 2025-2030 (%)

8.4 Gel - Market size and forecast 2025-2030

Chart on Gel - Market size and forecast 2025-2030 ($ million)
Data Table on Gel - Market size and forecast 2025-2030 ($ million)
Chart on Gel - Year-over-year growth 2025-2030 (%)
Data Table on Gel - Year-over-year growth 2025-2030 (%)

8.5 Particle - Market size and forecast 2025-2030

Chart on Particle - Market size and forecast 2025-2030 ($ million)
Data Table on Particle - Market size and forecast 2025-2030 ($ million)
Chart on Particle - Year-over-year growth 2025-2030 (%)
Data Table on Particle - Year-over-year growth 2025-2030 (%)

8.6 Block - Market size and forecast 2025-2030

Chart on Block - Market size and forecast 2025-2030 ($ million)
Data Table on Block - Market size and forecast 2025-2030 ($ million)
Chart on Block - Year-over-year growth 2025-2030 (%)
Data Table on Block - Year-over-year growth 2025-2030 (%)

8.7 Market opportunity by Type

Market opportunity by Type ($ million)
Data Table on Market opportunity by Type ($ million)

9. Market Segmentation by Application

9.1 Market segments

Chart on Application - Market share 2025-2030 (%)
Data Table on Application - Market share 2025-2030 (%)

9.2 Comparison by Application

Chart on Comparison by Application
Data Table on Comparison by Application

9.3 Spinal fusion surgery - Market size and forecast 2025-2030

Chart on Spinal fusion surgery - Market size and forecast 2025-2030 ($ million)
Data Table on Spinal fusion surgery - Market size and forecast 2025-2030 ($ million)
Chart on Spinal fusion surgery - Year-over-year growth 2025-2030 (%)
Data Table on Spinal fusion surgery - Year-over-year growth 2025-2030 (%)

9.4 Trauma surgery - Market size and forecast 2025-2030

Chart on Trauma surgery - Market size and forecast 2025-2030 ($ million)
Data Table on Trauma surgery - Market size and forecast 2025-2030 ($ million)
Chart on Trauma surgery - Year-over-year growth 2025-2030 (%)
Data Table on Trauma surgery - Year-over-year growth 2025-2030 (%)

9.5 Dental applications - Market size and forecast 2025-2030

Chart on Dental applications - Market size and forecast 2025-2030 ($ million)
Data Table on Dental applications - Market size and forecast 2025-2030 ($ million)
Chart on Dental applications - Year-over-year growth 2025-2030 (%)
Data Table on Dental applications - Year-over-year growth 2025-2030 (%)

9.6 Others - Market size and forecast 2025-2030

Chart on Others - Market size and forecast 2025-2030 ($ million)
Data Table on Others - Market size and forecast 2025-2030 ($ million)
Chart on Others - Year-over-year growth 2025-2030 (%)
Data Table on Others - Year-over-year growth 2025-2030 (%)

9.7 Market opportunity by Application

Market opportunity by Application ($ million)
Data Table on Market opportunity by Application ($ million)

10. Market Segmentation by End-user

10.1 Market segments

Chart on End-user - Market share 2025-2030 (%)
Data Table on End-user - Market share 2025-2030 (%)

10.2 Comparison by End-user

Chart on Comparison by End-user
Data Table on Comparison by End-user

10.3 Hospitals - Market size and forecast 2025-2030

Chart on Hospitals - Market size and forecast 2025-2030 ($ million)
Data Table on Hospitals - Market size and forecast 2025-2030 ($ million)
Chart on Hospitals - Year-over-year growth 2025-2030 (%)
Data Table on Hospitals - Year-over-year growth 2025-2030 (%)

10.4 Specialty clinics - Market size and forecast 2025-2030

Chart on Specialty clinics - Market size and forecast 2025-2030 ($ million)
Data Table on Specialty clinics - Market size and forecast 2025-2030 ($ million)
Chart on Specialty clinics - Year-over-year growth 2025-2030 (%)
Data Table on Specialty clinics - Year-over-year growth 2025-2030 (%)

10.5 Ambulatory surgical centers - Market size and forecast 2025-2030

Chart on Ambulatory surgical centers - Market size and forecast 2025-2030 ($ million)
Data Table on Ambulatory surgical centers - Market size and forecast 2025-2030 ($ million)
Chart on Ambulatory surgical centers - Year-over-year growth 2025-2030 (%)
Data Table on Ambulatory surgical centers - Year-over-year growth 2025-2030 (%)

10.6 Dental clinics - Market size and forecast 2025-2030

Chart on Dental clinics - Market size and forecast 2025-2030 ($ million)
Data Table on Dental clinics - Market size and forecast 2025-2030 ($ million)
Chart on Dental clinics - Year-over-year growth 2025-2030 (%)
Data Table on Dental clinics - Year-over-year growth 2025-2030 (%)

10.7 Others - Market size and forecast 2025-2030

Chart on Others - Market size and forecast 2025-2030 ($ million)
Data Table on Others - Market size and forecast 2025-2030 ($ million)
Chart on Others - Year-over-year growth 2025-2030 (%)
Data Table on Others - Year-over-year growth 2025-2030 (%)

10.8 Market opportunity by End-user

Market opportunity by End-user ($ million)
Data Table on Market opportunity by End-user ($ million)

11. Customer Landscape

11.1 Customer landscape overview

Analysis of price sensitivity, lifecycle, customer purchase basket, adoption rates, and purchase criteria

12. Geographic Landscape

12.1 Geographic segmentation

Chart on Market share by geography 2025-2030 (%)
Data Table on Market share by geography 2025-2030 (%)

12.2 Geographic comparison

Chart on Geographic comparison
Data Table on Geographic comparison

12.3 North America - Market size and forecast 2025-2030

Chart on North America - Market size and forecast 2025-2030 ($ million)
Data Table on North America - Market size and forecast 2025-2030 ($ million)
Chart on North America - Year-over-year growth 2025-2030 (%)
Data Table on North America - Year-over-year growth 2025-2030 (%)
Chart on Regional Comparison - North America
Data Table on Regional Comparison - North America

12.3.1 US - Market size and forecast 2025-2030

Chart on US - Market size and forecast 2025-2030 ($ million)
Data Table on US - Market size and forecast 2025-2030 ($ million)
Chart on US - Year-over-year growth 2025-2030 (%)
Data Table on US - Year-over-year growth 2025-2030 (%)

12.3.2 Canada - Market size and forecast 2025-2030

Chart on Canada - Market size and forecast 2025-2030 ($ million)
Data Table on Canada - Market size and forecast 2025-2030 ($ million)
Chart on Canada - Year-over-year growth 2025-2030 (%)
Data Table on Canada - Year-over-year growth 2025-2030 (%)

12.3.3 Mexico - Market size and forecast 2025-2030

Chart on Mexico - Market size and forecast 2025-2030 ($ million)
Data Table on Mexico - Market size and forecast 2025-2030 ($ million)
Chart on Mexico - Year-over-year growth 2025-2030 (%)
Data Table on Mexico - Year-over-year growth 2025-2030 (%)

12.4 Europe - Market size and forecast 2025-2030

Chart on Europe - Market size and forecast 2025-2030 ($ million)
Data Table on Europe - Market size and forecast 2025-2030 ($ million)
Chart on Europe - Year-over-year growth 2025-2030 (%)
Data Table on Europe - Year-over-year growth 2025-2030 (%)
Chart on Regional Comparison - Europe
Data Table on Regional Comparison - Europe

12.4.1 Germany - Market size and forecast 2025-2030

Chart on Germany - Market size and forecast 2025-2030 ($ million)
Data Table on Germany - Market size and forecast 2025-2030 ($ million)
Chart on Germany - Year-over-year growth 2025-2030 (%)
Data Table on Germany - Year-over-year growth 2025-2030 (%)

12.4.2 UK - Market size and forecast 2025-2030

Chart on UK - Market size and forecast 2025-2030 ($ million)
Data Table on UK - Market size and forecast 2025-2030 ($ million)
Chart on UK - Year-over-year growth 2025-2030 (%)
Data Table on UK - Year-over-year growth 2025-2030 (%)

12.4.3 France - Market size and forecast 2025-2030

Chart on France - Market size and forecast 2025-2030 ($ million)
Data Table on France - Market size and forecast 2025-2030 ($ million)
Chart on France - Year-over-year growth 2025-2030 (%)
Data Table on France - Year-over-year growth 2025-2030 (%)

12.4.4 Italy - Market size and forecast 2025-2030

Chart on Italy - Market size and forecast 2025-2030 ($ million)
Data Table on Italy - Market size and forecast 2025-2030 ($ million)
Chart on Italy - Year-over-year growth 2025-2030 (%)
Data Table on Italy - Year-over-year growth 2025-2030 (%)

12.4.5 Spain - Market size and forecast 2025-2030

Chart on Spain - Market size and forecast 2025-2030 ($ million)
Data Table on Spain - Market size and forecast 2025-2030 ($ million)
Chart on Spain - Year-over-year growth 2025-2030 (%)
Data Table on Spain - Year-over-year growth 2025-2030 (%)

12.4.6 The Netherlands - Market size and forecast 2025-2030

Chart on The Netherlands - Market size and forecast 2025-2030 ($ million)
Data Table on The Netherlands - Market size and forecast 2025-2030 ($ million)
Chart on The Netherlands - Year-over-year growth 2025-2030 (%)
Data Table on The Netherlands - Year-over-year growth 2025-2030 (%)

12.5 Asia - Market size and forecast 2025-2030

Chart on Asia - Market size and forecast 2025-2030 ($ million)
Data Table on Asia - Market size and forecast 2025-2030 ($ million)
Chart on Asia - Year-over-year growth 2025-2030 (%)
Data Table on Asia - Year-over-year growth 2025-2030 (%)
Chart on Regional Comparison - Asia
Data Table on Regional Comparison - Asia

12.5.1 China - Market size and forecast 2025-2030

Chart on China - Market size and forecast 2025-2030 ($ million)
Data Table on China - Market size and forecast 2025-2030 ($ million)
Chart on China - Year-over-year growth 2025-2030 (%)
Data Table on China - Year-over-year growth 2025-2030 (%)

12.5.2 Japan - Market size and forecast 2025-2030

Chart on Japan - Market size and forecast 2025-2030 ($ million)
Data Table on Japan - Market size and forecast 2025-2030 ($ million)
Chart on Japan - Year-over-year growth 2025-2030 (%)
Data Table on Japan - Year-over-year growth 2025-2030 (%)

12.5.3 India - Market size and forecast 2025-2030

Chart on India - Market size and forecast 2025-2030 ($ million)
Data Table on India - Market size and forecast 2025-2030 ($ million)
Chart on India - Year-over-year growth 2025-2030 (%)
Data Table on India - Year-over-year growth 2025-2030 (%)

12.5.4 South Korea - Market size and forecast 2025-2030

Chart on South Korea - Market size and forecast 2025-2030 ($ million)
Data Table on South Korea - Market size and forecast 2025-2030 ($ million)
Chart on South Korea - Year-over-year growth 2025-2030 (%)
Data Table on South Korea - Year-over-year growth 2025-2030 (%)

12.5.5 Indonesia - Market size and forecast 2025-2030

Chart on Indonesia - Market size and forecast 2025-2030 ($ million)
Data Table on Indonesia - Market size and forecast 2025-2030 ($ million)
Chart on Indonesia - Year-over-year growth 2025-2030 (%)
Data Table on Indonesia - Year-over-year growth 2025-2030 (%)

12.5.6 Thailand - Market size and forecast 2025-2030

Chart on Thailand - Market size and forecast 2025-2030 ($ million)
Data Table on Thailand - Market size and forecast 2025-2030 ($ million)
Chart on Thailand - Year-over-year growth 2025-2030 (%)
Data Table on Thailand - Year-over-year growth 2025-2030 (%)

12.6 Rest of World (ROW) - Market size and forecast 2025-2030

Chart on Rest of World (ROW) - Market size and forecast 2025-2030 ($ million)
Data Table on Rest of World (ROW) - Market size and forecast 2025-2030 ($ million)
Chart on Rest of World (ROW) - Year-over-year growth 2025-2030 (%)
Data Table on Rest of World (ROW) - Year-over-year growth 2025-2030 (%)
Chart on Regional Comparison - Rest of World (ROW)
Data Table on Regional Comparison - Rest of World (ROW)

12.6.1 Brazil - Market size and forecast 2025-2030

Chart on Brazil - Market size and forecast 2025-2030 ($ million)
Data Table on Brazil - Market size and forecast 2025-2030 ($ million)
Chart on Brazil - Year-over-year growth 2025-2030 (%)
Data Table on Brazil - Year-over-year growth 2025-2030 (%)

12.6.2 Saudi Arabia - Market size and forecast 2025-2030

Chart on Saudi Arabia - Market size and forecast 2025-2030 ($ million)
Data Table on Saudi Arabia - Market size and forecast 2025-2030 ($ million)
Chart on Saudi Arabia - Year-over-year growth 2025-2030 (%)
Data Table on Saudi Arabia - Year-over-year growth 2025-2030 (%)

12.6.3 UAE - Market size and forecast 2025-2030

Chart on UAE - Market size and forecast 2025-2030 ($ million)
Data Table on UAE - Market size and forecast 2025-2030 ($ million)
Chart on UAE - Year-over-year growth 2025-2030 (%)
Data Table on UAE - Year-over-year growth 2025-2030 (%)

12.6.4 South Africa - Market size and forecast 2025-2030

Chart on South Africa - Market size and forecast 2025-2030 ($ million)
Data Table on South Africa - Market size and forecast 2025-2030 ($ million)
Chart on South Africa - Year-over-year growth 2025-2030 (%)
Data Table on South Africa - Year-over-year growth 2025-2030 (%)

12.6.5 Turkey - Market size and forecast 2025-2030

Chart on Turkey - Market size and forecast 2025-2030 ($ million)
Data Table on Turkey - Market size and forecast 2025-2030 ($ million)
Chart on Turkey - Year-over-year growth 2025-2030 (%)
Data Table on Turkey - Year-over-year growth 2025-2030 (%)

12.6.6 Argentina - Market size and forecast 2025-2030

Chart on Argentina - Market size and forecast 2025-2030 ($ million)
Data Table on Argentina - Market size and forecast 2025-2030 ($ million)
Chart on Argentina - Year-over-year growth 2025-2030 (%)
Data Table on Argentina - Year-over-year growth 2025-2030 (%)

12.6.7 Colombia - Market size and forecast 2025-2030

Chart on Colombia - Market size and forecast 2025-2030 ($ million)
Data Table on Colombia - Market size and forecast 2025-2030 ($ million)
Chart on Colombia - Year-over-year growth 2025-2030 (%)
Data Table on Colombia - Year-over-year growth 2025-2030 (%)

12.6.8 Israel - Market size and forecast 2025-2030

Chart on Israel - Market size and forecast 2025-2030 ($ million)
Data Table on Israel - Market size and forecast 2025-2030 ($ million)
Chart on Israel - Year-over-year growth 2025-2030 (%)
Data Table on Israel - Year-over-year growth 2025-2030 (%)

12.7 Market opportunity by geography

Market opportunity by geography ($ million)
Data Tables on Market opportunity by geography ($ million)

13. Drivers, Challenges, and Opportunity

13.1 Market drivers

Increasing incidence of orthopedic disorders and traumatic bone injuries
Growing volume of spinal fusion and reconstructive surgical procedures
Expanding aging population requiring bone regeneration interventions

13.2 Market challenges

High cost burden associated with demineralized bone matrix procedures
Regulatory complexity in donor tissue processing and product approvals
Variability in donor tissue quality affecting product consistency

13.3 Impact of drivers and challenges

Impact of drivers and challenges in 2025 and 2030

13.4 Market opportunities

Advancing development of moldable and procedure-specific demineralized bone matrix formulations
Increasing integration of cellular components with demineralized bone matrix products
Evolving focus on evidence-based product differentiation through clinical outcome data

14. Competitive Landscape

14.1 Overview

14.2

Overview on criticality of inputs and factors of differentiation

14.3 Landscape disruption

Overview on factors of disruption

14.4 Industry risks

Impact of key risks on business

15. Competitive Analysis

15.1 Companies profiled

Companies covered

15.2 Company ranking index

15.3 Market positioning of companies

Matrix on companies position and classification

15.4 Arthrex Inc.

Arthrex Inc. - Overview
Arthrex Inc. - Product / Service
Arthrex Inc. - Key offerings
SWOT

15.5 Bioventus LLC

Bioventus LLC - Overview
Bioventus LLC - Business segments
Bioventus LLC - Key offerings
Bioventus LLC - Segment focus
SWOT

15.6 CG Bio

CG Bio - Overview
CG Bio - Product / Service
CG Bio - Key offerings
SWOT

15.7 Gebruder Martin GmbH and Co.

Gebruder Martin GmbH and Co. - Overview
Gebruder Martin GmbH and Co. - Product / Service
Gebruder Martin GmbH and Co. - Key offerings
SWOT

15.8 Globus Medical Inc.

Globus Medical Inc. - Overview
Globus Medical Inc. - Product / Service
Globus Medical Inc. - Key offerings
SWOT

15.9 Integra LifeSciences Corp.

Integra LifeSciences Corp. - Overview
Integra LifeSciences Corp. - Business segments
Integra LifeSciences Corp. - Key offerings
Integra LifeSciences Corp. - Segment focus
SWOT

15.10 Isto Biologics

Isto Biologics - Overview
Isto Biologics - Product / Service
Isto Biologics - Key offerings
SWOT

15.11 Johnson and Johnson MedTech

Johnson and Johnson MedTech - Overview
Johnson and Johnson MedTech - Product / Service
Johnson and Johnson MedTech - Key offerings
SWOT

15.12 Medtronic Plc

Medtronic Plc - Overview
Medtronic Plc - Business segments
Medtronic Plc - Key news
Medtronic Plc - Key offerings
Medtronic Plc - Segment focus
SWOT

15.13 Organogenesis Holdings Inc.

Organogenesis Holdings Inc. - Overview
Organogenesis Holdings Inc. - Business segments
Organogenesis Holdings Inc. - Key offerings
Organogenesis Holdings Inc. - Segment focus
SWOT

15.14 Orthofix Medical Inc.

Orthofix Medical Inc. - Overview
Orthofix Medical Inc. - Business segments
Orthofix Medical Inc. - Key news
Orthofix Medical Inc. - Key offerings
Orthofix Medical Inc. - Segment focus
SWOT

15.15 RTI Surgical Inc.

RTI Surgical Inc. - Overview
RTI Surgical Inc. - Product / Service
RTI Surgical Inc. - Key offerings
SWOT

15.16 Spinal Elements Inc.

Spinal Elements Inc. - Overview
Spinal Elements Inc. - Product / Service
Spinal Elements Inc. - Key offerings
SWOT

15.17 Stryker Corp.

Stryker Corp. - Overview
Stryker Corp. - Business segments
Stryker Corp. - Key news
Stryker Corp. - Key offerings
Stryker Corp. - Segment focus
SWOT

15.18 Zimmer Biomet Holdings Inc.

Zimmer Biomet Holdings Inc. - Overview
Zimmer Biomet Holdings Inc. - Business segments
Zimmer Biomet Holdings Inc. - Key news
Zimmer Biomet Holdings Inc. - Key offerings
Zimmer Biomet Holdings Inc. - Segment focus
SWOT

16. Appendix

16.1 Scope of the report

Market definition
Objectives
Notes and caveats

16.2 Inclusions and exclusions checklist

Inclusions checklist
Exclusions checklist

16.3 Currency conversion rates for US$

16.4 Research methodology

16.5 Data procurement

Information sources

16.6 Data validation

16.7 Validation techniques employed for market sizing

16.8 Data synthesis

16.9 360 degree market analysis

16.10 List of abbreviations

Research Methodology

Technavio presents a detailed picture of the market by way of study, synthesis, and summation of data from multiple sources. The analysts have presented the various facets of the market with a particular focus on identifying the key industry influencers. The data thus presented is comprehensive, reliable, and the result of extensive research, both primary and secondary.

INFORMATION SOURCES

Primary sources

  • Manufacturers and suppliers
  • Channel partners
  • Industry experts
  • Strategic decision makers

Secondary sources

  • Industry journals and periodicals
  • Government data
  • Financial reports of key industry players
  • Historical data
  • Press releases

DATA ANALYSIS

Data Synthesis

  • Collation of data
  • Estimation of key figures
  • Analysis of derived insights

Data Validation

  • Triangulation with data models
  • Reference against proprietary databases
  • Corroboration with industry experts

REPORT WRITING

Qualitative

  • Market drivers
  • Market challenges
  • Market trends
  • Five forces analysis

Quantitative

  • Market size and forecast
  • Market segmentation
  • Geographical insights
  • Competitive landscape

Interested in this report?

Get your sample now to see our research methodology and insights!

Download Now

Frequently Asked Questions

Demineralized Bone Matrix market growth will increase by USD 556.0 million during 2026-2030.

The Demineralized Bone Matrix market is expected to grow at a CAGR of 7.3% during 2026-2030.

Demineralized Bone Matrix market is segmented by Type (Putty, Gel, Particle, Block) Application (Spinal fusion surgery, Trauma surgery, Dental applications, Others) End-user (Hospitals, Specialty clinics, Ambulatory surgical centers, Dental clinics, Others)

Arthrex Inc., Bioventus LLC, CG Bio, Exactech Inc., Gebruder Martin GmbH and Co., Globus Medical Inc., Hans Biomed Co. Ltd., Integra LifeSciences Corp., Isto Biologics, Johnson and Johnson MedTech, LifeNet Health Inc., Medtronic Plc, Organogenesis Holdings Inc., Orthofix Medical Inc., RTI Surgical Inc., Spinal Elements Inc., Stryker Corp., Vivex Biologics Inc., Zimmer Biomet Holdings Inc. are a few of the key vendors in the Demineralized Bone Matrix market.

North America will register the highest growth rate of 37.8% among the other regions. Therefore, the Demineralized Bone Matrix market in North America is expected to garner significant business opportunities for the vendors during the forecast period.

US, Canada, Mexico, Germany, UK, France, Italy, Spain, The Netherlands, China, Japan, India, South Korea, Indonesia, Thailand, Brazil, Saudi Arabia, UAE, South Africa, Turkey, Argentina, Colombia, Israel

  • Increasing incidence of orthopedic disorders and traumatic bone injuries is the driving factor this market.

The Demineralized Bone Matrix market vendors should focus on grabbing business opportunities from the Type segment as it accounted for the largest market share in the base year.
RIA - Research AI Assistant
Ask RIA
