
Digital Asset Management Market Analysis, Size, and Forecast 2026-2030: North America (US, Canada, and Mexico), Europe (Germany, UK, and France), APAC (China, Japan, and India), South America (Brazil, Argentina, and Chile), Middle East and Africa (Saudi Arabia, UAE, and South Africa), and Rest of World (ROW)

Digital Asset Management Market Analysis, Size, and Forecast 2026-2030:
North America (US, Canada, and Mexico), Europe (Germany, UK, and France), APAC (China, Japan, and India), South America (Brazil, Argentina, and Chile), Middle East and Africa (Saudi Arabia, UAE, and South Africa), and Rest of World (ROW)

Published: Oct 2026 287 Pages SKU: IRTNTR43522

Market Overview at a Glance

$24.68 B
Market Opportunity
24.4%
CAGR 2025 - 2030
32.3%
APAC Growth
$6.42 B
On-premises segment 2024

Digital Asset Management Market Size 2026-2030

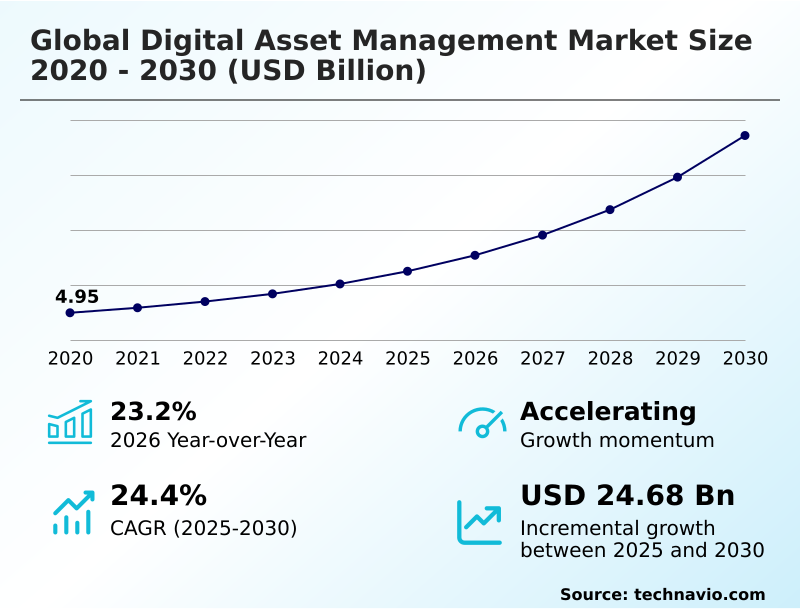
The digital asset management market size is valued to increase by USD 24.68 billion, at a CAGR of 24.4% from 2025 to 2030. Growing enterprise demand for centralized digital content management will drive the digital asset management market.

Major Market Trends & Insights

  • APAC dominated the market and accounted for a 32.3% growth during the forecast period.
  • By Deployment - On-premises segment was valued at USD 6.42 billion in 2024
  • By End-user - Large enterprise segment accounted for the largest market revenue share in 2024

Market Size & Forecast

  • Market Opportunities: USD 32.23 billion
  • Market Future Opportunities: USD 24.68 billion
  • CAGR from 2025 to 2030 : 24.4%

Market Summary

  • The Digital Asset Management Market is experiencing robust expansion as enterprises increasingly transition from fragmented storage systems to centralized content ecosystems. Organizations managing complex marketing supply chains utilize these platforms to orchestrate omnichannel content distribution, ensuring that approved brand materials reach regional distributors and digital storefronts simultaneously.
  • Implementing a centralized content hub improves asset reuse rates by 35% compared to organizations relying on isolated departmental drives. The growing enterprise demand for centralized digital content management acts as a primary driver, as companies require single-source-of-truth architectures to streamline creative approvals and reduce time-to-market for promotional campaigns.
  • Conversely, metadata inconsistency across fragmented digital content repositories presents a substantial challenge, often obstructing efficient asset retrieval and complicating compliance audits. Modern platforms increasingly incorporate a semantic search algorithm to mitigate these inefficiencies and enhance user discoverability. Advanced asset management frameworks enable businesses to maintain brand consistency while optimizing productivity.
  • By standardizing taxonomy and governance protocols, enterprises significantly reduce the operational friction associated with managing high-volume digital asset portfolios.

What will be the Size of the Digital Asset Management Market during the forecast period?
Get Key Insights on Market Forecast (PDF) Get Free Sample

How is the Digital Asset Management Market Segmented?

The digital asset management industry research report provides comprehensive data (region-wise segment analysis), with forecasts and estimates in "USD million" for the period 2026-2030, as well as historical data from 2020-2024 for the following segments.

  • Deployment
    • On-premises
    • Cloud
  • End-user
    • Large enterprise
    • Small and medium enterprise
  • Component
    • Solutions
    • Services
  • Geography
    • North America
      • US
      • Canada
      • Mexico
    • Europe
      • Germany
      • UK
      • France
      • Italy
      • Spain
      • The Netherlands
    • APAC
      • China
      • Japan
      • India
      • South Korea
      • Australia
      • Indonesia
    • South America
      • Brazil
      • Argentina
      • Chile
    • Middle East and Africa
      • Saudi Arabia
      • UAE
      • South Africa
      • Israel
      • Turkey

By Deployment Insights

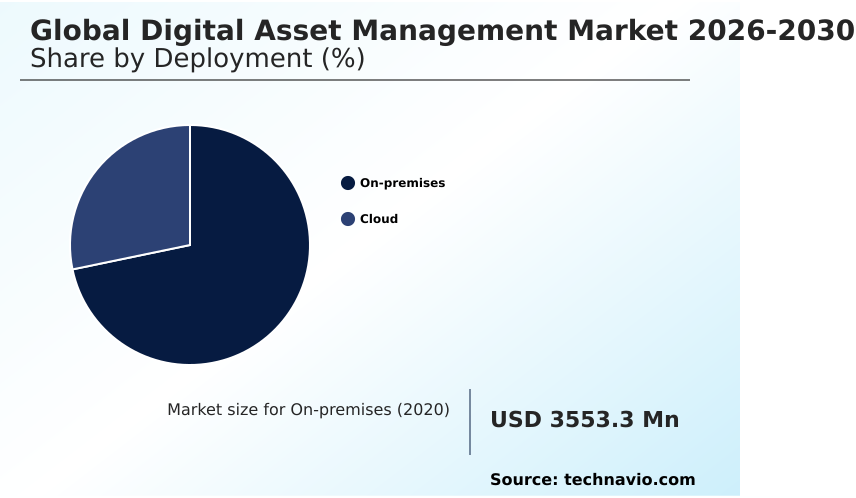
The on-premises segment is estimated to witness significant growth during the forecast period.

The on-premises segment of the Digital Asset Management market provides organizations with direct control over infrastructure, data privacy, and taxonomic structuring framework implementations.

Enterprises in highly regulated sectors prefer this deployment to maintain strict governance standards and safeguard sensitive digital assets. By utilizing an advanced semantic search algorithm internally, businesses ensure continuous alignment with local data residency laws and intellectual property mandates.

This deployment model allows administrators to build a robust custom permission structure that directly integrates with existing proprietary networks.

Organizations leveraging on-premises platforms report that strict digital rights management and controlled access reduce unauthorized asset distribution by 22%, significantly lowering regulatory exposure. Internal management also enables the enforcement of a rigorous version control protocol, facilitating reliable asset preservation.
Get Free Sample

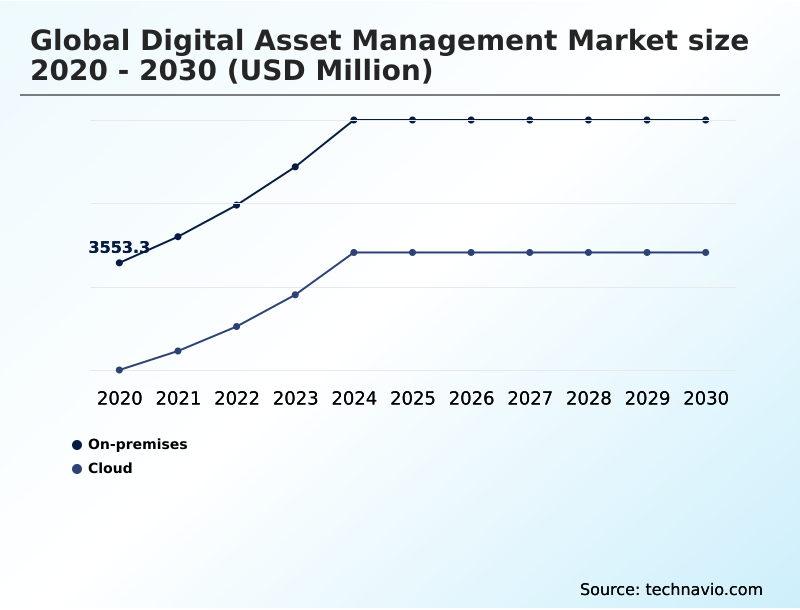
The On-premises segment was valued at USD 6.42 billion in 2024 and showed a gradual increase during the forecast period.
Get Free Sample

Regional Analysis

APAC is estimated to contribute 32.3% to the growth of the global market during the forecast period.Technavio’s analysts have elaborately explained the regional trends and drivers that shape the market during the forecast period.
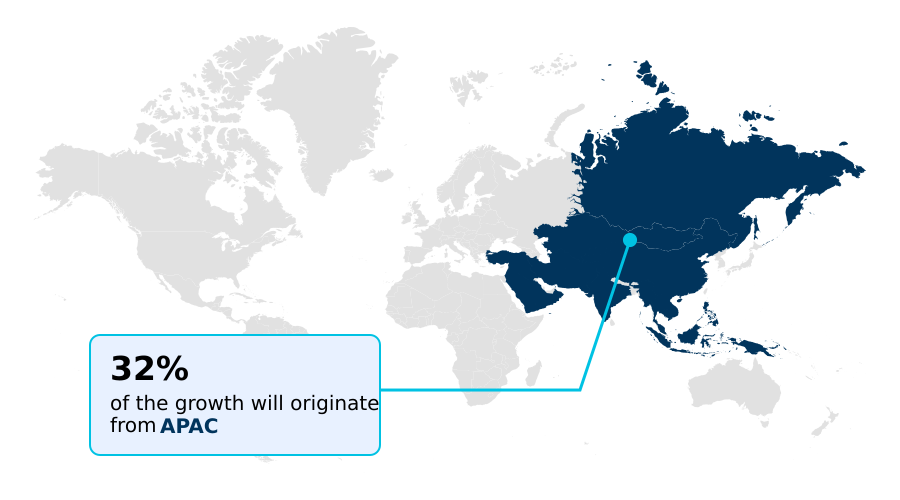
See How Digital Asset Management Market Demand is Rising in APAC Get Free Sample

The geographic landscape of the Digital Asset Management highlights distinct variations in technology adoption and enterprise content strategies.

North America demonstrates aggressive implementation of advanced brand identity governance tools, driven by the intense demand for marketing resource coordination across large-scale retail and media networks.

This rapid adoption enables North American firms to achieve a 28% higher asset reuse efficiency compared to organizations in Europe. European enterprises, constrained by stringent data privacy regulations, prioritize secure distributed workforce collaboration through a highly regulated cloud native repository.

Meanwhile, APAC is expanding its content infrastructure rapidly to support mobile-first consumer engagement. Companies in APAC utilizing advanced enterprise taxonomy design report a 35% reduction in manual file sorting efforts. Both regions emphasize centralized governance to streamline creative operations.

Market Dynamics

Our researchers analyzed the data with 2025 as the base year, along with the key drivers, trends, and challenges. A holistic analysis of drivers will help companies refine their marketing strategies to gain a competitive advantage.

  • As organizations scale their digital operations, managing vast libraries of multimedia requires sophisticated technological infrastructure and strategic foresight. A critical component of this modernization is robust enterprise taxonomy design and structuring, which ensures that all digital files are classified according to a unified corporate standard.
  • Implementing a cloud based collaborative asset repository allows creative and marketing departments to access approved resources seamlessly, bridging geographic divides and accelerating campaign execution. Compared to legacy on-premises databases, modern cloud architectures improve remote access speeds by nearly 45%, significantly enhancing supply chain coordination for global product launches.
  • Maintaining metadata consistency in distributed teams is essential to prevent search friction and asset duplication, which frequently drain administrative resources. To address these inefficiencies, enterprises are increasingly deploying automated tagging for visual content, utilizing advanced machine learning algorithms to scan and categorize high-resolution media upon ingestion. This capability eliminates the reliance on manual data entry and improves overall discoverability.
  • Furthermore, navigating diverse international regulations necessitates rigorous cross border content compliance monitoring. By integrating permission controls and automated rights management directly into the asset lifecycle, organizations minimize the risk of intellectual property violations and regulatory penalties. These interconnected capabilities empower businesses to transform their digital asset operations into highly efficient, governed, and scalable ecosystems that support continuous commercial growth.
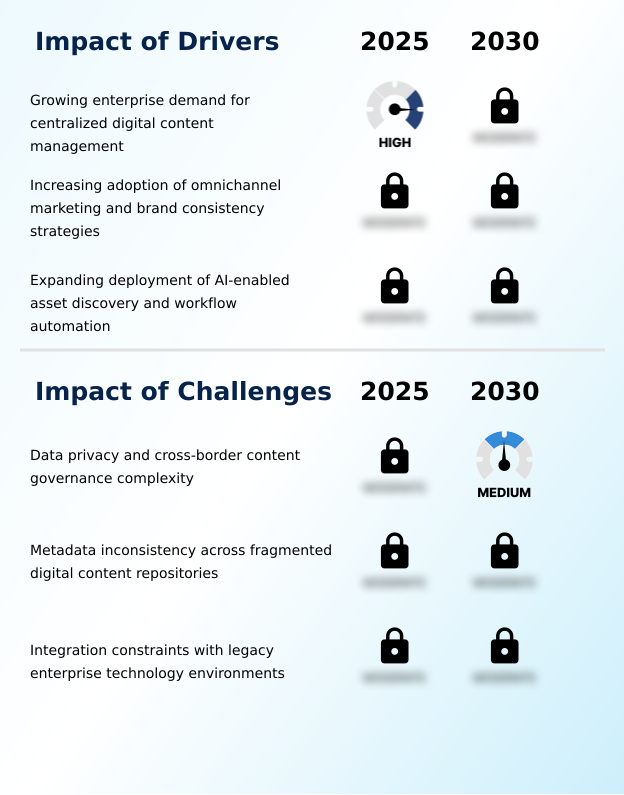
What are the key market drivers leading to the rise in the adoption of Digital Asset Management Industry?

  • The growing enterprise demand for centralized digital content management serves as a primary catalyst propelling the market, enabling organizations to unify asset repositories and streamline complex workflows.

  • The escalating demand for centralized content visibility is propelling rapid modernization within enterprise information architectures. Organizations face mounting pressure to accelerate campaign deployments, necessitating a robust workflow orchestration engine to coordinate complex, multi-stage approvals.
  • The deployment of predictive asset tagging and metadata auto classification automates the categorization of visual media, which decreases manual administrative overhead by 35%. This technological shift directly improves asset utilization, allowing distributed teams to locate approved marketing materials with precision.
  • Furthermore, utilizing a dedicated content localization tool alongside automated review routing enables businesses to adapt global campaigns for regional audiences seamlessly, improving regional engagement metrics by 20%.
  • These capabilities eliminate workflow bottlenecks, ensuring that enterprises can scale their content operations efficiently.

What are the market trends shaping the Digital Asset Management Industry?

  • The accelerating shift toward cloud-native digital asset management platforms is emerging as a critical market trend. Organizations are increasingly adopting these scalable architectures to support distributed workforces and enhance operational agility.

  • The transition toward a highly flexible composable content architecture is fundamentally redefining how organizations approach digital asset operations. This trend emerges as businesses require agile frameworks to deliver personalized media across a growing matrix of consumer touchpoints. By prioritizing intelligent search functionality, enterprises can seamlessly link and retrieve assets, reducing system integration delays by 30%.
  • The incorporation of generative content enrichment and dynamic asset transformation allows marketing teams to automatically resize and adapt visual media for specific channels, lowering creative production costs by 22%. Consequently, organizations execute omnichannel content distribution strategies with greater speed and accuracy. This architectural shift empowers companies to maximize content utility while maintaining stringent brand oversight and improving campaign delivery cycles.

What challenges does the Digital Asset Management Industry face during its growth?

  • Data privacy requirements and the complexity of cross-border content governance remain significant challenges, forcing organizations to navigate fragmented regulatory frameworks when managing digital assets globally.

  • Fragmented structural metadata and disparate storage ecosystems present significant operational barriers to effective multimedia lifecycle orchestration. Many organizations struggle with legacy system integration, as connecting outdated archival databases to modern cloud interfaces frequently disrupts established digital workflows. Poorly defined categorization frameworks severely lower the asset discoverability index, forcing creative teams to continuously recreate existing promotional materials.
  • Resolving these administrative inefficiencies through targeted content duplication reduction initiatives can improve overall storage utilization by 25%, significantly lowering network hosting expenses. Additionally, establishing a standardized compliance monitoring protocol across diverse geographic regions complicates data governance.
  • These structural limitations increase the risk of unauthorized asset usage and regulatory penalties by up to 18% compared to fully unified environments, compelling enterprises to restructure their operations.

Exclusive Technavio Analysis on Customer Landscape

The digital asset management market forecasting report includes the adoption lifecycle of the market, covering from the innovator’s stage to the laggard’s stage. It focuses on adoption rates in different regions based on penetration. Furthermore, the digital asset management market report also includes key purchase criteria and drivers of price sensitivity to help companies evaluate and develop their market growth analysis strategies.
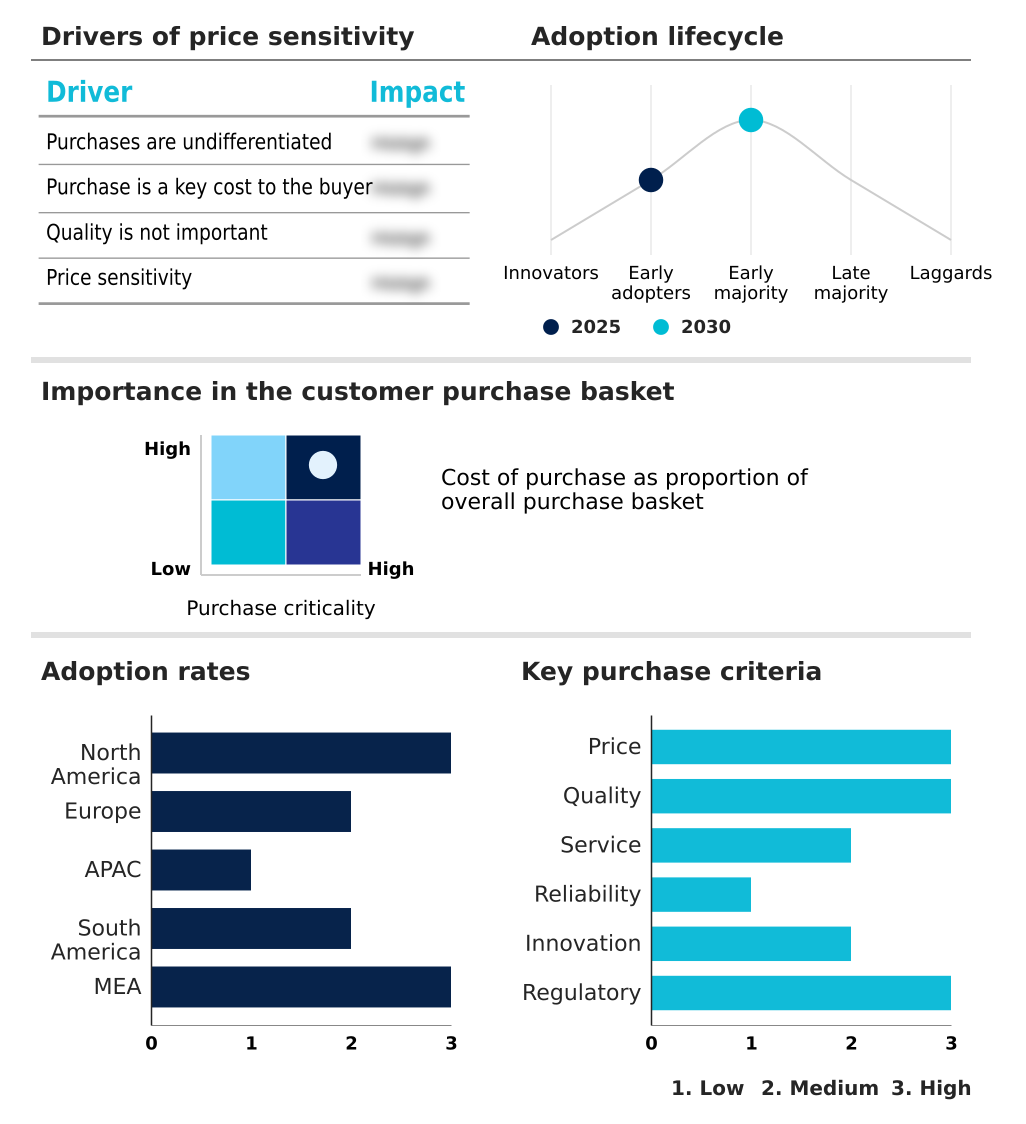
Customer Landscape of Digital Asset Management Industry

Competitive Landscape

Companies are implementing various strategies, such as strategic alliances, digital asset management market forecast, partnerships, mergers and acquisitions, geographical expansion, and product/service launches, to enhance their presence in the industry.

Acquia Inc. - The platform provides unified digital asset management integrating cloud-based content hubs and digital experience frameworks to optimize marketing workflows and enhance organizational brand consistency across all channels.

The industry research and growth report includes detailed analyses of the competitive landscape of the market and information about key companies, including:

  • Acquia Inc.
  • Adobe Inc.
  • Aprimo
  • Bynder B.V.
  • Canto Inc.
  • CELUM GmbH
  • Censhare GmbH
  • Cloudinary Ltd.
  • Daminion Software
  • Esko Graphics BV
  • Frontify AG
  • Hyland Software Inc.
  • MediaValet Inc.
  • Open Text Corp.
  • Orange Logic LLC
  • Papirfly Group
  • PhotoShelter Inc.
  • Pimcore GmbH
  • Sitecore Holding Ltd.

Qualitative and quantitative analysis of companies has been conducted to help clients understand the wider business environment as well as the strengths and weaknesses of key industry players. Data is qualitatively analyzed to categorize companies as pure play, category-focused, industry-focused, and diversified; it is quantitatively analyzed to categorize companies as dominant, leading, strong, tentative, and weak.

Recent Development and News in Digital asset management market

  • In the Application Software industry, the rapid transition toward headless content delivery frameworks has enabled organizations to decouple backend repositories from frontend presentation layers, directly impacting Digital Asset Management demand by requiring flexible infrastructure to serve assets across endpoints. This structural shift allows enterprises to integrate intelligent search functionality, leading to a 35% improvement in retrieval efficiency. The inclusion of a content localization tool further supports faster campaign rollouts across global markets.
  • The widespread adoption of predictive AI models within enterprise resource planning suites has streamlined complex data handling, accelerating the need for asset repositories to maintain operational synchronization. By embedding automated review routing into daily operations, large scale enterprises have improved distributed workforce collaboration and increased content retrieval speeds by up to 40%.
  • Stringent data privacy regulations governing customer engagement have forced application software providers to overhaul their security infrastructure, pulling demand for advanced governance within unified asset ecosystems. Implementing strict marketing resource coordination ensures compliance with European mandates, while refining enterprise taxonomy design lowers the risk of regulatory violations by 28%.
  • The shift toward cloud-based productivity ecosystems has fundamentally altered how creative teams operate, necessitating robust architectural integration to connect older archival databases with modern applications. Upgrading these systems with dynamic asset transformation capabilities reduces duplication efforts, while a custom permission structure boosts overall team productivity by 18%.

Dive into Technavio’s robust research methodology, blending expert interviews, extensive data synthesis, and validated models for unparalleled Digital Asset Management Market insights. See full methodology.

Market Scope
Page number 287
Base year 2025
Historic period 2020-2024
Forecast period 2026-2030
Growth momentum & CAGR Accelerate at a CAGR of 24.4%
Market growth 2026-2030 USD 24678.7 million
Market structure Fragmented
YoY growth 2025-2026(%) 23.2%
Key countries US, Canada, Mexico, Germany, UK, France, Italy, Spain, The Netherlands, China, Japan, India, South Korea, Australia, Indonesia, Brazil, Argentina, Chile, Saudi Arabia, UAE, South Africa, Israel and Turkey
Competitive landscape Leading Companies, Market Positioning of Companies, Competitive Strategies, and Industry Risks

Request Free Sample

Research Analyst Overview

  • The Digital Asset Management architecture is continuously evolving to support the complex requirements of modern enterprise content operations. Organizations are shifting away from fragmented storage toward a unified cloud native repository that centralizes multimedia assets and streamlines creative workflows. The integration of metadata auto classification and advanced visual media parsing enables companies to process high-volume digital ingestions with unprecedented accuracy.
  • By implementing these intelligent frameworks, enterprises experience a 40% reduction in asset retrieval times compared to manual folder navigation, directly impacting operational budgeting and resource allocation. Strategic decision-making around brand identity governance relies heavily on maintaining a strict version control protocol, ensuring that regional marketing teams deploy only approved, up-to-date materials.
  • Furthermore, the adoption of generative content enrichment tools allows businesses to adapt existing creative assets dynamically for diverse consumer segments. Sustaining a highly organized and scalable media archive is no longer a localized IT function but a boardroom-level priority that dictates how quickly and safely an organization can execute omnichannel campaigns.
  • These technological advancements collectively drive greater workflow efficiency, compliance adherence, and content monetization.

What are the Key Data Covered in this Digital Asset Management Market Research and Growth Report?

  • What is the expected growth of the Digital Asset Management Market between 2026 and 2030?

    • USD 24.68 billion, at a CAGR of 24.4%

  • What segmentation does the market report cover?

    • The report is segmented by Deployment (On-premises, and Cloud), End-user (Large enterprise, and Small and medium enterprise), Component (Solutions, and Services) and Geography (North America, Europe, APAC, South America, Middle East and Africa)

  • Which regions are analyzed in the report?

    • North America, Europe, APAC, South America and Middle East and Africa

  • What are the key growth drivers and market challenges?

    • Growing enterprise demand for centralized digital content management, Data privacy and cross-border content governance complexity

  • Who are the major players in the Digital Asset Management Market?

    • Acquia Inc., Adobe Inc., Aprimo, Bynder B.V., Canto Inc., CELUM GmbH, Censhare GmbH, Cloudinary Ltd., Daminion Software, Esko Graphics BV, Frontify AG, Hyland Software Inc., MediaValet Inc., Open Text Corp., Orange Logic LLC, Papirfly Group, PhotoShelter Inc., Pimcore GmbH and Sitecore Holding Ltd.

Market Research Insights

  • The Digital Asset Management Market enables organizations to optimize vast multimedia libraries through structured governance and operational efficiency. By leveraging intelligent search functionality, enterprises can reduce asset retrieval times by up to 40% compared to legacy folder structures. The integration of automated review routing accelerates the creative production cycle, improving campaign launch speeds by 25%.
  • Furthermore, implementing a robust content localization tool helps global marketing teams adapt regional messaging seamlessly, increasing asset utilization rates by 30%. These platforms support rigorous brand consistency enforcement by restricting unauthorized file sharing and ensuring all distributed materials meet corporate standards. Consequently, businesses achieve higher productivity and lower administrative overhead while maintaining strict control over their entire digital asset ecosystem.

We can help! Our analysts can customize this digital asset management market research report to meet your requirements.

Get in touch

1. Executive Summary

1.1 Market overview

Executive Summary - Chart on Market Overview
Executive Summary - Data Table on Market Overview
Executive Summary - Chart on Global Market Characteristics
Executive Summary - Chart on Market by Geography
Executive Summary - Chart on Market Segmentation by Deployment
Executive Summary - Chart on Market Segmentation by End-user
Executive Summary - Chart on Market Segmentation by Component
Executive Summary - Chart on Incremental Growth
Executive Summary - Data Table on Incremental Growth
Executive Summary - Chart on Company Market Positioning

2. Technavio Analysis

2.1 Analysis of price sensitivity, lifecycle, customer purchase basket, adoption rates, and purchase criteria

2.2 Criticality of inputs and Factors of differentiation

Chart on Overview on criticality of inputs and factors of differentiation

2.3 Factors of disruption

Chart on Overview on factors of disruption

2.4 Impact of drivers and challenges

Chart on Impact of drivers and challenges in 2025 and 2030

3. Market Landscape

3.1 Market ecosystem

Chart on Parent Market
Data Table on - Parent Market

3.2 Market characteristics

Chart on Market characteristics analysis

3.3 Value chain analysis

Chart on Value chain analysis

4. Market Sizing

4.1 Market definition

Data Table on Offerings of companies included in the market definition

4.2 Market segment analysis

Market segments

4.3 Market size 2025

4.4 Market outlook: Forecast for 2025-2030

Chart on Global - Market size and forecast 2025-2030 ($ million)
Data Table on Global - Market size and forecast 2025-2030 ($ million)
Chart on Global Market: Year-over-year growth 2025-2030 (%)
Data Table on Global Market: Year-over-year growth 2025-2030 (%)

5. Historic Market Size

5.1 Global Digital Asset Management Market 2020 - 2024

Historic Market Size - Data Table on Global Digital Asset Management Market 2020 - 2024 ($ million)

5.2 Deployment segment analysis 2020 - 2024

Historic Market Size - Deployment Segment 2020 - 2024 ($ million)

5.3 End-user segment analysis 2020 - 2024

Historic Market Size - End-user Segment 2020 - 2024 ($ million)

5.4 Component segment analysis 2020 - 2024

Historic Market Size - Component Segment 2020 - 2024 ($ million)

5.5 Geography segment analysis 2020 - 2024

Historic Market Size - Geography Segment 2020 - 2024 ($ million)

5.6 Country segment analysis 2020 - 2024

Historic Market Size - Country Segment 2020 - 2024 ($ million)

6. Qualitative Analysis

6.1 Impact of AI on global digital asset management market

6.2 Impact of geopolitical conflicts on global digital asset management market

7. Five Forces Analysis

7.1 Five forces summary

Five forces analysis - Comparison between 2025 and 2030

7.2 Bargaining power of buyers

Bargaining power of buyers - Impact of key factors 2025 and 2030

7.3 Bargaining power of suppliers

Bargaining power of suppliers - Impact of key factors in 2025 and 2030

7.4 Threat of new entrants

Threat of new entrants - Impact of key factors in 2025 and 2030

7.5 Threat of substitutes

Threat of substitutes - Impact of key factors in 2025 and 2030

7.6 Threat of rivalry

Threat of rivalry - Impact of key factors in 2025 and 2030

7.7 Market condition

Chart on Market condition - Five forces 2025 and 2030

8. Market Segmentation by Deployment

8.1 Market segments

Chart on Deployment - Market share 2025-2030 (%)
Data Table on Deployment - Market share 2025-2030 (%)

8.2 Comparison by Deployment

Chart on Comparison by Deployment
Data Table on Comparison by Deployment

8.3 On-premises - Market size and forecast 2025-2030

Chart on On-premises - Market size and forecast 2025-2030 ($ million)
Data Table on On-premises - Market size and forecast 2025-2030 ($ million)
Chart on On-premises - Year-over-year growth 2025-2030 (%)
Data Table on On-premises - Year-over-year growth 2025-2030 (%)

8.4 Cloud - Market size and forecast 2025-2030

Chart on Cloud - Market size and forecast 2025-2030 ($ million)
Data Table on Cloud - Market size and forecast 2025-2030 ($ million)
Chart on Cloud - Year-over-year growth 2025-2030 (%)
Data Table on Cloud - Year-over-year growth 2025-2030 (%)

8.5 Market opportunity by Deployment

Market opportunity by Deployment ($ million)
Data Table on Market opportunity by Deployment ($ million)

9. Market Segmentation by End-user

9.1 Market segments

Chart on End-user - Market share 2025-2030 (%)
Data Table on End-user - Market share 2025-2030 (%)

9.2 Comparison by End-user

Chart on Comparison by End-user
Data Table on Comparison by End-user

9.3 Large enterprise - Market size and forecast 2025-2030

Chart on Large enterprise - Market size and forecast 2025-2030 ($ million)
Data Table on Large enterprise - Market size and forecast 2025-2030 ($ million)
Chart on Large enterprise - Year-over-year growth 2025-2030 (%)
Data Table on Large enterprise - Year-over-year growth 2025-2030 (%)

9.4 Small and medium enterprise - Market size and forecast 2025-2030

Chart on Small and medium enterprise - Market size and forecast 2025-2030 ($ million)
Data Table on Small and medium enterprise - Market size and forecast 2025-2030 ($ million)
Chart on Small and medium enterprise - Year-over-year growth 2025-2030 (%)
Data Table on Small and medium enterprise - Year-over-year growth 2025-2030 (%)

9.5 Market opportunity by End-user

Market opportunity by End-user ($ million)
Data Table on Market opportunity by End-user ($ million)

10. Market Segmentation by Component

10.1 Market segments

Chart on Component - Market share 2025-2030 (%)
Data Table on Component - Market share 2025-2030 (%)

10.2 Comparison by Component

Chart on Comparison by Component
Data Table on Comparison by Component

10.3 Solutions - Market size and forecast 2025-2030

Chart on Solutions - Market size and forecast 2025-2030 ($ million)
Data Table on Solutions - Market size and forecast 2025-2030 ($ million)
Chart on Solutions - Year-over-year growth 2025-2030 (%)
Data Table on Solutions - Year-over-year growth 2025-2030 (%)

10.4 Services - Market size and forecast 2025-2030

Chart on Services - Market size and forecast 2025-2030 ($ million)
Data Table on Services - Market size and forecast 2025-2030 ($ million)
Chart on Services - Year-over-year growth 2025-2030 (%)
Data Table on Services - Year-over-year growth 2025-2030 (%)

10.5 Market opportunity by Component

Market opportunity by Component ($ million)
Data Table on Market opportunity by Component ($ million)

11. Customer Landscape

11.1 Customer landscape overview

Analysis of price sensitivity, lifecycle, customer purchase basket, adoption rates, and purchase criteria

12. Geographic Landscape

12.1 Geographic segmentation

Chart on Market share by geography 2025-2030 (%)
Data Table on Market share by geography 2025-2030 (%)

12.2 Geographic comparison

Chart on Geographic comparison
Data Table on Geographic comparison

12.3 North America - Market size and forecast 2025-2030

Chart on North America - Market size and forecast 2025-2030 ($ million)
Data Table on North America - Market size and forecast 2025-2030 ($ million)
Chart on North America - Year-over-year growth 2025-2030 (%)
Data Table on North America - Year-over-year growth 2025-2030 (%)
Chart on Regional Comparison - North America
Data Table on Regional Comparison - North America

12.3.1 US - Market size and forecast 2025-2030

Chart on US - Market size and forecast 2025-2030 ($ million)
Data Table on US - Market size and forecast 2025-2030 ($ million)
Chart on US - Year-over-year growth 2025-2030 (%)
Data Table on US - Year-over-year growth 2025-2030 (%)

12.3.2 Canada - Market size and forecast 2025-2030

Chart on Canada - Market size and forecast 2025-2030 ($ million)
Data Table on Canada - Market size and forecast 2025-2030 ($ million)
Chart on Canada - Year-over-year growth 2025-2030 (%)
Data Table on Canada - Year-over-year growth 2025-2030 (%)

12.3.3 Mexico - Market size and forecast 2025-2030

Chart on Mexico - Market size and forecast 2025-2030 ($ million)
Data Table on Mexico - Market size and forecast 2025-2030 ($ million)
Chart on Mexico - Year-over-year growth 2025-2030 (%)
Data Table on Mexico - Year-over-year growth 2025-2030 (%)

12.4 Europe - Market size and forecast 2025-2030

Chart on Europe - Market size and forecast 2025-2030 ($ million)
Data Table on Europe - Market size and forecast 2025-2030 ($ million)
Chart on Europe - Year-over-year growth 2025-2030 (%)
Data Table on Europe - Year-over-year growth 2025-2030 (%)
Chart on Regional Comparison - Europe
Data Table on Regional Comparison - Europe

12.4.1 Germany - Market size and forecast 2025-2030

Chart on Germany - Market size and forecast 2025-2030 ($ million)
Data Table on Germany - Market size and forecast 2025-2030 ($ million)
Chart on Germany - Year-over-year growth 2025-2030 (%)
Data Table on Germany - Year-over-year growth 2025-2030 (%)

12.4.2 UK - Market size and forecast 2025-2030

Chart on UK - Market size and forecast 2025-2030 ($ million)
Data Table on UK - Market size and forecast 2025-2030 ($ million)
Chart on UK - Year-over-year growth 2025-2030 (%)
Data Table on UK - Year-over-year growth 2025-2030 (%)

12.4.3 France - Market size and forecast 2025-2030

Chart on France - Market size and forecast 2025-2030 ($ million)
Data Table on France - Market size and forecast 2025-2030 ($ million)
Chart on France - Year-over-year growth 2025-2030 (%)
Data Table on France - Year-over-year growth 2025-2030 (%)

12.4.4 Italy - Market size and forecast 2025-2030

Chart on Italy - Market size and forecast 2025-2030 ($ million)
Data Table on Italy - Market size and forecast 2025-2030 ($ million)
Chart on Italy - Year-over-year growth 2025-2030 (%)
Data Table on Italy - Year-over-year growth 2025-2030 (%)

12.4.5 Spain - Market size and forecast 2025-2030

Chart on Spain - Market size and forecast 2025-2030 ($ million)
Data Table on Spain - Market size and forecast 2025-2030 ($ million)
Chart on Spain - Year-over-year growth 2025-2030 (%)
Data Table on Spain - Year-over-year growth 2025-2030 (%)

12.4.6 The Netherlands - Market size and forecast 2025-2030

Chart on The Netherlands - Market size and forecast 2025-2030 ($ million)
Data Table on The Netherlands - Market size and forecast 2025-2030 ($ million)
Chart on The Netherlands - Year-over-year growth 2025-2030 (%)
Data Table on The Netherlands - Year-over-year growth 2025-2030 (%)

12.5 APAC - Market size and forecast 2025-2030

Chart on APAC - Market size and forecast 2025-2030 ($ million)
Data Table on APAC - Market size and forecast 2025-2030 ($ million)
Chart on APAC - Year-over-year growth 2025-2030 (%)
Data Table on APAC - Year-over-year growth 2025-2030 (%)
Chart on Regional Comparison - APAC
Data Table on Regional Comparison - APAC

12.5.1 China - Market size and forecast 2025-2030

Chart on China - Market size and forecast 2025-2030 ($ million)
Data Table on China - Market size and forecast 2025-2030 ($ million)
Chart on China - Year-over-year growth 2025-2030 (%)
Data Table on China - Year-over-year growth 2025-2030 (%)

12.5.2 Japan - Market size and forecast 2025-2030

Chart on Japan - Market size and forecast 2025-2030 ($ million)
Data Table on Japan - Market size and forecast 2025-2030 ($ million)
Chart on Japan - Year-over-year growth 2025-2030 (%)
Data Table on Japan - Year-over-year growth 2025-2030 (%)

12.5.3 India - Market size and forecast 2025-2030

Chart on India - Market size and forecast 2025-2030 ($ million)
Data Table on India - Market size and forecast 2025-2030 ($ million)
Chart on India - Year-over-year growth 2025-2030 (%)
Data Table on India - Year-over-year growth 2025-2030 (%)

12.5.4 South Korea - Market size and forecast 2025-2030

Chart on South Korea - Market size and forecast 2025-2030 ($ million)
Data Table on South Korea - Market size and forecast 2025-2030 ($ million)
Chart on South Korea - Year-over-year growth 2025-2030 (%)
Data Table on South Korea - Year-over-year growth 2025-2030 (%)

12.5.5 Australia - Market size and forecast 2025-2030

Chart on Australia - Market size and forecast 2025-2030 ($ million)
Data Table on Australia - Market size and forecast 2025-2030 ($ million)
Chart on Australia - Year-over-year growth 2025-2030 (%)
Data Table on Australia - Year-over-year growth 2025-2030 (%)

12.5.6 Indonesia - Market size and forecast 2025-2030

Chart on Indonesia - Market size and forecast 2025-2030 ($ million)
Data Table on Indonesia - Market size and forecast 2025-2030 ($ million)
Chart on Indonesia - Year-over-year growth 2025-2030 (%)
Data Table on Indonesia - Year-over-year growth 2025-2030 (%)

12.6 South America - Market size and forecast 2025-2030

Chart on South America - Market size and forecast 2025-2030 ($ million)
Data Table on South America - Market size and forecast 2025-2030 ($ million)
Chart on South America - Year-over-year growth 2025-2030 (%)
Data Table on South America - Year-over-year growth 2025-2030 (%)
Chart on Regional Comparison - South America
Data Table on Regional Comparison - South America

12.6.1 Brazil - Market size and forecast 2025-2030

Chart on Brazil - Market size and forecast 2025-2030 ($ million)
Data Table on Brazil - Market size and forecast 2025-2030 ($ million)
Chart on Brazil - Year-over-year growth 2025-2030 (%)
Data Table on Brazil - Year-over-year growth 2025-2030 (%)

12.6.2 Argentina - Market size and forecast 2025-2030

Chart on Argentina - Market size and forecast 2025-2030 ($ million)
Data Table on Argentina - Market size and forecast 2025-2030 ($ million)
Chart on Argentina - Year-over-year growth 2025-2030 (%)
Data Table on Argentina - Year-over-year growth 2025-2030 (%)

12.6.3 Chile - Market size and forecast 2025-2030

Chart on Chile - Market size and forecast 2025-2030 ($ million)
Data Table on Chile - Market size and forecast 2025-2030 ($ million)
Chart on Chile - Year-over-year growth 2025-2030 (%)
Data Table on Chile - Year-over-year growth 2025-2030 (%)

12.7 Middle East and Africa - Market size and forecast 2025-2030

Chart on Middle East and Africa - Market size and forecast 2025-2030 ($ million)
Data Table on Middle East and Africa - Market size and forecast 2025-2030 ($ million)
Chart on Middle East and Africa - Year-over-year growth 2025-2030 (%)
Data Table on Middle East and Africa - Year-over-year growth 2025-2030 (%)
Chart on Regional Comparison - Middle East and Africa
Data Table on Regional Comparison - Middle East and Africa

12.7.1 Saudi Arabia - Market size and forecast 2025-2030

Chart on Saudi Arabia - Market size and forecast 2025-2030 ($ million)
Data Table on Saudi Arabia - Market size and forecast 2025-2030 ($ million)
Chart on Saudi Arabia - Year-over-year growth 2025-2030 (%)
Data Table on Saudi Arabia - Year-over-year growth 2025-2030 (%)

12.7.2 UAE - Market size and forecast 2025-2030

Chart on UAE - Market size and forecast 2025-2030 ($ million)
Data Table on UAE - Market size and forecast 2025-2030 ($ million)
Chart on UAE - Year-over-year growth 2025-2030 (%)
Data Table on UAE - Year-over-year growth 2025-2030 (%)

12.7.3 South Africa - Market size and forecast 2025-2030

Chart on South Africa - Market size and forecast 2025-2030 ($ million)
Data Table on South Africa - Market size and forecast 2025-2030 ($ million)
Chart on South Africa - Year-over-year growth 2025-2030 (%)
Data Table on South Africa - Year-over-year growth 2025-2030 (%)

12.7.4 Israel - Market size and forecast 2025-2030

Chart on Israel - Market size and forecast 2025-2030 ($ million)
Data Table on Israel - Market size and forecast 2025-2030 ($ million)
Chart on Israel - Year-over-year growth 2025-2030 (%)
Data Table on Israel - Year-over-year growth 2025-2030 (%)

12.7.5 Turkey - Market size and forecast 2025-2030

Chart on Turkey - Market size and forecast 2025-2030 ($ million)
Data Table on Turkey - Market size and forecast 2025-2030 ($ million)
Chart on Turkey - Year-over-year growth 2025-2030 (%)
Data Table on Turkey - Year-over-year growth 2025-2030 (%)

12.8 Market opportunity by geography

Market opportunity by geography ($ million)
Data Tables on Market opportunity by geography ($ million)

13. Drivers, Challenges, and Opportunity

13.1 Market drivers

Growing enterprise demand for centralized digital content management
Increasing adoption of omnichannel marketing and brand consistency strategies
Expanding deployment of AI-enabled asset discovery and workflow automation

13.2 Market challenges

Data privacy and cross-border content governance complexity
Metadata inconsistency across fragmented digital content repositories
Integration constraints with legacy enterprise technology environments

13.3 Impact of drivers and challenges

Impact of drivers and challenges in 2025 and 2030

13.4 Market opportunities

Accelerating shift toward cloud-native digital asset management platforms
Evolving adoption of composable content operations architectures
Growing incorporation of generative AI for content creation and asset enrichment

14. Competitive Landscape

14.1 Overview

14.2

Overview on criticality of inputs and factors of differentiation

14.3 Landscape disruption

Overview on factors of disruption

14.4 Industry risks

Impact of key risks on business

15. Competitive Analysis

15.1 Companies profiled

Companies covered

15.2 Company ranking index

15.3 Market positioning of companies

Matrix on companies position and classification

15.4 Acquia Inc.

Acquia Inc. - Overview
Acquia Inc. - Product / Service
Acquia Inc. - Key offerings
SWOT

15.5 Adobe Inc.

Adobe Inc. - Overview
Adobe Inc. - Business segments
Adobe Inc. - Key news
Adobe Inc. - Key offerings
Adobe Inc. - Segment focus
SWOT

15.6 Aprimo

Aprimo - Overview
Aprimo - Product / Service
Aprimo - Key offerings
SWOT

15.7 Censhare GmbH

Censhare GmbH - Overview
Censhare GmbH - Product / Service
Censhare GmbH - Key offerings
SWOT

15.8 Cloudinary Ltd.

Cloudinary Ltd. - Overview
Cloudinary Ltd. - Product / Service
Cloudinary Ltd. - Key offerings
SWOT

15.9 Daminion Software

Daminion Software - Overview
Daminion Software - Product / Service
Daminion Software - Key offerings
SWOT

15.10 Esko Graphics BV

Esko Graphics BV - Overview
Esko Graphics BV - Product / Service
Esko Graphics BV - Key offerings
SWOT

15.11 Frontify AG

Frontify AG - Overview
Frontify AG - Product / Service
Frontify AG - Key offerings
SWOT

15.12 Hyland Software Inc.

Hyland Software Inc. - Overview
Hyland Software Inc. - Product / Service
Hyland Software Inc. - Key offerings
SWOT

15.13 MediaValet Inc.

MediaValet Inc. - Overview
MediaValet Inc. - Product / Service
MediaValet Inc. - Key offerings
SWOT

15.14 Open Text Corp.

Open Text Corp. - Overview
Open Text Corp. - Business segments
Open Text Corp. - Key news
Open Text Corp. - Key offerings
Open Text Corp. - Segment focus
SWOT

15.15 Orange Logic LLC

Orange Logic LLC - Overview
Orange Logic LLC - Product / Service
Orange Logic LLC - Key offerings
SWOT

15.16 PhotoShelter Inc.

PhotoShelter Inc. - Overview
PhotoShelter Inc. - Product / Service
PhotoShelter Inc. - Key offerings
SWOT

15.17 Pimcore GmbH

Pimcore GmbH - Overview
Pimcore GmbH - Product / Service
Pimcore GmbH - Key offerings
SWOT

15.18 Sitecore Holding Ltd.

Sitecore Holding Ltd. - Overview
Sitecore Holding Ltd. - Product / Service
Sitecore Holding Ltd. - Key offerings
SWOT

16. Appendix

16.1 Scope of the report

Market definition
Objectives
Notes and caveats

16.2 Inclusions and exclusions checklist

Inclusions checklist
Exclusions checklist

16.3 Currency conversion rates for US$

16.4 Research methodology

16.5 Data procurement

Information sources

16.6 Data validation

16.7 Validation techniques employed for market sizing

16.8 Data synthesis

16.9 360 degree market analysis

16.10 List of abbreviations

Research Methodology

Technavio presents a detailed picture of the market by way of study, synthesis, and summation of data from multiple sources. The analysts have presented the various facets of the market with a particular focus on identifying the key industry influencers. The data thus presented is comprehensive, reliable, and the result of extensive research, both primary and secondary.

INFORMATION SOURCES

Primary sources

  • Manufacturers and suppliers
  • Channel partners
  • Industry experts
  • Strategic decision makers

Secondary sources

  • Industry journals and periodicals
  • Government data
  • Financial reports of key industry players
  • Historical data
  • Press releases

DATA ANALYSIS

Data Synthesis

  • Collation of data
  • Estimation of key figures
  • Analysis of derived insights

Data Validation

  • Triangulation with data models
  • Reference against proprietary databases
  • Corroboration with industry experts

REPORT WRITING

Qualitative

  • Market drivers
  • Market challenges
  • Market trends
  • Five forces analysis

Quantitative

  • Market size and forecast
  • Market segmentation
  • Geographical insights
  • Competitive landscape

Interested in this report?

Get your sample now to see our research methodology and insights!

Download Now

Frequently Asked Questions

Digital Asset Management market growth will increase by USD 24678.7 million during 2026-2030.

The Digital Asset Management market is expected to grow at a CAGR of 24.4% during 2026-2030.

Digital Asset Management market is segmented by Deployment (On-premises, Cloud) End-user (Large enterprise, Small and medium enterprise) Component (Solutions, Services)

Acquia Inc., Adobe Inc., Aprimo, Bynder B.V., Canto Inc., CELUM GmbH, Censhare GmbH, Cloudinary Ltd., Daminion Software, Esko Graphics BV, Frontify AG, Hyland Software Inc., MediaValet Inc., Open Text Corp., Orange Logic LLC, Papirfly Group, PhotoShelter Inc., Pimcore GmbH, Sitecore Holding Ltd. are a few of the key vendors in the Digital Asset Management market.

APAC will register the highest growth rate of 32.3% among the other regions. Therefore, the Digital Asset Management market in APAC is expected to garner significant business opportunities for the vendors during the forecast period.

US, Canada, Mexico, Germany, UK, France, Italy, Spain, The Netherlands, China, Japan, India, South Korea, Australia, Indonesia, Brazil, Argentina, Chile, Saudi Arabia, UAE, South Africa, Israel, Turkey

  • Growing enterprise demand for centralized digital content management is the driving factor this market.

The Digital Asset Management market vendors should focus on grabbing business opportunities from the Deployment segment as it accounted for the largest market share in the base year.
RIA - Research AI Assistant
Ask RIA
