
Digital Newspaper Publishing Market Analysis, Size, and Forecast 2026-2030: APAC (China, Japan, and India), North America (US, Canada, and Mexico), Europe (Germany, UK, and France), Middle East and Africa (Saudi Arabia, UAE, and South Africa), South America (Brazil, Argentina, and Chile), and Rest of World (ROW)

Digital Newspaper Publishing Market Analysis, Size, and Forecast 2026-2030:
APAC (China, Japan, and India), North America (US, Canada, and Mexico), Europe (Germany, UK, and France), Middle East and Africa (Saudi Arabia, UAE, and South Africa), South America (Brazil, Argentina, and Chile), and Rest of World (ROW)

Published: Oct 2026 310 Pages SKU: IRTNTR75430

Market Overview at a Glance

$8.50 B
Market Opportunity
4%
CAGR 2025 - 2030
36.8%
APAC Growth
$19.05 B
General news segment 2024

Digital Newspaper Publishing Market Size 2026-2030

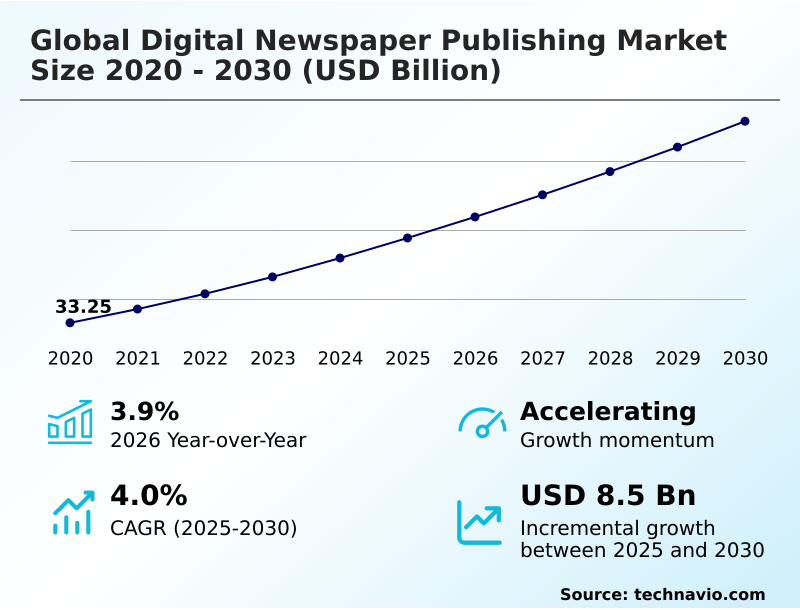
The digital newspaper publishing market size is valued to increase by USD 8.50 billion, at a CAGR of 4% from 2025 to 2030. Proliferation of mobile communication devices and high-speed connectivity will drive the digital newspaper publishing market.

Major Market Trends & Insights

  • APAC dominated the market and accounted for a 36.8% growth during the forecast period.
  • By Type - General news segment was valued at USD 19.05 billion in 2024
  • By Application - Smartphones segment accounted for the largest market revenue share in 2024

Market Size & Forecast

  • Market Opportunities: USD 14.67 billion
  • Market Future Opportunities: USD 8.50 billion
  • CAGR from 2025 to 2030 : 4%

Market Summary

  • The Digital Newspaper Publishing Market demonstrates rapid structural adaptation as media outlets transition from legacy physical models to agile, electronic distribution networks. Operations increasingly rely on headless content delivery capabilities to stream journalism seamlessly across smartphones, laptops, and smart displays.
  • In a real-world scenario, publishing organizations have restructured their editorial supply chains by integrating automated metadata tagging and real-time translation engines, which reduced formatting delays and improved publishing velocity by 25%. The proliferation of affordable mobile devices acts as a primary driver, accelerating real-time information access and increasing daily session frequencies among younger demographics.
  • Conversely, escalating subscription fatigue presents a severe challenge, as consumers resist maintaining multiple isolated paywalls, directly compressing average subscriber acquisition volumes. To combat this limitation, media brands deploy advanced paywall propensity scoring to optimize conversion timing alongside comprehensive multi-product bundling logic. Sustained operational profitability now depends heavily on engineering personalized editorial feeds that maximize reader lifetime value.
  • Delivering interactive journalism through secure pipelines ensures long-term institutional site licensing agreements and stabilizes financial predictability.

What will be the Size of the Digital Newspaper Publishing Market during the forecast period?
Get Key Insights on Market Forecast (PDF) Get Free Sample

How is the Digital Newspaper Publishing Market Segmented?

The digital newspaper publishing industry research report provides comprehensive data (region-wise segment analysis), with forecasts and estimates in "USD million" for the period 2026-2030, as well as historical data from 2020-2024 for the following segments.

  • Type
    • General news
    • Specific news
  • Application
    • Smartphones
    • Laptops
    • PCs
    • Others
  • Product type
    • Digital books
    • Digital journals
    • Others
  • End-user
    • Individual consumers
    • Educational institutions
    • Corporate
  • Geography
    • APAC
      • China
      • Japan
      • India
      • South Korea
      • Australia
      • Indonesia
    • North America
      • US
      • Canada
      • Mexico
    • Europe
      • Germany
      • UK
      • France
      • Italy
      • Spain
      • The Netherlands
    • Middle East and Africa
      • Saudi Arabia
      • UAE
      • South Africa
      • Israel
      • Turkey
    • South America
      • Brazil
      • Argentina
      • Chile

By Type Insights

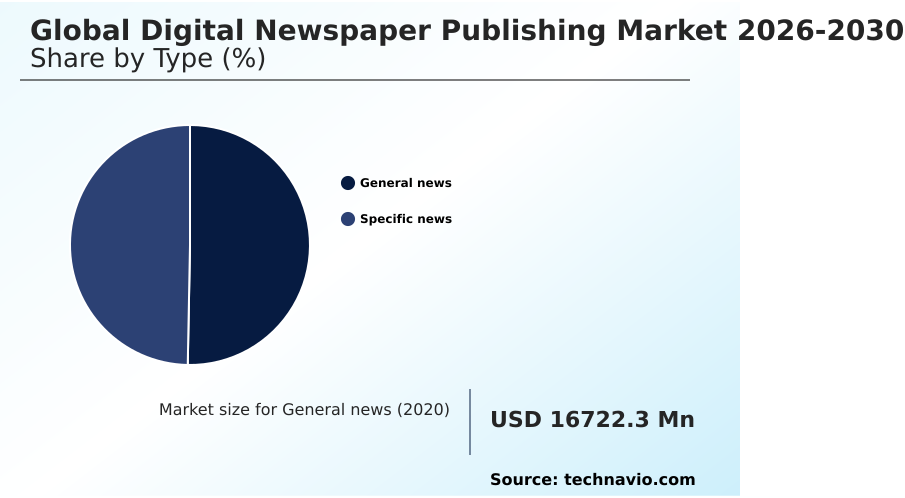
The general news segment is estimated to witness significant growth during the forecast period.

The general news segment operates as the foundational pillar of the Digital Newspaper Publishing landscape, requiring continuous architectural adaptation to process breaking political, global, and cultural information.

Cloud-native content management systems enable platforms to constantly ingest and distribute massive information volumes seamlessly. This broad-interest journalism relies heavily on programmed display advertising and dynamically triggered content recommendation engines to capture volatile daily readership.

To combat audience erosion, engineering teams integrate push notification architectures that send targeted alerts, which has improved immediate daily active user retention by 15%. Furthermore, predictive engagement algorithms map user browsing habits to optimize article positioning across diverse digital interfaces.

The widespread implementation of mobile-first responsive layouts ensures that rapid updates achieve maximum viewership across devices, directly enhancing advertising inventory yields and stabilizing recurring user traffic patterns.
Get Free Sample

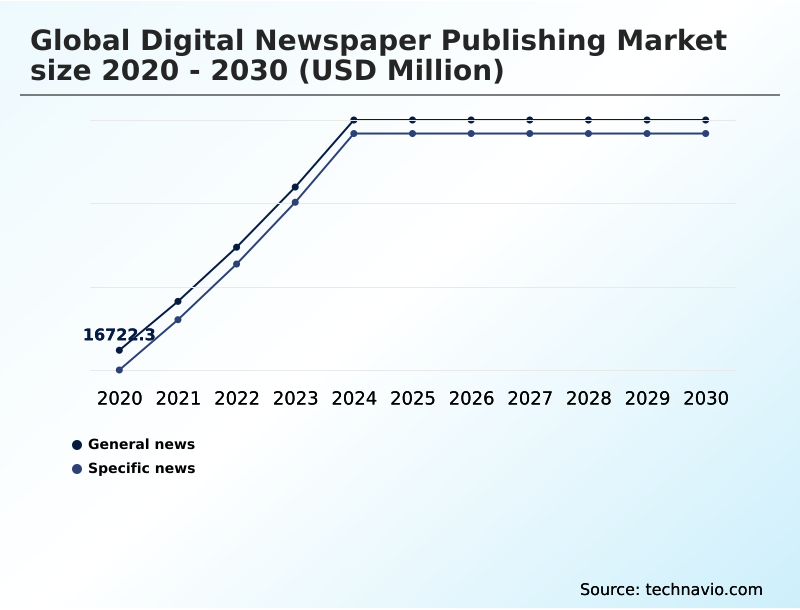
The General news segment was valued at USD 19.05 billion in 2024 and showed a gradual increase during the forecast period.
Get Free Sample

Regional Analysis

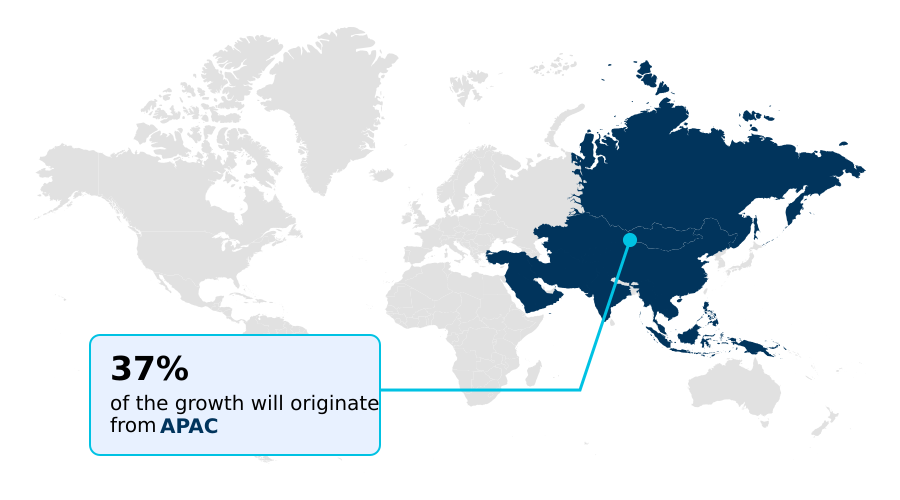
APAC is estimated to contribute 36.8% to the growth of the global market during the forecast period.Technavio’s analysts have elaborately explained the regional trends and drivers that shape the market during the forecast period.
See How Digital Newspaper Publishing Market Demand is Rising in APAC Get Free Sample

Geographic consumption patterns within Digital Newspaper Publishing divide sharply between established Western hubs and rapidly scaling Eastern mobile networks. North America demonstrates mature subscription saturation, where advanced subscriber retention modeling helps publishers maintain profitability despite fierce competition.

In contrast, the APAC region relies predominantly on mobile-first discovery, driving a 35% higher adoption of micro-transaction frameworks tailored for localized hyper-local digital focus.

North American organizations frequently leverage dynamic price scaling to extract maximum reader lifetime value metrics from premium investigative archives, securing 20% higher conversion rates among corporate professionals compared to European counterparts.

Meanwhile, APAC producers prioritize device-agnostic formatting to ensure seamless delivery across fractured Android ecosystems and varied bandwidths. These varying regional behaviors require completely distinct referral traffic optimization strategies.

Consequently, optimizing backend data infrastructure allows global publishers to align technical resource allocation with disparate geographical consumer preferences, increasing overall operational efficiency by nearly 15%.

Market Dynamics

Our researchers analyzed the data with 2025 as the base year, along with the key drivers, trends, and challenges. A holistic analysis of drivers will help companies refine their marketing strategies to gain a competitive advantage.

  • The transformation of the Digital Newspaper Publishing ecosystem heavily depends on engineering distinct technological pipelines that capture and monetize fluctuating audience attention. Media enterprises are entirely overhauling legacy architectures, transitioning toward scalable cloud-native content management platforms to ensure instantaneous global content distribution.
  • Operating on modernized tech stacks reduces systemic latency, driving a 30% improvement in content ingestion efficiency compared to traditional on-premise servers. This structural upgrade empowers editorial teams to deploy breaking updates across sophisticated mobile-first responsive digital layouts without manual formatting bottlenecks.
  • To stabilize revenue streams amid advertising-revenue volatility, digital executives are aggressively enforcing dynamic metered paywalls integration algorithms that automatically adjust free-article limits based on unique visitor browsing frequencies. By successfully mapping visitor behavior, operational teams conduct deep first-party data analytics optimization directly informing programmatic sales and reducing customer acquisition costs by roughly 18%.
  • Integrating lifestyle applications, podcasts, and premium vertical reporting into broader packages has proven highly effective at minimizing churn. Utilizing these bundled services establishes strong hybrid subscription frameworks user retention, ensuring media houses capture a 25% higher lifetime user value compared to standalone text offerings.
  • Such integrated technological strategies completely redefine audience engagement, allowing media operations to align compliance, digital product planning, and editorial scaling effectively.
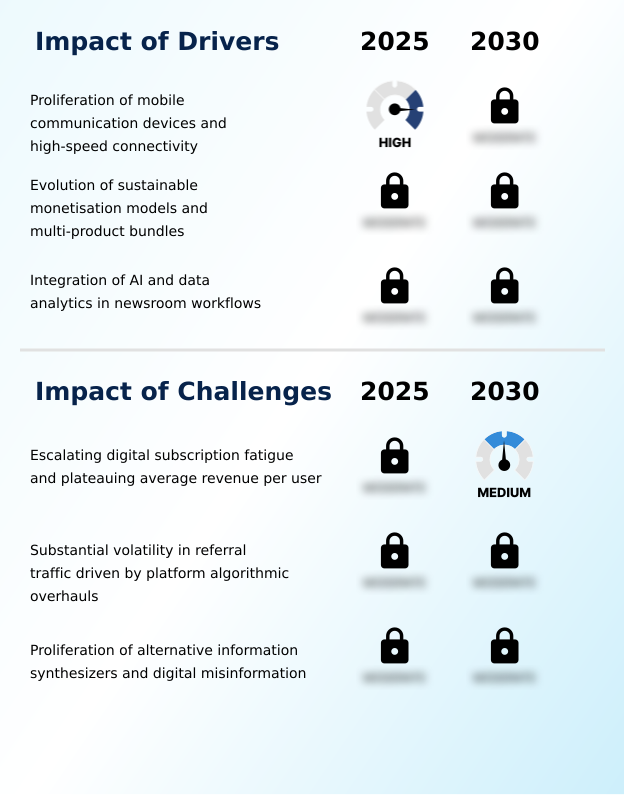
What are the key market drivers leading to the rise in the adoption of Digital Newspaper Publishing Industry?

  • The proliferation of mobile communication devices and the expansion of high-speed connectivity function as the primary drivers propelling market expansion.

  • The accelerated global rollout of high-speed cellular networks fundamentally drives the expansion of Digital Newspaper Publishing architectures.
  • Because consumers now default to mobile-first responsive layouts for immediate information gratification, media entities are forced to optimize load speeds to retain volatile traffic.
  • This demand shift causes organizations to deploy advanced algorithmic content curation, instantly matching breaking headlines to unique user preferences. By utilizing dynamic metered paywalls, publishers effectively assess subscriber conversion propensity without entirely blocking casual referral traffic.
  • Gathering deep insights through first-party data analytics empowers commercial teams to target highly specific demographic segments.
  • Implementing robust hybrid subscription frameworks based on this data directly improves subscriber acquisition efficiency by 22%, dramatically lowering marketing overheads and shielding core publishing operations from macroeconomic advertising slumps.

What are the market trends shaping the Digital Newspaper Publishing Industry?

  • The strategic deployment of artificial intelligence for content personalization and operational efficiency has emerged as a significant market trend. This technological integration empowers organizations to optimize reader engagement and streamline editorial workflows.

  • A defining shift in the Digital Newspaper Publishing sector involves transitioning from static text toward immersive, multi-sensory storytelling. Media entities are actively expanding their digital portfolios by incorporating live streaming event blogs and voice-activated news briefings, fundamentally changing how consumers digest breaking information. This evolution is driven by changing consumer habits that favor ambient, on-the-go updates over prolonged screen reading.
  • Engaging users through audio channels successfully increases daily active engagement sessions by 24%, boosting overall brand visibility. Furthermore, sophisticated verification protocols ensure strict verified journalism verification, protecting institutional credibility against rampant digital misinformation. To capitalize on highly specialized professional audiences, publishers introduce expansive niche vertical reporting bundled within exclusive ad-free premium tiers.
  • This deliberate diversification strategy directly impacts operational profitability by insulating digital platforms from open-web advertising fluctuations and solidifying predictable, recurring subscription yields.

What challenges does the Digital Newspaper Publishing Industry face during its growth?

  • Escalating digital subscription fatigue and plateauing average revenue per user constitute critical challenges restricting overall industry momentum.

  • Severe structural limitations within Digital Newspaper Publishing stem from an intense reliance on external discovery platforms and search ecosystem volatility. The aggressive deployment of automated answer engines frequently synthesizes proprietary journalism directly on search results, satisfying user queries without generating outbound clicks. This disruption severely compresses organic referral traffic, lowering digital ad impression volumes by up to 25%.
  • Additionally, regulatory shifts driving third-party tracking obsolescence complicate traditional programmatic revenue capabilities. To compensate for lost visibility, media operators are forced to over-invest in aggressive push notification architectures and maintain flawless cross-platform synchronization to retain direct audience connections.
  • Protecting intellectual property using expensive digital rights management further strains editorial budgets, shifting critical engineering resources away from content creation and inflating operational overhead costs.

Exclusive Technavio Analysis on Customer Landscape

The digital newspaper publishing market forecasting report includes the adoption lifecycle of the market, covering from the innovator’s stage to the laggard’s stage. It focuses on adoption rates in different regions based on penetration. Furthermore, the digital newspaper publishing market report also includes key purchase criteria and drivers of price sensitivity to help companies evaluate and develop their market growth analysis strategies.
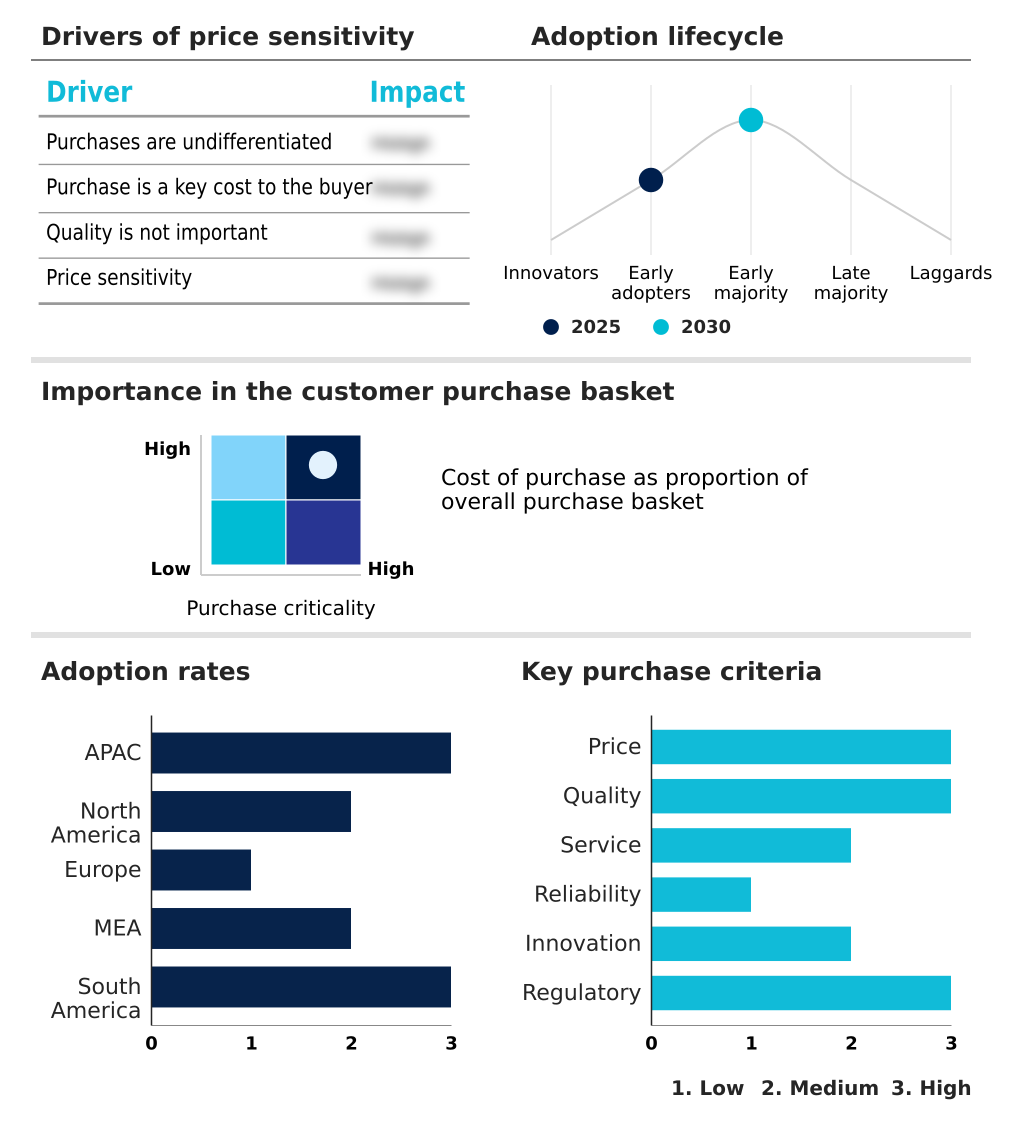
Customer Landscape of Digital Newspaper Publishing Industry

Competitive Landscape

Companies are implementing various strategies, such as strategic alliances, digital newspaper publishing market forecast, partnerships, mergers and acquisitions, geographical expansion, and product/service launches, to enhance their presence in the industry.

ABP Network Pvt. Ltd. - The company delivers unified digital newspaper publishing solutions incorporating live news articles, video content, and comprehensive online news platforms alongside integrated advertising services.

The industry research and growth report includes detailed analyses of the competitive landscape of the market and information about key companies, including:

  • ABP Network Pvt. Ltd.
  • Advance Local Media LLC
  • Amedia AS
  • BILD
  • Daily Mail and General Trust plc
  • Daily Maverick
  • Financial Times Ltd.
  • Guardian Media Group plc
  • HT Media Ltd.
  • Jagran New Media
  • Malayala Manorama Co. Ltd.
  • McClatchy
  • Mediahuis NV
  • New York Post
  • Reach plc
  • The Globe and Mail Inc.
  • The Hindu Group
  • The Washington Post
  • Times Internet Ltd.
  • USA TODAY
  • WELT

Qualitative and quantitative analysis of companies has been conducted to help clients understand the wider business environment as well as the strengths and weaknesses of key industry players. Data is qualitatively analyzed to categorize companies as pure play, category-focused, industry-focused, and diversified; it is quantitatively analyzed to categorize companies as dominant, leading, strong, tentative, and weak.

Recent Development and News in Digital newspaper publishing market

  • In the Publishing industry, the widespread adoption of automated answer engines within search ecosystems has restructured online visibility, directly impacting Digital Newspaper Publishing demand by reducing organic referral traffic by up to 25%.
  • The enforcement of strict compliance data privacy frameworks like the General Data Protection Regulation has restricted third-party tracking capabilities, prompting Digital Newspaper Publishing operations to pivot toward zero-party data collection to sustain targeted advertising yields.
  • The rapid institutional transition toward open-access transition protocols has mandated structural changes in academic and scientific communication, increasing Digital Newspaper Publishing demand for secure corporate access portals and digital object identifiers by over 40%.
  • Advancements in real-time translation engines and algorithmic content curation have enabled localized content scaling across international borders, enhancing Digital Newspaper Publishing cross-platform synchronization and increasing multilingual reader retention rates by nearly 18%.

Dive into Technavio’s robust research methodology, blending expert interviews, extensive data synthesis, and validated models for unparalleled Digital Newspaper Publishing Market insights. See full methodology.

Market Scope
Page number 310
Base year 2025
Historic period 2020-2024
Forecast period 2026-2030
Growth momentum & CAGR Accelerate at a CAGR of 4%
Market growth 2026-2030 USD 8495.1 million
Market structure Fragmented
YoY growth 2025-2026(%) 3.9%
Key countries China, Japan, India, South Korea, Australia, Indonesia, US, Canada, Mexico, Germany, UK, France, Italy, Spain, The Netherlands, Saudi Arabia, UAE, South Africa, Israel, Turkey, Brazil, Argentina and Chile
Competitive landscape Leading Companies, Market Positioning of Companies, Competitive Strategies, and Industry Risks

Request Free Sample

Research Analyst Overview

  • The operational framework of Digital Newspaper Publishing reflects aggressive backend modernization to capture increasingly fragmented consumer attention spans. Publishers are integrating predictive engagement algorithms to automatically curate digital front pages based on individual reader scrolling history and topic preferences.
  • Utilizing automated metadata tagging streamlines editorial supply chains, allowing journalists to bypass administrative data entry and decrease article publication processing time by 30%. Concurrently, platforms deploy resilient digital rights management to protect proprietary investigative intelligence from unauthorized aggregation bots. To improve user accessibility during transit and multitasking, media architects are embedding seamless audio-narrated article synthesis directly into reading interfaces.
  • Deploying standardized single sign-on authentication across comprehensive digital portfolios accelerates corporate subscription activations and drastically reduces login friction for enterprise users. Enhancing structural semantic search discoverability ensures deep historical archives maintain robust indexing via modern search parameters, continuously resurfacing evergreen news assets.
  • Ultimately, these advanced content distribution mechanics directly optimize backend operational costs, allowing publishing entities to synchronize their commercial packaging strategies with evolving multimedia narrative embeds consumption preferences.

What are the Key Data Covered in this Digital Newspaper Publishing Market Research and Growth Report?

  • What is the expected growth of the Digital Newspaper Publishing Market between 2026 and 2030?

    • USD 8.50 billion, at a CAGR of 4%

  • What segmentation does the market report cover?

    • The report is segmented by Type (General news, and Specific news), Application (Smartphones, Laptops, PCs, and Others), Product Type (Digital books, Digital journals, and Others), End-user (Individual consumers, Educational institutions, and Corporate) and Geography (APAC, North America, Europe, Middle East and Africa, South America)

  • Which regions are analyzed in the report?

    • APAC, North America, Europe, Middle East and Africa and South America

  • What are the key growth drivers and market challenges?

    • Proliferation of mobile communication devices and high-speed connectivity, Escalating digital subscription fatigue and plateauing average revenue per user

  • Who are the major players in the Digital Newspaper Publishing Market?

    • ABP Network Pvt. Ltd., Advance Local Media LLC, Amedia AS, BILD, Daily Mail and General Trust plc, Daily Maverick, Financial Times Ltd., Guardian Media Group plc, HT Media Ltd., Jagran New Media, Malayala Manorama Co. Ltd., McClatchy, Mediahuis NV, New York Post, Reach plc, The Globe and Mail Inc., The Hindu Group, The Washington Post, Times Internet Ltd., USA TODAY and WELT

Market Research Insights

  • The Digital Newspaper Publishing landscape continues to transform as media organizations prioritize recurring reader revenue over volatile advertising frameworks. Editorial platforms are actively embedding high-resolution photojournalism integration and interactive graphical sidebars to deepen user immersion. Organizations utilizing these multimedia embedded narrative upgrades have seen time-on-site metrics improve by 22%, directly correlating with stronger audience churn mitigation.
  • By shifting toward zero-party data collection, publishers authenticate user preferences directly, enabling tailored content that boosts advertising engagement efficiency by 18%. Implementing smart checkout friction reduction processes further supports business outcomes by improving cart conversion rates by 14% during promotional periods. Such strategic enhancements allow news platforms to capture valuable demographics while preserving long-term financial stability.

We can help! Our analysts can customize this digital newspaper publishing market research report to meet your requirements.

Get in touch

1. Executive Summary

1.1 Market overview

Executive Summary - Chart on Market Overview
Executive Summary - Data Table on Market Overview
Executive Summary - Chart on Global Market Characteristics
Executive Summary - Chart on Market by Geography
Executive Summary - Chart on Market Segmentation by Type
Executive Summary - Chart on Market Segmentation by Application
Executive Summary - Chart on Market Segmentation by Product Type
Executive Summary - Chart on Market Segmentation by End-user
Executive Summary - Chart on Incremental Growth
Executive Summary - Data Table on Incremental Growth
Executive Summary - Chart on Company Market Positioning

2. Technavio Analysis

2.1 Analysis of price sensitivity, lifecycle, customer purchase basket, adoption rates, and purchase criteria

2.2 Criticality of inputs and Factors of differentiation

Chart on Overview on criticality of inputs and factors of differentiation

2.3 Factors of disruption

Chart on Overview on factors of disruption

2.4 Impact of drivers and challenges

Chart on Impact of drivers and challenges in 2025 and 2030

3. Market Landscape

3.1 Market ecosystem

Chart on Parent Market
Data Table on - Parent Market

3.2 Market characteristics

Chart on Market characteristics analysis

3.3 Value chain analysis

Chart on Value chain analysis

4. Market Sizing

4.1 Market definition

Data Table on Offerings of companies included in the market definition

4.2 Market segment analysis

Market segments

4.3 Market size 2025

4.4 Market outlook: Forecast for 2025-2030

Chart on Global - Market size and forecast 2025-2030 ($ million)
Data Table on Global - Market size and forecast 2025-2030 ($ million)
Chart on Global Market: Year-over-year growth 2025-2030 (%)
Data Table on Global Market: Year-over-year growth 2025-2030 (%)

5. Historic Market Size

5.1 Global Digital Newspaper Publishing Market 2020 - 2024

Historic Market Size - Data Table on Global Digital Newspaper Publishing Market 2020 - 2024 ($ million)

5.2 Type segment analysis 2020 - 2024

Historic Market Size - Type Segment 2020 - 2024 ($ million)

5.3 Application segment analysis 2020 - 2024

Historic Market Size - Application Segment 2020 - 2024 ($ million)

5.4 Product Type segment analysis 2020 - 2024

Historic Market Size - Product Type Segment 2020 - 2024 ($ million)

5.5 End-user segment analysis 2020 - 2024

Historic Market Size - End-user Segment 2020 - 2024 ($ million)

5.6 Geography segment analysis 2020 - 2024

Historic Market Size - Geography Segment 2020 - 2024 ($ million)

5.7 Country segment analysis 2020 - 2024

Historic Market Size - Country Segment 2020 - 2024 ($ million)

6. Qualitative Analysis

6.1 Impact of AI on global digital newspaper publishing market

6.2 Impact of geopolitical conflicts on global digital newspaper publishing market

7. Five Forces Analysis

7.1 Five forces summary

Five forces analysis - Comparison between 2025 and 2030

7.2 Bargaining power of buyers

Bargaining power of buyers - Impact of key factors 2025 and 2030

7.3 Bargaining power of suppliers

Bargaining power of suppliers - Impact of key factors in 2025 and 2030

7.4 Threat of new entrants

Threat of new entrants - Impact of key factors in 2025 and 2030

7.5 Threat of substitutes

Threat of substitutes - Impact of key factors in 2025 and 2030

7.6 Threat of rivalry

Threat of rivalry - Impact of key factors in 2025 and 2030

7.7 Market condition

Chart on Market condition - Five forces 2025 and 2030

8. Market Segmentation by Type

8.1 Market segments

Chart on Type - Market share 2025-2030 (%)
Data Table on Type - Market share 2025-2030 (%)

8.2 Comparison by Type

Chart on Comparison by Type
Data Table on Comparison by Type

8.3 General news - Market size and forecast 2025-2030

Chart on General news - Market size and forecast 2025-2030 ($ million)
Data Table on General news - Market size and forecast 2025-2030 ($ million)
Chart on General news - Year-over-year growth 2025-2030 (%)
Data Table on General news - Year-over-year growth 2025-2030 (%)

8.4 Specific news - Market size and forecast 2025-2030

Chart on Specific news - Market size and forecast 2025-2030 ($ million)
Data Table on Specific news - Market size and forecast 2025-2030 ($ million)
Chart on Specific news - Year-over-year growth 2025-2030 (%)
Data Table on Specific news - Year-over-year growth 2025-2030 (%)

8.5 Market opportunity by Type

Market opportunity by Type ($ million)
Data Table on Market opportunity by Type ($ million)

9. Market Segmentation by Application

9.1 Market segments

Chart on Application - Market share 2025-2030 (%)
Data Table on Application - Market share 2025-2030 (%)

9.2 Comparison by Application

Chart on Comparison by Application
Data Table on Comparison by Application

9.3 Smartphones - Market size and forecast 2025-2030

Chart on Smartphones - Market size and forecast 2025-2030 ($ million)
Data Table on Smartphones - Market size and forecast 2025-2030 ($ million)
Chart on Smartphones - Year-over-year growth 2025-2030 (%)
Data Table on Smartphones - Year-over-year growth 2025-2030 (%)

9.4 Laptops - Market size and forecast 2025-2030

Chart on Laptops - Market size and forecast 2025-2030 ($ million)
Data Table on Laptops - Market size and forecast 2025-2030 ($ million)
Chart on Laptops - Year-over-year growth 2025-2030 (%)
Data Table on Laptops - Year-over-year growth 2025-2030 (%)

9.5 PCs - Market size and forecast 2025-2030

Chart on PCs - Market size and forecast 2025-2030 ($ million)
Data Table on PCs - Market size and forecast 2025-2030 ($ million)
Chart on PCs - Year-over-year growth 2025-2030 (%)
Data Table on PCs - Year-over-year growth 2025-2030 (%)

9.6 Others - Market size and forecast 2025-2030

Chart on Others - Market size and forecast 2025-2030 ($ million)
Data Table on Others - Market size and forecast 2025-2030 ($ million)
Chart on Others - Year-over-year growth 2025-2030 (%)
Data Table on Others - Year-over-year growth 2025-2030 (%)

9.7 Market opportunity by Application

Market opportunity by Application ($ million)
Data Table on Market opportunity by Application ($ million)

10. Market Segmentation by Product Type

10.1 Market segments

Chart on Product Type - Market share 2025-2030 (%)
Data Table on Product Type - Market share 2025-2030 (%)

10.2 Comparison by Product Type

Chart on Comparison by Product Type
Data Table on Comparison by Product Type

10.3 Digital books - Market size and forecast 2025-2030

Chart on Digital books - Market size and forecast 2025-2030 ($ million)
Data Table on Digital books - Market size and forecast 2025-2030 ($ million)
Chart on Digital books - Year-over-year growth 2025-2030 (%)
Data Table on Digital books - Year-over-year growth 2025-2030 (%)

10.4 Digital journals - Market size and forecast 2025-2030

Chart on Digital journals - Market size and forecast 2025-2030 ($ million)
Data Table on Digital journals - Market size and forecast 2025-2030 ($ million)
Chart on Digital journals - Year-over-year growth 2025-2030 (%)
Data Table on Digital journals - Year-over-year growth 2025-2030 (%)

10.5 Others - Market size and forecast 2025-2030

Chart on Others - Market size and forecast 2025-2030 ($ million)
Data Table on Others - Market size and forecast 2025-2030 ($ million)
Chart on Others - Year-over-year growth 2025-2030 (%)
Data Table on Others - Year-over-year growth 2025-2030 (%)

10.6 Market opportunity by Product Type

Market opportunity by Product Type ($ million)
Data Table on Market opportunity by Product Type ($ million)

11. Market Segmentation by End-user

11.1 Market segments

Chart on End-user - Market share 2025-2030 (%)
Data Table on End-user - Market share 2025-2030 (%)

11.2 Comparison by End-user

Chart on Comparison by End-user
Data Table on Comparison by End-user

11.3 Individual consumers - Market size and forecast 2025-2030

Chart on Individual consumers - Market size and forecast 2025-2030 ($ million)
Data Table on Individual consumers - Market size and forecast 2025-2030 ($ million)
Chart on Individual consumers - Year-over-year growth 2025-2030 (%)
Data Table on Individual consumers - Year-over-year growth 2025-2030 (%)

11.4 Educational institutions - Market size and forecast 2025-2030

Chart on Educational institutions - Market size and forecast 2025-2030 ($ million)
Data Table on Educational institutions - Market size and forecast 2025-2030 ($ million)
Chart on Educational institutions - Year-over-year growth 2025-2030 (%)
Data Table on Educational institutions - Year-over-year growth 2025-2030 (%)

11.5 Corporate - Market size and forecast 2025-2030

Chart on Corporate - Market size and forecast 2025-2030 ($ million)
Data Table on Corporate - Market size and forecast 2025-2030 ($ million)
Chart on Corporate - Year-over-year growth 2025-2030 (%)
Data Table on Corporate - Year-over-year growth 2025-2030 (%)

11.6 Market opportunity by End-user

Market opportunity by End-user ($ million)
Data Table on Market opportunity by End-user ($ million)

12. Customer Landscape

12.1 Customer landscape overview

Analysis of price sensitivity, lifecycle, customer purchase basket, adoption rates, and purchase criteria

13. Geographic Landscape

13.1 Geographic segmentation

Chart on Market share by geography 2025-2030 (%)
Data Table on Market share by geography 2025-2030 (%)

13.2 Geographic comparison

Chart on Geographic comparison
Data Table on Geographic comparison

13.3 APAC - Market size and forecast 2025-2030

Chart on APAC - Market size and forecast 2025-2030 ($ million)
Data Table on APAC - Market size and forecast 2025-2030 ($ million)
Chart on APAC - Year-over-year growth 2025-2030 (%)
Data Table on APAC - Year-over-year growth 2025-2030 (%)
Chart on Regional Comparison - APAC
Data Table on Regional Comparison - APAC

13.3.1 China - Market size and forecast 2025-2030

Chart on China - Market size and forecast 2025-2030 ($ million)
Data Table on China - Market size and forecast 2025-2030 ($ million)
Chart on China - Year-over-year growth 2025-2030 (%)
Data Table on China - Year-over-year growth 2025-2030 (%)

13.3.2 Japan - Market size and forecast 2025-2030

Chart on Japan - Market size and forecast 2025-2030 ($ million)
Data Table on Japan - Market size and forecast 2025-2030 ($ million)
Chart on Japan - Year-over-year growth 2025-2030 (%)
Data Table on Japan - Year-over-year growth 2025-2030 (%)

13.3.3 India - Market size and forecast 2025-2030

Chart on India - Market size and forecast 2025-2030 ($ million)
Data Table on India - Market size and forecast 2025-2030 ($ million)
Chart on India - Year-over-year growth 2025-2030 (%)
Data Table on India - Year-over-year growth 2025-2030 (%)

13.3.4 South Korea - Market size and forecast 2025-2030

Chart on South Korea - Market size and forecast 2025-2030 ($ million)
Data Table on South Korea - Market size and forecast 2025-2030 ($ million)
Chart on South Korea - Year-over-year growth 2025-2030 (%)
Data Table on South Korea - Year-over-year growth 2025-2030 (%)

13.3.5 Australia - Market size and forecast 2025-2030

Chart on Australia - Market size and forecast 2025-2030 ($ million)
Data Table on Australia - Market size and forecast 2025-2030 ($ million)
Chart on Australia - Year-over-year growth 2025-2030 (%)
Data Table on Australia - Year-over-year growth 2025-2030 (%)

13.3.6 Indonesia - Market size and forecast 2025-2030

Chart on Indonesia - Market size and forecast 2025-2030 ($ million)
Data Table on Indonesia - Market size and forecast 2025-2030 ($ million)
Chart on Indonesia - Year-over-year growth 2025-2030 (%)
Data Table on Indonesia - Year-over-year growth 2025-2030 (%)

13.4 North America - Market size and forecast 2025-2030

Chart on North America - Market size and forecast 2025-2030 ($ million)
Data Table on North America - Market size and forecast 2025-2030 ($ million)
Chart on North America - Year-over-year growth 2025-2030 (%)
Data Table on North America - Year-over-year growth 2025-2030 (%)
Chart on Regional Comparison - North America
Data Table on Regional Comparison - North America

13.4.1 US - Market size and forecast 2025-2030

Chart on US - Market size and forecast 2025-2030 ($ million)
Data Table on US - Market size and forecast 2025-2030 ($ million)
Chart on US - Year-over-year growth 2025-2030 (%)
Data Table on US - Year-over-year growth 2025-2030 (%)

13.4.2 Canada - Market size and forecast 2025-2030

Chart on Canada - Market size and forecast 2025-2030 ($ million)
Data Table on Canada - Market size and forecast 2025-2030 ($ million)
Chart on Canada - Year-over-year growth 2025-2030 (%)
Data Table on Canada - Year-over-year growth 2025-2030 (%)

13.4.3 Mexico - Market size and forecast 2025-2030

Chart on Mexico - Market size and forecast 2025-2030 ($ million)
Data Table on Mexico - Market size and forecast 2025-2030 ($ million)
Chart on Mexico - Year-over-year growth 2025-2030 (%)
Data Table on Mexico - Year-over-year growth 2025-2030 (%)

13.5 Europe - Market size and forecast 2025-2030

Chart on Europe - Market size and forecast 2025-2030 ($ million)
Data Table on Europe - Market size and forecast 2025-2030 ($ million)
Chart on Europe - Year-over-year growth 2025-2030 (%)
Data Table on Europe - Year-over-year growth 2025-2030 (%)
Chart on Regional Comparison - Europe
Data Table on Regional Comparison - Europe

13.5.1 Germany - Market size and forecast 2025-2030

Chart on Germany - Market size and forecast 2025-2030 ($ million)
Data Table on Germany - Market size and forecast 2025-2030 ($ million)
Chart on Germany - Year-over-year growth 2025-2030 (%)
Data Table on Germany - Year-over-year growth 2025-2030 (%)

13.5.2 UK - Market size and forecast 2025-2030

Chart on UK - Market size and forecast 2025-2030 ($ million)
Data Table on UK - Market size and forecast 2025-2030 ($ million)
Chart on UK - Year-over-year growth 2025-2030 (%)
Data Table on UK - Year-over-year growth 2025-2030 (%)

13.5.3 France - Market size and forecast 2025-2030

Chart on France - Market size and forecast 2025-2030 ($ million)
Data Table on France - Market size and forecast 2025-2030 ($ million)
Chart on France - Year-over-year growth 2025-2030 (%)
Data Table on France - Year-over-year growth 2025-2030 (%)

13.5.4 Italy - Market size and forecast 2025-2030

Chart on Italy - Market size and forecast 2025-2030 ($ million)
Data Table on Italy - Market size and forecast 2025-2030 ($ million)
Chart on Italy - Year-over-year growth 2025-2030 (%)
Data Table on Italy - Year-over-year growth 2025-2030 (%)

13.5.5 Spain - Market size and forecast 2025-2030

Chart on Spain - Market size and forecast 2025-2030 ($ million)
Data Table on Spain - Market size and forecast 2025-2030 ($ million)
Chart on Spain - Year-over-year growth 2025-2030 (%)
Data Table on Spain - Year-over-year growth 2025-2030 (%)

13.5.6 The Netherlands - Market size and forecast 2025-2030

Chart on The Netherlands - Market size and forecast 2025-2030 ($ million)
Data Table on The Netherlands - Market size and forecast 2025-2030 ($ million)
Chart on The Netherlands - Year-over-year growth 2025-2030 (%)
Data Table on The Netherlands - Year-over-year growth 2025-2030 (%)

13.6 Middle East and Africa - Market size and forecast 2025-2030

Chart on Middle East and Africa - Market size and forecast 2025-2030 ($ million)
Data Table on Middle East and Africa - Market size and forecast 2025-2030 ($ million)
Chart on Middle East and Africa - Year-over-year growth 2025-2030 (%)
Data Table on Middle East and Africa - Year-over-year growth 2025-2030 (%)
Chart on Regional Comparison - Middle East and Africa
Data Table on Regional Comparison - Middle East and Africa

13.6.1 Saudi Arabia - Market size and forecast 2025-2030

Chart on Saudi Arabia - Market size and forecast 2025-2030 ($ million)
Data Table on Saudi Arabia - Market size and forecast 2025-2030 ($ million)
Chart on Saudi Arabia - Year-over-year growth 2025-2030 (%)
Data Table on Saudi Arabia - Year-over-year growth 2025-2030 (%)

13.6.2 UAE - Market size and forecast 2025-2030

Chart on UAE - Market size and forecast 2025-2030 ($ million)
Data Table on UAE - Market size and forecast 2025-2030 ($ million)
Chart on UAE - Year-over-year growth 2025-2030 (%)
Data Table on UAE - Year-over-year growth 2025-2030 (%)

13.6.3 South Africa - Market size and forecast 2025-2030

Chart on South Africa - Market size and forecast 2025-2030 ($ million)
Data Table on South Africa - Market size and forecast 2025-2030 ($ million)
Chart on South Africa - Year-over-year growth 2025-2030 (%)
Data Table on South Africa - Year-over-year growth 2025-2030 (%)

13.6.4 Israel - Market size and forecast 2025-2030

Chart on Israel - Market size and forecast 2025-2030 ($ million)
Data Table on Israel - Market size and forecast 2025-2030 ($ million)
Chart on Israel - Year-over-year growth 2025-2030 (%)
Data Table on Israel - Year-over-year growth 2025-2030 (%)

13.6.5 Turkey - Market size and forecast 2025-2030

Chart on Turkey - Market size and forecast 2025-2030 ($ million)
Data Table on Turkey - Market size and forecast 2025-2030 ($ million)
Chart on Turkey - Year-over-year growth 2025-2030 (%)
Data Table on Turkey - Year-over-year growth 2025-2030 (%)

13.7 South America - Market size and forecast 2025-2030

Chart on South America - Market size and forecast 2025-2030 ($ million)
Data Table on South America - Market size and forecast 2025-2030 ($ million)
Chart on South America - Year-over-year growth 2025-2030 (%)
Data Table on South America - Year-over-year growth 2025-2030 (%)
Chart on Regional Comparison - South America
Data Table on Regional Comparison - South America

13.7.1 Brazil - Market size and forecast 2025-2030

Chart on Brazil - Market size and forecast 2025-2030 ($ million)
Data Table on Brazil - Market size and forecast 2025-2030 ($ million)
Chart on Brazil - Year-over-year growth 2025-2030 (%)
Data Table on Brazil - Year-over-year growth 2025-2030 (%)

13.7.2 Argentina - Market size and forecast 2025-2030

Chart on Argentina - Market size and forecast 2025-2030 ($ million)
Data Table on Argentina - Market size and forecast 2025-2030 ($ million)
Chart on Argentina - Year-over-year growth 2025-2030 (%)
Data Table on Argentina - Year-over-year growth 2025-2030 (%)

13.7.3 Chile - Market size and forecast 2025-2030

Chart on Chile - Market size and forecast 2025-2030 ($ million)
Data Table on Chile - Market size and forecast 2025-2030 ($ million)
Chart on Chile - Year-over-year growth 2025-2030 (%)
Data Table on Chile - Year-over-year growth 2025-2030 (%)

13.8 Market opportunity by geography

Market opportunity by geography ($ million)
Data Tables on Market opportunity by geography ($ million)

14. Drivers, Challenges, and Opportunity

14.1 Market drivers

Proliferation of mobile communication devices and high-speed connectivity
Evolution of sustainable monetisation models and multi-product bundles
Integration of AI and data analytics in newsroom workflows

14.2 Market challenges

Escalating digital subscription fatigue and plateauing average revenue per user
Substantial volatility in referral traffic driven by platform algorithmic overhauls
Proliferation of alternative information synthesizers and digital misinformation

14.3 Impact of drivers and challenges

Impact of drivers and challenges in 2025 and 2030

14.4 Market opportunities

Strategic deployment of AI for content personalization and operational efficiency
Aggressive shift toward reader-centric monetization and multi-product bundles
Integration of diverse multimedia formats and immersive news storytelling

15. Competitive Landscape

15.1 Overview

15.2

Overview on criticality of inputs and factors of differentiation

15.3 Landscape disruption

Overview on factors of disruption

15.4 Industry risks

Impact of key risks on business

16. Competitive Analysis

16.1 Companies profiled

Companies covered

16.2 Company ranking index

16.3 Market positioning of companies

Matrix on companies position and classification

16.4 ABP Network Pvt. Ltd.

ABP Network Pvt. Ltd. - Overview
ABP Network Pvt. Ltd. - Product / Service
ABP Network Pvt. Ltd. - Key offerings
SWOT

16.5 Advance Local Media LLC

Advance Local Media LLC - Overview
Advance Local Media LLC - Product / Service
Advance Local Media LLC - Key offerings
SWOT

16.6 Amedia AS

Amedia AS - Overview
Amedia AS - Product / Service
Amedia AS - Key offerings
SWOT

16.7 BILD

BILD - Overview
BILD - Product / Service
BILD - Key offerings
SWOT

16.8 Daily Mail and General Trust plc

Daily Mail and General Trust plc - Overview
Daily Mail and General Trust plc - Product / Service
Daily Mail and General Trust plc - Key offerings
SWOT

16.9 Daily Maverick

Daily Maverick - Overview
Daily Maverick - Product / Service
Daily Maverick - Key offerings
SWOT

16.10 Financial Times Ltd.

Financial Times Ltd. - Overview
Financial Times Ltd. - Product / Service
Financial Times Ltd. - Key offerings
SWOT

16.11 HT Media Ltd.

HT Media Ltd. - Overview
HT Media Ltd. - Product / Service
HT Media Ltd. - Key offerings
SWOT

16.12 Jagran New Media

Jagran New Media - Overview
Jagran New Media - Product / Service
Jagran New Media - Key offerings
SWOT

16.13 Malayala Manorama Co. Ltd.

Malayala Manorama Co. Ltd. - Overview
Malayala Manorama Co. Ltd. - Product / Service
Malayala Manorama Co. Ltd. - Key offerings
SWOT

16.14 McClatchy

McClatchy - Overview
McClatchy - Product / Service
McClatchy - Key offerings
SWOT

16.15 Mediahuis NV

Mediahuis NV - Overview
Mediahuis NV - Product / Service
Mediahuis NV - Key offerings
SWOT

16.16 New York Post

New York Post - Overview
New York Post - Product / Service
New York Post - Key offerings
SWOT

16.17 Reach plc

Reach plc - Overview
Reach plc - Business segments
Reach plc - Key offerings
Reach plc - Segment focus
SWOT

16.18 The Globe and Mail Inc.

The Globe and Mail Inc. - Overview
The Globe and Mail Inc. - Product / Service
The Globe and Mail Inc. - Key offerings
SWOT

17. Appendix

17.1 Scope of the report

Market definition
Objectives
Notes and caveats

17.2 Inclusions and exclusions checklist

Inclusions checklist
Exclusions checklist

17.3 Currency conversion rates for US$

17.4 Research methodology

17.5 Data procurement

Information sources

17.6 Data validation

17.7 Validation techniques employed for market sizing

17.8 Data synthesis

17.9 360 degree market analysis

17.10 List of abbreviations

Research Methodology

Technavio presents a detailed picture of the market by way of study, synthesis, and summation of data from multiple sources. The analysts have presented the various facets of the market with a particular focus on identifying the key industry influencers. The data thus presented is comprehensive, reliable, and the result of extensive research, both primary and secondary.

INFORMATION SOURCES

Primary sources

  • Manufacturers and suppliers
  • Channel partners
  • Industry experts
  • Strategic decision makers

Secondary sources

  • Industry journals and periodicals
  • Government data
  • Financial reports of key industry players
  • Historical data
  • Press releases

DATA ANALYSIS

Data Synthesis

  • Collation of data
  • Estimation of key figures
  • Analysis of derived insights

Data Validation

  • Triangulation with data models
  • Reference against proprietary databases
  • Corroboration with industry experts

REPORT WRITING

Qualitative

  • Market drivers
  • Market challenges
  • Market trends
  • Five forces analysis

Quantitative

  • Market size and forecast
  • Market segmentation
  • Geographical insights
  • Competitive landscape

Interested in this report?

Get your sample now to see our research methodology and insights!

Download Now

Frequently Asked Questions

Digital Newspaper Publishing market growth will increase by USD 8495.1 million during 2026-2030.

The Digital Newspaper Publishing market is expected to grow at a CAGR of 4% during 2026-2030.

Digital Newspaper Publishing market is segmented by Type (General news, Specific news) Application (Smartphones, Laptops, PCs, Others) Product type (Digital books, Digital journals, Others) End-user (Individual consumers, Educational institutions, Corporate)

ABP Network Pvt. Ltd., Advance Local Media LLC, Amedia AS, BILD, Daily Mail and General Trust plc, Daily Maverick, Financial Times Ltd., Guardian Media Group plc, HT Media Ltd., Jagran New Media, Malayala Manorama Co. Ltd., McClatchy, Mediahuis NV, New York Post, Reach plc, The Globe and Mail Inc., The Hindu Group, The Washington Post, Times Internet Ltd., USA TODAY, WELT are a few of the key vendors in the Digital Newspaper Publishing market.

APAC will register the highest growth rate of 36.8% among the other regions. Therefore, the Digital Newspaper Publishing market in APAC is expected to garner significant business opportunities for the vendors during the forecast period.

China, Japan, India, South Korea, Australia, Indonesia, US, Canada, Mexico, Germany, UK, France, Italy, Spain, The Netherlands, Saudi Arabia, UAE, South Africa, Israel, Turkey, Brazil, Argentina, Chile

  • Proliferation of mobile communication devices and high-speed connectivity is the driving factor this market.

The Digital Newspaper Publishing market vendors should focus on grabbing business opportunities from the Type segment as it accounted for the largest market share in the base year.
RIA - Research AI Assistant
Ask RIA
