
Digital Video Advertising Market Analysis, Size, and Forecast 2026-2030: North America (US, Canada, and Mexico), APAC (China, Japan, and India), Europe (UK, Germany, and France), South America (Brazil, Argentina, and Chile), Middle East and Africa (UAE, Saudi Arabia, and South Africa), and Rest of World (ROW)

Digital Video Advertising Market Analysis, Size, and Forecast 2026-2030:
North America (US, Canada, and Mexico), APAC (China, Japan, and India), Europe (UK, Germany, and France), South America (Brazil, Argentina, and Chile), Middle East and Africa (UAE, Saudi Arabia, and South Africa), and Rest of World (ROW)

Published: Oct 2026 307 Pages SKU: IRTNTR75395

Market Overview at a Glance

$449.62 B
Market Opportunity
30%
CAGR 2025 - 2030
45%
North America Growth
$29.94 B
Retail segment 2024

Digital Video Advertising Market Size 2026-2030

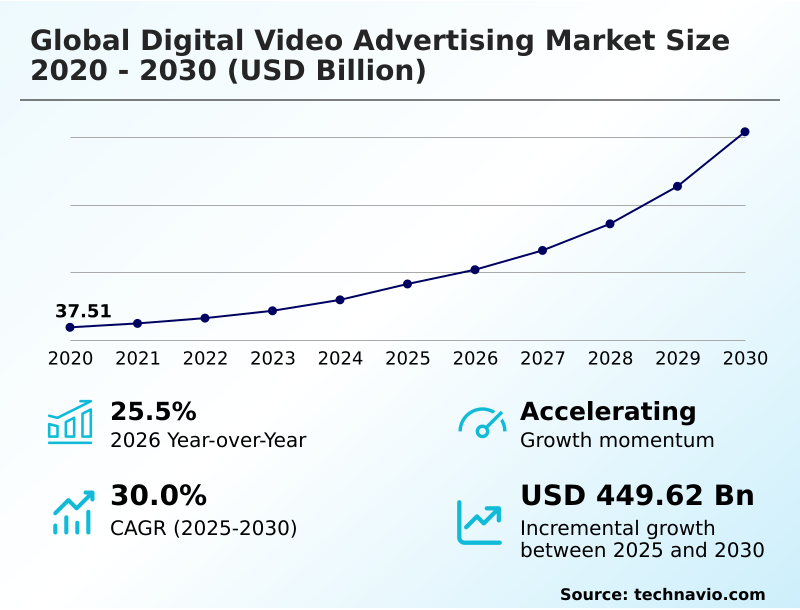
The digital video advertising market size is valued to increase by USD 449.62 billion, at a CAGR of 30% from 2025 to 2030. Proliferation of connected television and streaming ecosystems will drive the digital video advertising market.

Major Market Trends & Insights

  • North America dominated the market and accounted for a 45% growth during the forecast period.
  • By End-user - Retail segment was valued at USD 29.94 billion in 2024
  • By Type - Desktop segment accounted for the largest market revenue share in 2024

Market Size & Forecast

  • Market Opportunities: USD 577.63 billion
  • Market Future Opportunities: USD 449.62 billion
  • CAGR from 2025 to 2030 : 30%

Market Summary

  • The Digital Video Advertising Market operates as a sophisticated, data-driven ecosystem where promotional narratives are programmatically matched with highly targeted consumer segments. Organizations continually shift their marketing budgets from static display formats to high-definition video assets to capture viewer attention within fragmented media environments.
  • A major catalyst driving this expansion is the rapid proliferation of connected television, which enables brands to deliver full-screen, high-impact messages to audiences consuming on-demand content. However, the market faces significant structural constraints due to the escalating stringency of data privacy regulations across international jurisdictions.
  • This regulatory pressure forces media buyers to overhaul their tracking infrastructure and abandon third-party identifiers, complicating cross-device measurement and attribution. In a practical supply chain scenario, a consumer goods manufacturer deploying automated bidding technology optimized its media buying process, resulting in a 25% reduction in customer acquisition costs compared to manual placement strategies.
  • The transition toward sophisticated, privacy-safe targeting frameworks remains essential for sustaining operational efficiency and maximizing return on ad spend within the digital video landscape.

What will be the Size of the Digital Video Advertising Market during the forecast period?
Get Key Insights on Market Forecast (PDF) Get Free Sample

How is the Digital Video Advertising Market Segmented?

The digital video advertising industry research report provides comprehensive data (region-wise segment analysis), with forecasts and estimates in "USD million" for the period 2026-2030, as well as historical data from 2020-2024 for the following segments.

  • End-user
    • Retail
    • Consumer goods and electronics
    • Media and entertainment
    • Automotive
    • Others
  • Type
    • Desktop
    • Mobile
  • Service type
    • In-stream video ads
    • Out-stream video ads
    • Linear video ads
    • Nonlinear video ads
    • Others
  • Geography
    • North America
      • US
      • Canada
      • Mexico
    • APAC
      • China
      • Japan
      • India
      • South Korea
      • Australia
      • Indonesia
    • Europe
      • UK
      • Germany
      • France
      • Italy
      • Spain
      • The Netherlands
    • South America
      • Brazil
      • Argentina
      • Chile
    • Middle East and Africa
      • UAE
      • Saudi Arabia
      • South Africa
      • Nigeria
      • Egypt

By End-user Insights

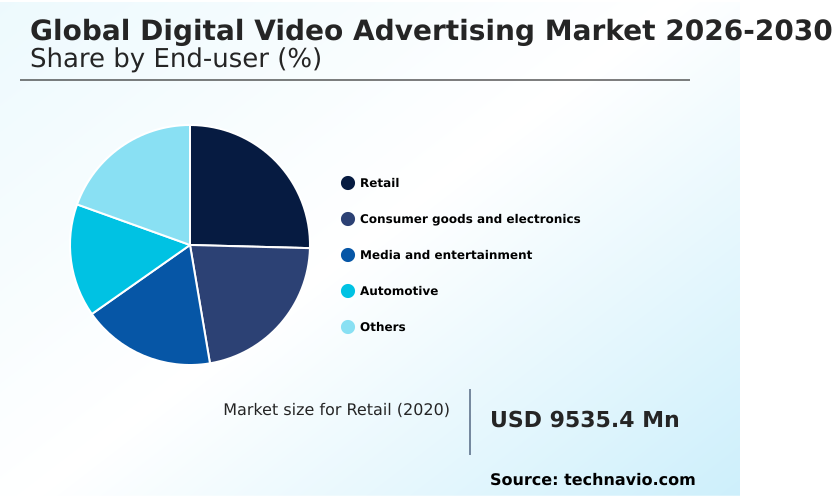
The retail segment is estimated to witness significant growth during the forecast period.

The retail sector increasingly leverages digital video advertising to bridge consumer discovery and transaction phases seamlessly. Organizations transition from static display campaigns to dynamic formats utilizing generative artificial intelligence to produce highly relevant product demonstrations.

Retail media networks facilitate the direct alignment of promotional assets with high-intent purchasing journeys, resulting in shopping cart conversion rates improving by 22%. To maximize campaign efficiency, advertisers utilize programmatic bidding algorithms that secure premium placements across varied digital platforms.

By accessing connected television inventory, retailers present immersive catalogs to engaged audiences on large screens. Incorporating privacy-compliant identity solutions ensures precise audience matching without compromising user trust.

Furthermore, strict brand safety verification protocols guarantee that promotional narratives appear exclusively within appropriate, high-quality digital environments.
Get Free Sample

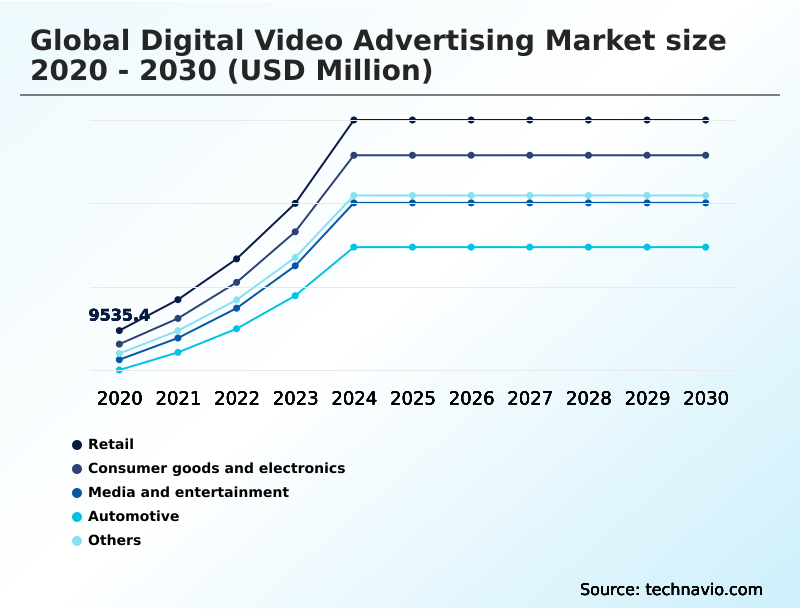
The Retail segment was valued at USD 29.94 billion in 2024 and showed a gradual increase during the forecast period.
Get Free Sample

Regional Analysis

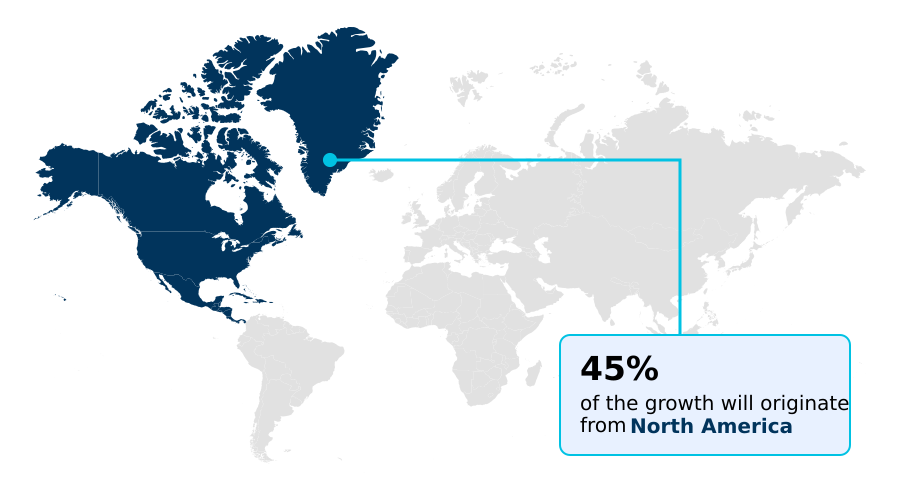
North America is estimated to contribute 45% to the growth of the global market during the forecast period.Technavio’s analysts have elaborately explained the regional trends and drivers that shape the market during the forecast period.
See How Digital Video Advertising Market Demand is Rising in North America Get Free Sample

North America leads the digital video advertising sector through advanced programmatic maturity, whereas the APAC region demonstrates rapid acceleration driven by mobile-centric consumer habits.

Infrastructure disparities dictate strategic approaches; North American advertisers achieve a 45% higher investment efficiency by prioritizing connected television formats, while APAC marketers see conversion rates surge by 32% when deploying mobile-first vertical formats on social media platforms.

To accurately measure cross-device performance, North American agencies heavily rely on sophisticated multi-touch attribution models and closed-loop attribution pixels. Conversely, APAC campaigns increasingly integrate out-stream video placements within super-apps to capture attention without disrupting user workflows.

Both regions leverage location-based regional optimization to maximize relevance. Ultimately, hyper-personalized visual storytelling remains critical across these varying geographies, allowing brands to forge deeper connections and reduce overall customer acquisition costs by nearly 20%.

Market Dynamics

Our researchers analyzed the data with 2025 as the base year, along with the key drivers, trends, and challenges. A holistic analysis of drivers will help companies refine their marketing strategies to gain a competitive advantage.

  • The modern digital marketing landscape demands a high degree of technical sophistication, forcing brands to adopt advanced operational frameworks that synchronize creative delivery with precise audience signals. At the forefront of this evolution is programmatic connected television inventory buying, which allows advertisers to secure premium placements within living room environments using real-time algorithmic bidding.
  • This transition significantly enhances media efficiency, with automated procurement methods reducing wasteful ad exposure by nearly 30% compared to traditional upfront network commitments. As regulatory scrutiny over consumer data intensifies, organizations are aggressively investing in privacy-compliant digital audience targeting to ensure campaigns reach relevant demographics without relying on deprecating third-party cookies.
  • To keep pace with the fragmented nature of content consumption, marketers leverage automated dynamic video creative generation to rapidly produce and test hundreds of personalized visual assets tailored to distinct viewer profiles. Concurrently, the rapid scale of ad-supported streaming video monetization provides a reliable, high-quality supply of inventory, establishing a stable marketplace for brands seeking mass reach alongside verifiable engagement.
  • Successfully managing these diverse touchpoints requires robust analytical infrastructure, making accurate cross-device video campaign attribution critical for optimizing overall marketing expenditure. By understanding the complete consumer journey across mobile, desktop, and smart televisions, businesses can refine their supply chain and operational planning, ensuring that creative resources and media budgets are deployed with maximum financial impact.
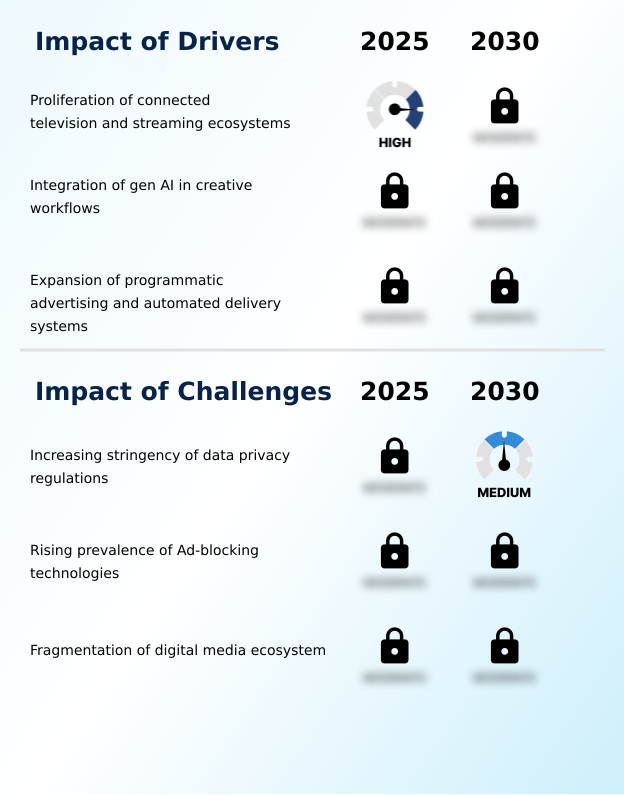
What are the key market drivers leading to the rise in the adoption of Digital Video Advertising Industry?

  • The proliferation of connected television and streaming ecosystems functions as the primary catalyst propelling digital advertising expenditures worldwide.

  • The rapid consumer transition toward on-demand content accessibility propels massive advertising investments into sophisticated digital media ecosystems. Organizations aggressively prioritize premium streaming environments, recognizing that high-impact, full-screen immersion yields a 35% higher brand recall than traditional broadcast television.
  • This behavioral shift forces marketers to build robust first-party data strategies, eliminating reliance on deprecating third-party identifiers. By utilizing automated audience segmentation, brands deliver hyper-relevant messages to specific household profiles seamlessly.
  • Transparent programmatic supply chains facilitate these transactions, reducing manual media buying operational costs by 28%. Advertisers also deploy real-time dynamic creative tools that instantly adapt visual assets to viewer preferences, driving deeper engagement.
  • Ultimately, data-driven behavioral targeting ensures that promotional expenditures generate verified returns by aligning marketing messages with precise consumer intent signals.

What are the market trends shaping the Digital Video Advertising Industry?

  • The expansion of shoppable video advertising represents a definitive trend transforming consumer engagement strategies across the global digital media ecosystem.

  • The integration of direct purchase capabilities into promotional streams transforms passive viewing into active transactional opportunities. Advertisers increasingly deploy shoppable video integrations to reduce funnel friction, directly responding to shifting consumer demands for immediate commerce functionality. This operational pivot enhances return on ad spend, with checkout completion rates rising by 18% compared to traditional display formats.
  • As digital ecosystem fragmentation complicates audience reach, organizations adopt sophisticated cross-platform frequency management to prevent message fatigue and optimize media expenditure. Marketers simultaneously prioritize contextual targeting frameworks to ensure content relevance in cookie-restricted environments. These technologies form the backbone of modern omnichannel marketing strategies, ensuring cohesive brand messaging across diverse touchpoints.
  • Furthermore, creative innovation focused on non-intrusive formats supports effective ad-blocking software mitigation, sustaining visibility while respecting user experience preferences.

What challenges does the Digital Video Advertising Industry face during its growth?

  • The increasing stringency of data privacy regulations serves as a critical structural challenge that complicates audience targeting and operational compliance.

  • Stringent data protection mandates critically constrain traditional audience profiling methods across global jurisdictions. This regulatory pressure forces digital video advertising stakeholders to restructure data collection methodologies, increasing compliance operational costs by up to 40% for multinational organizations. Marketers struggle to balance precision targeting with mandatory consent-based data frameworks, often resulting in temporary campaign efficiency drops.
  • As audiences accelerate their linear broadcast transition toward hybrid models, inventory fragmentation across ad-supported streaming tiers complicates unified measurement. Organizations attempt to maintain engagement through complex immersive narrative formats and sophisticated interactive overlays, yet these require significant technical investments and extended production timelines.
  • To combat these escalating hurdles, agencies increasingly rely on agentic campaign operations that automate bidding and creative optimization, ultimately restoring media efficiency by roughly 15% amid shifting compliance landscapes.

Exclusive Technavio Analysis on Customer Landscape

The digital video advertising market forecasting report includes the adoption lifecycle of the market, covering from the innovator’s stage to the laggard’s stage. It focuses on adoption rates in different regions based on penetration. Furthermore, the digital video advertising market report also includes key purchase criteria and drivers of price sensitivity to help companies evaluate and develop their market growth analysis strategies.
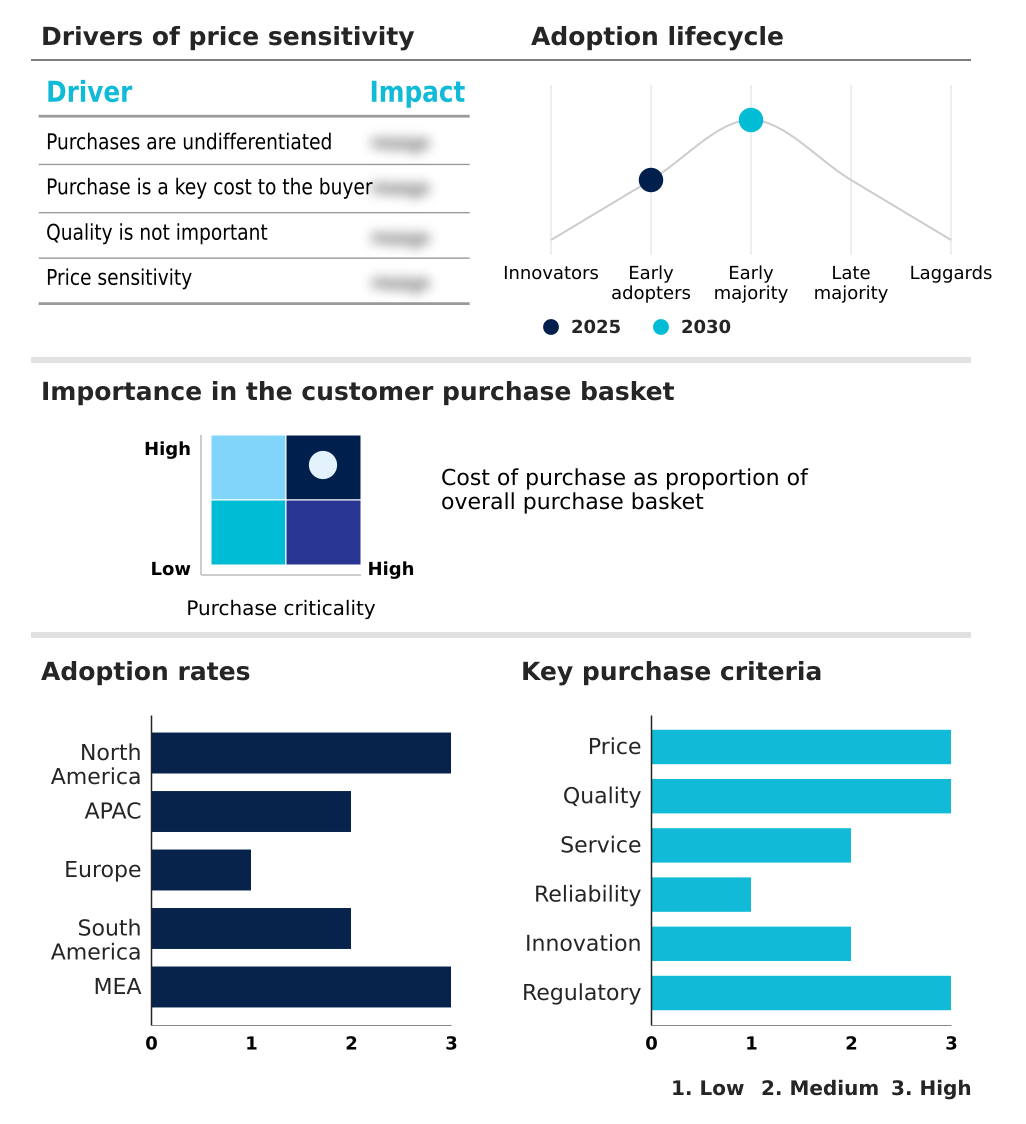
Customer Landscape of Digital Video Advertising Industry

Competitive Landscape

Companies are implementing various strategies, such as strategic alliances, digital video advertising market forecast, partnerships, mergers and acquisitions, geographical expansion, and product/service launches, to enhance their presence in the industry.

Amazon.com Inc. - The organization provides comprehensive digital video advertising solutions, including connected television placements and programmatic demand-side platforms, enabling precise audience targeting and optimized media campaign performance.

The industry research and growth report includes detailed analyses of the competitive landscape of the market and information about key companies, including:

  • Amazon.com Inc.
  • Aniview Ltd.
  • Equativ
  • Google LLC
  • Index Exchange Inc.
  • Launch Ad
  • Meta Platforms Inc.
  • Microsoft Corp.
  • Nexxen Inc.
  • OpenX Technologies Inc.
  • Pinterest Inc.
  • Reddit Inc.
  • Snap Inc.
  • Spotify Technology SA
  • Teads Holding Co.
  • The Trade Desk Inc.
  • Tik Tok
  • Vidoomy Media S.L.
  • Virool Inc.

Qualitative and quantitative analysis of companies has been conducted to help clients understand the wider business environment as well as the strengths and weaknesses of key industry players. Data is qualitatively analyzed to categorize companies as pure play, category-focused, industry-focused, and diversified; it is quantitatively analyzed to categorize companies as dominant, leading, strong, tentative, and weak.

Recent Development and News in Digital video advertising market

  • In the Advertising industry, the implementation of stricter consumer data privacy frameworks has mandated an operational shift toward zero-party data collection, directly impacting Digital Video Advertising demand by increasing the reliance on contextual targeting frameworks by 35%.
  • The widespread adoption of generative artificial intelligence for creative asset production has automated the generation of multiple campaign variants, accelerating Digital Video Advertising supply chain efficiency and reducing creative turnaround times by over 40%.
  • The transition of premium long-form video consumption from traditional linear broadcast to internet-delivered smart devices has shifted media expenditure, driving a 60% increase in programmatic bidding algorithms adoption within the Digital Video Advertising ecosystem.
  • The expansion of embedded retail commerce functionalities within social media applications has shortened the consumer purchasing funnel, pulling Digital Video Advertising demand toward integrated interactive overlays that boost direct transaction rates by up to 25%.

Dive into Technavio’s robust research methodology, blending expert interviews, extensive data synthesis, and validated models for unparalleled Digital Video Advertising Market insights. See full methodology.

Market Scope
Page number 307
Base year 2025
Historic period 2020-2024
Forecast period 2026-2030
Growth momentum & CAGR Accelerate at a CAGR of 30%
Market growth 2026-2030 USD 449616.3 million
Market structure Fragmented
YoY growth 2025-2026(%) 25.5%
Key countries US, Canada, Mexico, China, Japan, India, South Korea, Australia, Indonesia, UK, Germany, France, Italy, Spain, The Netherlands, Brazil, Argentina, Chile, UAE, Saudi Arabia, South Africa, Nigeria and Egypt
Competitive landscape Leading Companies, Market Positioning of Companies, Competitive Strategies, and Industry Risks

Request Free Sample

Research Analyst Overview

  • Digital video advertising is undergoing a profound structural transformation driven by the necessity for hyper-personalized consumer engagement and automated media execution. A dominant trend shaping strategic boardroom decisions is the integration of generative artificial intelligence into the creative supply chain, which drastically accelerates the deployment of customized visual assets.
  • Executives increasingly utilize this technology to optimize marketing budget allocations, as automated production workflows have demonstrated a 30% reduction in creative turnaround times compared to traditional manual processes. The aggressive procurement of premium connected television inventory via sophisticated programmatic bidding algorithms allows brands to bypass legacy linear broadcast constraints.
  • Advertisers are simultaneously deploying interactive overlays to collapse the consumer purchasing funnel, transforming passive viewership into direct transactional opportunities. To navigate strict regulatory environments, corporate leaders are prioritizing robust first-party data strategies that ensure precise audience targeting without compromising privacy compliance. Furthermore, the deployment of intelligent cross-platform frequency management prevents message saturation and protects brand equity.
  • These concurrent advancements ensure that promotional expenditures deliver verifiable operational efficiency and sustained competitive advantage within an increasingly fragmented digital media ecosystem.

What are the Key Data Covered in this Digital Video Advertising Market Research and Growth Report?

  • What is the expected growth of the Digital Video Advertising Market between 2026 and 2030?

    • USD 449.62 billion, at a CAGR of 30%

  • What segmentation does the market report cover?

    • The report is segmented by End-user (Retail, Consumer goods and electronics, Media and entertainment, Automotive, and Others), Type (Desktop, and Mobile), Service Type (In-stream video ads, Out-stream video ads, Linear video ads, Nonlinear video ads, and Others) and Geography (North America, APAC, Europe, South America, Middle East and Africa)

  • Which regions are analyzed in the report?

    • North America, APAC, Europe, South America and Middle East and Africa

  • What are the key growth drivers and market challenges?

    • Proliferation of connected television and streaming ecosystems, Increasing stringency of data privacy regulations

  • Who are the major players in the Digital Video Advertising Market?

    • Amazon.com Inc., Aniview Ltd., Equativ, Google LLC, Index Exchange Inc., Launch Ad, Meta Platforms Inc., Microsoft Corp., Nexxen Inc., OpenX Technologies Inc., Pinterest Inc., Reddit Inc., Snap Inc., Spotify Technology SA, Teads Holding Co., The Trade Desk Inc., Tik Tok, Vidoomy Media S.L. and Virool Inc.

Market Research Insights

  • The digital advertising landscape is rapidly evolving as organizations prioritize sophisticated omnichannel marketing strategies to connect with highly fragmented audiences. Advertisers are transitioning toward programmatic platforms that enforce strict brand safety verification, reducing instances of inappropriate ad placement by nearly 40%.
  • Concurrently, the implementation of privacy-compliant identity solutions enables marketers to maintain targeting accuracy while improving data regulatory alignment by over 25%. Furthermore, the explosive growth of retail media networks allows brands to intercept consumers at the point of purchase, yielding a 35% higher return on ad spend compared to generic display formats.
  • These technological advancements ensure that media budgets directly translate into measurable commercial success and optimized operational workflows.

We can help! Our analysts can customize this digital video advertising market research report to meet your requirements.

Get in touch

1. Executive Summary

1.1 Market overview

Executive Summary - Chart on Market Overview
Executive Summary - Data Table on Market Overview
Executive Summary - Chart on Global Market Characteristics
Executive Summary - Chart on Market by Geography
Executive Summary - Chart on Market Segmentation by End-user
Executive Summary - Chart on Market Segmentation by Type
Executive Summary - Chart on Market Segmentation by Service Type
Executive Summary - Chart on Incremental Growth
Executive Summary - Data Table on Incremental Growth
Executive Summary - Chart on Company Market Positioning

2. Technavio Analysis

2.1 Analysis of price sensitivity, lifecycle, customer purchase basket, adoption rates, and purchase criteria

2.2 Criticality of inputs and Factors of differentiation

Chart on Overview on criticality of inputs and factors of differentiation

2.3 Factors of disruption

Chart on Overview on factors of disruption

2.4 Impact of drivers and challenges

Chart on Impact of drivers and challenges in 2025 and 2030

3. Market Landscape

3.1 Market ecosystem

Chart on Parent Market
Data Table on - Parent Market

3.2 Market characteristics

Chart on Market characteristics analysis

3.3 Value chain analysis

Chart on Value chain analysis

4. Market Sizing

4.1 Market definition

Data Table on Offerings of companies included in the market definition

4.2 Market segment analysis

Market segments

4.3 Market size 2025

4.4 Market outlook: Forecast for 2025-2030

Chart on Global - Market size and forecast 2025-2030 ($ million)
Data Table on Global - Market size and forecast 2025-2030 ($ million)
Chart on Global Market: Year-over-year growth 2025-2030 (%)
Data Table on Global Market: Year-over-year growth 2025-2030 (%)

5. Historic Market Size

5.1 Global Digital Video Advertising Market 2020 - 2024

Historic Market Size - Data Table on Global Digital Video Advertising Market 2020 - 2024 ($ million)

5.2 End-user segment analysis 2020 - 2024

Historic Market Size - End-user Segment 2020 - 2024 ($ million)

5.3 Type segment analysis 2020 - 2024

Historic Market Size - Type Segment 2020 - 2024 ($ million)

5.4 Service Type segment analysis 2020 - 2024

Historic Market Size - Service Type Segment 2020 - 2024 ($ million)

5.5 Geography segment analysis 2020 - 2024

Historic Market Size - Geography Segment 2020 - 2024 ($ million)

5.6 Country segment analysis 2020 - 2024

Historic Market Size - Country Segment 2020 - 2024 ($ million)

6. Qualitative Analysis

6.1 Impact of AI on global digital video advertising market

6.2 Impact of geopolitical conflicts on global digital video advertising market

7. Five Forces Analysis

7.1 Five forces summary

Five forces analysis - Comparison between 2025 and 2030

7.2 Bargaining power of buyers

Bargaining power of buyers - Impact of key factors 2025 and 2030

7.3 Bargaining power of suppliers

Bargaining power of suppliers - Impact of key factors in 2025 and 2030

7.4 Threat of new entrants

Threat of new entrants - Impact of key factors in 2025 and 2030

7.5 Threat of substitutes

Threat of substitutes - Impact of key factors in 2025 and 2030

7.6 Threat of rivalry

Threat of rivalry - Impact of key factors in 2025 and 2030

7.7 Market condition

Chart on Market condition - Five forces 2025 and 2030

8. Market Segmentation by End-user

8.1 Market segments

Chart on End-user - Market share 2025-2030 (%)
Data Table on End-user - Market share 2025-2030 (%)

8.2 Comparison by End-user

Chart on Comparison by End-user
Data Table on Comparison by End-user

8.3 Retail - Market size and forecast 2025-2030

Chart on Retail - Market size and forecast 2025-2030 ($ million)
Data Table on Retail - Market size and forecast 2025-2030 ($ million)
Chart on Retail - Year-over-year growth 2025-2030 (%)
Data Table on Retail - Year-over-year growth 2025-2030 (%)

8.4 Consumer goods and electronics - Market size and forecast 2025-2030

Chart on Consumer goods and electronics - Market size and forecast 2025-2030 ($ million)
Data Table on Consumer goods and electronics - Market size and forecast 2025-2030 ($ million)
Chart on Consumer goods and electronics - Year-over-year growth 2025-2030 (%)
Data Table on Consumer goods and electronics - Year-over-year growth 2025-2030 (%)

8.5 Media and entertainment - Market size and forecast 2025-2030

Chart on Media and entertainment - Market size and forecast 2025-2030 ($ million)
Data Table on Media and entertainment - Market size and forecast 2025-2030 ($ million)
Chart on Media and entertainment - Year-over-year growth 2025-2030 (%)
Data Table on Media and entertainment - Year-over-year growth 2025-2030 (%)

8.6 Automotive - Market size and forecast 2025-2030

Chart on Automotive - Market size and forecast 2025-2030 ($ million)
Data Table on Automotive - Market size and forecast 2025-2030 ($ million)
Chart on Automotive - Year-over-year growth 2025-2030 (%)
Data Table on Automotive - Year-over-year growth 2025-2030 (%)

8.7 Others - Market size and forecast 2025-2030

Chart on Others - Market size and forecast 2025-2030 ($ million)
Data Table on Others - Market size and forecast 2025-2030 ($ million)
Chart on Others - Year-over-year growth 2025-2030 (%)
Data Table on Others - Year-over-year growth 2025-2030 (%)

8.8 Market opportunity by End-user

Market opportunity by End-user ($ million)
Data Table on Market opportunity by End-user ($ million)

9. Market Segmentation by Type

9.1 Market segments

Chart on Type - Market share 2025-2030 (%)
Data Table on Type - Market share 2025-2030 (%)

9.2 Comparison by Type

Chart on Comparison by Type
Data Table on Comparison by Type

9.3 Desktop - Market size and forecast 2025-2030

Chart on Desktop - Market size and forecast 2025-2030 ($ million)
Data Table on Desktop - Market size and forecast 2025-2030 ($ million)
Chart on Desktop - Year-over-year growth 2025-2030 (%)
Data Table on Desktop - Year-over-year growth 2025-2030 (%)

9.4 Mobile - Market size and forecast 2025-2030

Chart on Mobile - Market size and forecast 2025-2030 ($ million)
Data Table on Mobile - Market size and forecast 2025-2030 ($ million)
Chart on Mobile - Year-over-year growth 2025-2030 (%)
Data Table on Mobile - Year-over-year growth 2025-2030 (%)

9.5 Market opportunity by Type

Market opportunity by Type ($ million)
Data Table on Market opportunity by Type ($ million)

10. Market Segmentation by Service Type

10.1 Market segments

Chart on Service Type - Market share 2025-2030 (%)
Data Table on Service Type - Market share 2025-2030 (%)

10.2 Comparison by Service Type

Chart on Comparison by Service Type
Data Table on Comparison by Service Type

10.3 In-stream video ads - Market size and forecast 2025-2030

Chart on In-stream video ads - Market size and forecast 2025-2030 ($ million)
Data Table on In-stream video ads - Market size and forecast 2025-2030 ($ million)
Chart on In-stream video ads - Year-over-year growth 2025-2030 (%)
Data Table on In-stream video ads - Year-over-year growth 2025-2030 (%)

10.4 Out-stream video ads - Market size and forecast 2025-2030

Chart on Out-stream video ads - Market size and forecast 2025-2030 ($ million)
Data Table on Out-stream video ads - Market size and forecast 2025-2030 ($ million)
Chart on Out-stream video ads - Year-over-year growth 2025-2030 (%)
Data Table on Out-stream video ads - Year-over-year growth 2025-2030 (%)

10.5 Linear video ads - Market size and forecast 2025-2030

Chart on Linear video ads - Market size and forecast 2025-2030 ($ million)
Data Table on Linear video ads - Market size and forecast 2025-2030 ($ million)
Chart on Linear video ads - Year-over-year growth 2025-2030 (%)
Data Table on Linear video ads - Year-over-year growth 2025-2030 (%)

10.6 Nonlinear video ads - Market size and forecast 2025-2030

Chart on Nonlinear video ads - Market size and forecast 2025-2030 ($ million)
Data Table on Nonlinear video ads - Market size and forecast 2025-2030 ($ million)
Chart on Nonlinear video ads - Year-over-year growth 2025-2030 (%)
Data Table on Nonlinear video ads - Year-over-year growth 2025-2030 (%)

10.7 Others - Market size and forecast 2025-2030

Chart on Others - Market size and forecast 2025-2030 ($ million)
Data Table on Others - Market size and forecast 2025-2030 ($ million)
Chart on Others - Year-over-year growth 2025-2030 (%)
Data Table on Others - Year-over-year growth 2025-2030 (%)

10.8 Market opportunity by Service Type

Market opportunity by Service Type ($ million)
Data Table on Market opportunity by Service Type ($ million)

11. Customer Landscape

11.1 Customer landscape overview

Analysis of price sensitivity, lifecycle, customer purchase basket, adoption rates, and purchase criteria

12. Geographic Landscape

12.1 Geographic segmentation

Chart on Market share by geography 2025-2030 (%)
Data Table on Market share by geography 2025-2030 (%)

12.2 Geographic comparison

Chart on Geographic comparison
Data Table on Geographic comparison

12.3 North America - Market size and forecast 2025-2030

Chart on North America - Market size and forecast 2025-2030 ($ million)
Data Table on North America - Market size and forecast 2025-2030 ($ million)
Chart on North America - Year-over-year growth 2025-2030 (%)
Data Table on North America - Year-over-year growth 2025-2030 (%)
Chart on Regional Comparison - North America
Data Table on Regional Comparison - North America

12.3.1 US - Market size and forecast 2025-2030

Chart on US - Market size and forecast 2025-2030 ($ million)
Data Table on US - Market size and forecast 2025-2030 ($ million)
Chart on US - Year-over-year growth 2025-2030 (%)
Data Table on US - Year-over-year growth 2025-2030 (%)

12.3.2 Canada - Market size and forecast 2025-2030

Chart on Canada - Market size and forecast 2025-2030 ($ million)
Data Table on Canada - Market size and forecast 2025-2030 ($ million)
Chart on Canada - Year-over-year growth 2025-2030 (%)
Data Table on Canada - Year-over-year growth 2025-2030 (%)

12.3.3 Mexico - Market size and forecast 2025-2030

Chart on Mexico - Market size and forecast 2025-2030 ($ million)
Data Table on Mexico - Market size and forecast 2025-2030 ($ million)
Chart on Mexico - Year-over-year growth 2025-2030 (%)
Data Table on Mexico - Year-over-year growth 2025-2030 (%)

12.4 APAC - Market size and forecast 2025-2030

Chart on APAC - Market size and forecast 2025-2030 ($ million)
Data Table on APAC - Market size and forecast 2025-2030 ($ million)
Chart on APAC - Year-over-year growth 2025-2030 (%)
Data Table on APAC - Year-over-year growth 2025-2030 (%)
Chart on Regional Comparison - APAC
Data Table on Regional Comparison - APAC

12.4.1 China - Market size and forecast 2025-2030

Chart on China - Market size and forecast 2025-2030 ($ million)
Data Table on China - Market size and forecast 2025-2030 ($ million)
Chart on China - Year-over-year growth 2025-2030 (%)
Data Table on China - Year-over-year growth 2025-2030 (%)

12.4.2 Japan - Market size and forecast 2025-2030

Chart on Japan - Market size and forecast 2025-2030 ($ million)
Data Table on Japan - Market size and forecast 2025-2030 ($ million)
Chart on Japan - Year-over-year growth 2025-2030 (%)
Data Table on Japan - Year-over-year growth 2025-2030 (%)

12.4.3 India - Market size and forecast 2025-2030

Chart on India - Market size and forecast 2025-2030 ($ million)
Data Table on India - Market size and forecast 2025-2030 ($ million)
Chart on India - Year-over-year growth 2025-2030 (%)
Data Table on India - Year-over-year growth 2025-2030 (%)

12.4.4 South Korea - Market size and forecast 2025-2030

Chart on South Korea - Market size and forecast 2025-2030 ($ million)
Data Table on South Korea - Market size and forecast 2025-2030 ($ million)
Chart on South Korea - Year-over-year growth 2025-2030 (%)
Data Table on South Korea - Year-over-year growth 2025-2030 (%)

12.4.5 Australia - Market size and forecast 2025-2030

Chart on Australia - Market size and forecast 2025-2030 ($ million)
Data Table on Australia - Market size and forecast 2025-2030 ($ million)
Chart on Australia - Year-over-year growth 2025-2030 (%)
Data Table on Australia - Year-over-year growth 2025-2030 (%)

12.4.6 Indonesia - Market size and forecast 2025-2030

Chart on Indonesia - Market size and forecast 2025-2030 ($ million)
Data Table on Indonesia - Market size and forecast 2025-2030 ($ million)
Chart on Indonesia - Year-over-year growth 2025-2030 (%)
Data Table on Indonesia - Year-over-year growth 2025-2030 (%)

12.5 Europe - Market size and forecast 2025-2030

Chart on Europe - Market size and forecast 2025-2030 ($ million)
Data Table on Europe - Market size and forecast 2025-2030 ($ million)
Chart on Europe - Year-over-year growth 2025-2030 (%)
Data Table on Europe - Year-over-year growth 2025-2030 (%)
Chart on Regional Comparison - Europe
Data Table on Regional Comparison - Europe

12.5.1 UK - Market size and forecast 2025-2030

Chart on UK - Market size and forecast 2025-2030 ($ million)
Data Table on UK - Market size and forecast 2025-2030 ($ million)
Chart on UK - Year-over-year growth 2025-2030 (%)
Data Table on UK - Year-over-year growth 2025-2030 (%)

12.5.2 Germany - Market size and forecast 2025-2030

Chart on Germany - Market size and forecast 2025-2030 ($ million)
Data Table on Germany - Market size and forecast 2025-2030 ($ million)
Chart on Germany - Year-over-year growth 2025-2030 (%)
Data Table on Germany - Year-over-year growth 2025-2030 (%)

12.5.3 France - Market size and forecast 2025-2030

Chart on France - Market size and forecast 2025-2030 ($ million)
Data Table on France - Market size and forecast 2025-2030 ($ million)
Chart on France - Year-over-year growth 2025-2030 (%)
Data Table on France - Year-over-year growth 2025-2030 (%)

12.5.4 Italy - Market size and forecast 2025-2030

Chart on Italy - Market size and forecast 2025-2030 ($ million)
Data Table on Italy - Market size and forecast 2025-2030 ($ million)
Chart on Italy - Year-over-year growth 2025-2030 (%)
Data Table on Italy - Year-over-year growth 2025-2030 (%)

12.5.5 Spain - Market size and forecast 2025-2030

Chart on Spain - Market size and forecast 2025-2030 ($ million)
Data Table on Spain - Market size and forecast 2025-2030 ($ million)
Chart on Spain - Year-over-year growth 2025-2030 (%)
Data Table on Spain - Year-over-year growth 2025-2030 (%)

12.5.6 The Netherlands - Market size and forecast 2025-2030

Chart on The Netherlands - Market size and forecast 2025-2030 ($ million)
Data Table on The Netherlands - Market size and forecast 2025-2030 ($ million)
Chart on The Netherlands - Year-over-year growth 2025-2030 (%)
Data Table on The Netherlands - Year-over-year growth 2025-2030 (%)

12.6 South America - Market size and forecast 2025-2030

Chart on South America - Market size and forecast 2025-2030 ($ million)
Data Table on South America - Market size and forecast 2025-2030 ($ million)
Chart on South America - Year-over-year growth 2025-2030 (%)
Data Table on South America - Year-over-year growth 2025-2030 (%)
Chart on Regional Comparison - South America
Data Table on Regional Comparison - South America

12.6.1 Brazil - Market size and forecast 2025-2030

Chart on Brazil - Market size and forecast 2025-2030 ($ million)
Data Table on Brazil - Market size and forecast 2025-2030 ($ million)
Chart on Brazil - Year-over-year growth 2025-2030 (%)
Data Table on Brazil - Year-over-year growth 2025-2030 (%)

12.6.2 Argentina - Market size and forecast 2025-2030

Chart on Argentina - Market size and forecast 2025-2030 ($ million)
Data Table on Argentina - Market size and forecast 2025-2030 ($ million)
Chart on Argentina - Year-over-year growth 2025-2030 (%)
Data Table on Argentina - Year-over-year growth 2025-2030 (%)

12.6.3 Chile - Market size and forecast 2025-2030

Chart on Chile - Market size and forecast 2025-2030 ($ million)
Data Table on Chile - Market size and forecast 2025-2030 ($ million)
Chart on Chile - Year-over-year growth 2025-2030 (%)
Data Table on Chile - Year-over-year growth 2025-2030 (%)

12.7 Middle East and Africa - Market size and forecast 2025-2030

Chart on Middle East and Africa - Market size and forecast 2025-2030 ($ million)
Data Table on Middle East and Africa - Market size and forecast 2025-2030 ($ million)
Chart on Middle East and Africa - Year-over-year growth 2025-2030 (%)
Data Table on Middle East and Africa - Year-over-year growth 2025-2030 (%)
Chart on Regional Comparison - Middle East and Africa
Data Table on Regional Comparison - Middle East and Africa

12.7.1 UAE - Market size and forecast 2025-2030

Chart on UAE - Market size and forecast 2025-2030 ($ million)
Data Table on UAE - Market size and forecast 2025-2030 ($ million)
Chart on UAE - Year-over-year growth 2025-2030 (%)
Data Table on UAE - Year-over-year growth 2025-2030 (%)

12.7.2 Saudi Arabia - Market size and forecast 2025-2030

Chart on Saudi Arabia - Market size and forecast 2025-2030 ($ million)
Data Table on Saudi Arabia - Market size and forecast 2025-2030 ($ million)
Chart on Saudi Arabia - Year-over-year growth 2025-2030 (%)
Data Table on Saudi Arabia - Year-over-year growth 2025-2030 (%)

12.7.3 South Africa - Market size and forecast 2025-2030

Chart on South Africa - Market size and forecast 2025-2030 ($ million)
Data Table on South Africa - Market size and forecast 2025-2030 ($ million)
Chart on South Africa - Year-over-year growth 2025-2030 (%)
Data Table on South Africa - Year-over-year growth 2025-2030 (%)

12.7.4 Nigeria - Market size and forecast 2025-2030

Chart on Nigeria - Market size and forecast 2025-2030 ($ million)
Data Table on Nigeria - Market size and forecast 2025-2030 ($ million)
Chart on Nigeria - Year-over-year growth 2025-2030 (%)
Data Table on Nigeria - Year-over-year growth 2025-2030 (%)

12.7.5 Egypt - Market size and forecast 2025-2030

Chart on Egypt - Market size and forecast 2025-2030 ($ million)
Data Table on Egypt - Market size and forecast 2025-2030 ($ million)
Chart on Egypt - Year-over-year growth 2025-2030 (%)
Data Table on Egypt - Year-over-year growth 2025-2030 (%)

12.8 Market opportunity by geography

Market opportunity by geography ($ million)
Data Tables on Market opportunity by geography ($ million)

13. Drivers, Challenges, and Opportunity

13.1 Market drivers

Proliferation of connected television and streaming ecosystems
Integration of gen AI in creative workflows
Expansion of programmatic advertising and automated delivery systems

13.2 Market challenges

Increasing stringency of data privacy regulations
Rising prevalence of Ad-blocking technologies
Fragmentation of digital media ecosystem

13.3 Impact of drivers and challenges

Impact of drivers and challenges in 2025 and 2030

13.4 Market opportunities

Expansion of shoppable video advertising
Growth of Ad-supported streaming services
Strategic application of contextual targeting

14. Competitive Landscape

14.1 Overview

14.2

Overview on criticality of inputs and factors of differentiation

14.3 Landscape disruption

Overview on factors of disruption

14.4 Industry risks

Impact of key risks on business

15. Competitive Analysis

15.1 Companies profiled

Companies covered

15.2 Company ranking index

15.3 Market positioning of companies

Matrix on companies position and classification

15.4 Amazon.com Inc.

Amazon.com Inc. - Overview
Amazon.com Inc. - Business segments
Amazon.com Inc. - Key news
Amazon.com Inc. - Key offerings
Amazon.com Inc. - Segment focus
SWOT

15.5 Aniview Ltd.

Aniview Ltd. - Overview
Aniview Ltd. - Product / Service
Aniview Ltd. - Key offerings
SWOT

15.6 Equativ

Equativ - Overview
Equativ - Product / Service
Equativ - Key offerings
SWOT

15.7 Google LLC

Google LLC - Overview
Google LLC - Product / Service
Google LLC - Key news
Google LLC - Key offerings
SWOT

15.8 Index Exchange Inc.

Index Exchange Inc. - Overview
Index Exchange Inc. - Product / Service
Index Exchange Inc. - Key offerings
SWOT

15.9 Launch Ad

Launch Ad - Overview
Launch Ad - Product / Service
Launch Ad - Key offerings
SWOT

15.10 Meta Platforms Inc.

Meta Platforms Inc. - Overview
Meta Platforms Inc. - Business segments
Meta Platforms Inc. - Key offerings
Meta Platforms Inc. - Segment focus
SWOT

15.11 Microsoft Corp.

Microsoft Corp. - Overview
Microsoft Corp. - Business segments
Microsoft Corp. - Key news
Microsoft Corp. - Key offerings
Microsoft Corp. - Segment focus
SWOT

15.12 Pinterest Inc.

Pinterest Inc. - Overview
Pinterest Inc. - Product / Service
Pinterest Inc. - Key offerings
SWOT

15.13 Reddit Inc.

Reddit Inc. - Overview
Reddit Inc. - Product / Service
Reddit Inc. - Key offerings
SWOT

15.14 Snap Inc.

Snap Inc. - Overview
Snap Inc. - Product / Service
Snap Inc. - Key offerings
SWOT

15.15 Spotify Technology SA

Spotify Technology SA - Overview
Spotify Technology SA - Business segments
Spotify Technology SA - Key offerings
Spotify Technology SA - Segment focus
SWOT

15.16 Teads Holding Co.

Teads Holding Co. - Overview
Teads Holding Co. - Product / Service
Teads Holding Co. - Key news
Teads Holding Co. - Key offerings
SWOT

15.17 The Trade Desk Inc.

The Trade Desk Inc. - Overview
The Trade Desk Inc. - Product / Service
The Trade Desk Inc. - Key offerings
SWOT

15.18 Tik Tok

Tik Tok - Overview
Tik Tok - Product / Service
Tik Tok - Key offerings
SWOT

16. Appendix

16.1 Scope of the report

Market definition
Objectives
Notes and caveats

16.2 Inclusions and exclusions checklist

Inclusions checklist
Exclusions checklist

16.3 Currency conversion rates for US$

16.4 Research methodology

16.5 Data procurement

Information sources

16.6 Data validation

16.7 Validation techniques employed for market sizing

16.8 Data synthesis

16.9 360 degree market analysis

16.10 List of abbreviations

Research Methodology

Technavio presents a detailed picture of the market by way of study, synthesis, and summation of data from multiple sources. The analysts have presented the various facets of the market with a particular focus on identifying the key industry influencers. The data thus presented is comprehensive, reliable, and the result of extensive research, both primary and secondary.

INFORMATION SOURCES

Primary sources

  • Manufacturers and suppliers
  • Channel partners
  • Industry experts
  • Strategic decision makers

Secondary sources

  • Industry journals and periodicals
  • Government data
  • Financial reports of key industry players
  • Historical data
  • Press releases

DATA ANALYSIS

Data Synthesis

  • Collation of data
  • Estimation of key figures
  • Analysis of derived insights

Data Validation

  • Triangulation with data models
  • Reference against proprietary databases
  • Corroboration with industry experts

REPORT WRITING

Qualitative

  • Market drivers
  • Market challenges
  • Market trends
  • Five forces analysis

Quantitative

  • Market size and forecast
  • Market segmentation
  • Geographical insights
  • Competitive landscape

Interested in this report?

Get your sample now to see our research methodology and insights!

Download Now

Frequently Asked Questions

Digital Video Advertising market growth will increase by USD 449616.3 million during 2026-2030.

The Digital Video Advertising market is expected to grow at a CAGR of 30% during 2026-2030.

Digital Video Advertising market is segmented by End-user (Retail, Consumer goods and electronics, Media and entertainment, Automotive, Others) Type (Desktop, Mobile) Service type (In-stream video ads, Out-stream video ads, Linear video ads, Nonlinear video ads, Others)

Amazon.com Inc., Aniview Ltd., Equativ, Google LLC, Index Exchange Inc., Launch Ad, Meta Platforms Inc., Microsoft Corp., Nexxen Inc., OpenX Technologies Inc., Pinterest Inc., Reddit Inc., Snap Inc., Spotify Technology SA, Teads Holding Co., The Trade Desk Inc., Tik Tok, Vidoomy Media S.L., Virool Inc. are a few of the key vendors in the Digital Video Advertising market.

North America will register the highest growth rate of 45% among the other regions. Therefore, the Digital Video Advertising market in North America is expected to garner significant business opportunities for the vendors during the forecast period.

US, Canada, Mexico, China, Japan, India, South Korea, Australia, Indonesia, UK, Germany, France, Italy, Spain, The Netherlands, Brazil, Argentina, Chile, UAE, Saudi Arabia, South Africa, Nigeria, Egypt

  • Proliferation of connected television and streaming ecosystems is the driving factor this market.

The Digital Video Advertising market vendors should focus on grabbing business opportunities from the End-user segment as it accounted for the largest market share in the base year.
RIA - Research AI Assistant
Ask RIA
