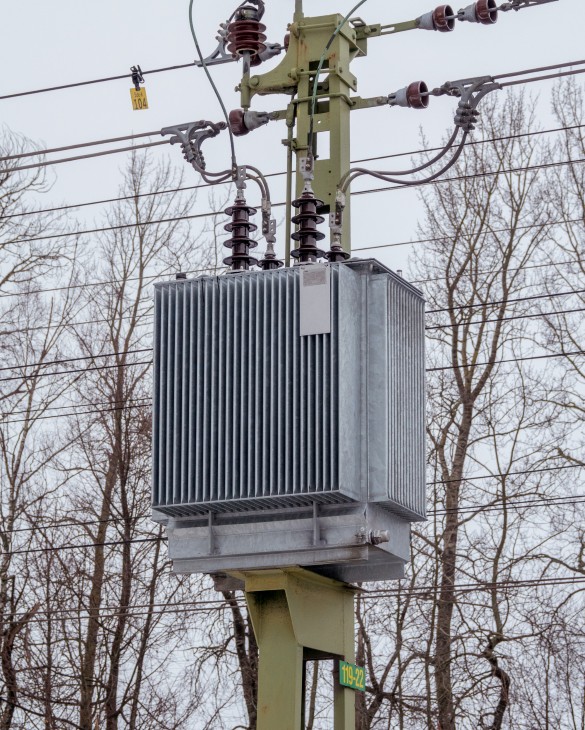
Double Winding Transformer Market Analysis, Size, and Forecast 2026-2030: APAC (China, India, and Japan), North America (US, Canada, and Mexico), Europe (Germany, France, and Italy), Middle East and Africa (Saudi Arabia, South Africa, and Turkey), South America (Brazil, Argentina, and Colombia), and Rest of World (ROW)

Double Winding Transformer Market Analysis, Size, and Forecast 2026-2030:
APAC (China, India, and Japan), North America (US, Canada, and Mexico), Europe (Germany, France, and Italy), Middle East and Africa (Saudi Arabia, South Africa, and Turkey), South America (Brazil, Argentina, and Colombia), and Rest of World (ROW)

Published: Oct 2026 298 Pages SKU: IRTNTR81638

Market Overview at a Glance

$9.69 B
Market Opportunity
7.3%
CAGR 2025 - 2030
43.7%
APAC Growth
$14.75 B
Three-phase segment 2024

Double Winding Transformer Market Size 2026-2030

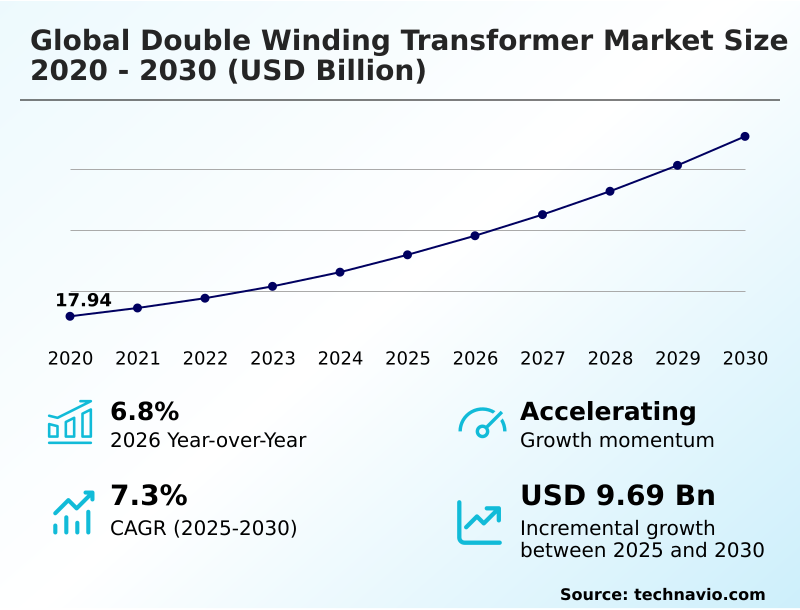
The double winding transformer market size is valued to increase by USD 9.69 billion, at a CAGR of 7.3% from 2025 to 2030. Rapid expansion of renewable energy integration and grid modernization initiatives will drive the double winding transformer market.

Major Market Trends & Insights

  • APAC dominated the market and accounted for a 43.7% growth during the forecast period.
  • By Type - Three-phase segment was valued at USD 14.75 billion in 2024
  • By Capacity - Medium segment accounted for the largest market revenue share in 2024

Market Size & Forecast

  • Market Opportunities: USD 14.72 billion
  • Market Future Opportunities: USD 9.69 billion
  • CAGR from 2025 to 2030 : 7.3%

Market Summary

  • The Double Winding Transformer Market demonstrates consistent structural expansion as electrical grid architectures transition toward decentralized generation and high-capacity transmission. Utility operators continually optimize supply chain procurement by standardizing equipment specifications, ensuring streamlined installations across massive urban networks.
  • Advanced core designs have successfully lowered no-load energy losses by 20% compared to legacy installations, yielding substantial long-term cost reductions for heavy industrial consumers. The aggressive integration of renewable energy sources acts as a primary growth driver, necessitating robust step-up devices to transmit variable solar and wind power efficiently to distant metropolitan hubs.
  • Conversely, severe price volatility in specialized electrical-grade steel and copper presents a persistent structural challenge, inflating initial capital expenditure for extensive rural electrification projects. Stringent environmental regulations further compel facility managers to phase out traditional mineral oil in favor of biodegradable dielectric fluids.
  • Consequently, modern infrastructure developments rely heavily on highly efficient, digital-ready equipment to maintain power quality and minimize unanticipated downtime across complex utility networks.

What will be the Size of the Double Winding Transformer Market during the forecast period?
Get Key Insights on Market Forecast (PDF) Get Free Sample

How is the Double Winding Transformer Market Segmented?

The double winding transformer industry research report provides comprehensive data (region-wise segment analysis), with forecasts and estimates in "USD million" for the period 2026-2030, as well as historical data from 2020-2024 for the following segments.

  • Type
    • Three-phase
    • Single-phase
  • Capacity
    • Medium
    • Large
    • Small
  • Product
    • Oil-cooled
    • Dry-type
    • Air-cooled
  • Geography
    • APAC
      • China
      • India
      • Japan
      • South Korea
      • Australia
      • Indonesia
    • North America
      • US
      • Canada
      • Mexico
    • Europe
      • Germany
      • France
      • Italy
      • UK
      • Spain
      • The Netherlands
    • Middle East and Africa
      • Saudi Arabia
      • South Africa
      • Turkey
      • UAE
      • Israel
    • South America
      • Brazil
      • Argentina
      • Colombia

By Type Insights

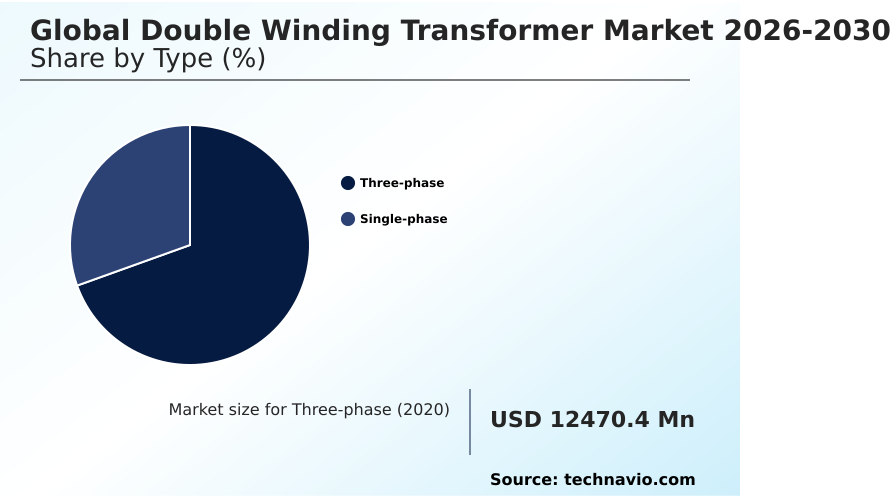
The three-phase segment is estimated to witness significant growth during the forecast period.

Three-phase units operate by utilizing electromagnetic induction to transfer energy efficiently across complex networks. A balanced configuration minimizes current imbalances and optimizes magnetic flux across primary winding coils, reducing long-distance transmission losses.

The structural integration of advanced secondary voltage regulation allows industrial facilities to handle high power capacities while ensuring complete galvanic isolation between circuits. Recent structural upgrades have improved baseline energy efficiency by 15%, significantly decreasing operational overhead for municipal utilities.

This precise voltage stepping supports robust industrial power distribution by shielding sensitive downstream equipment from transient surges. Reliable performance ensures robust power outage prevention across high-density computing centers and manufacturing plants.

Consequently, high-capacity three-phase systems maintain uninterrupted power stability, directly lowering lifecycle maintenance costs and stabilizing complex electrical loads.
Get Free Sample

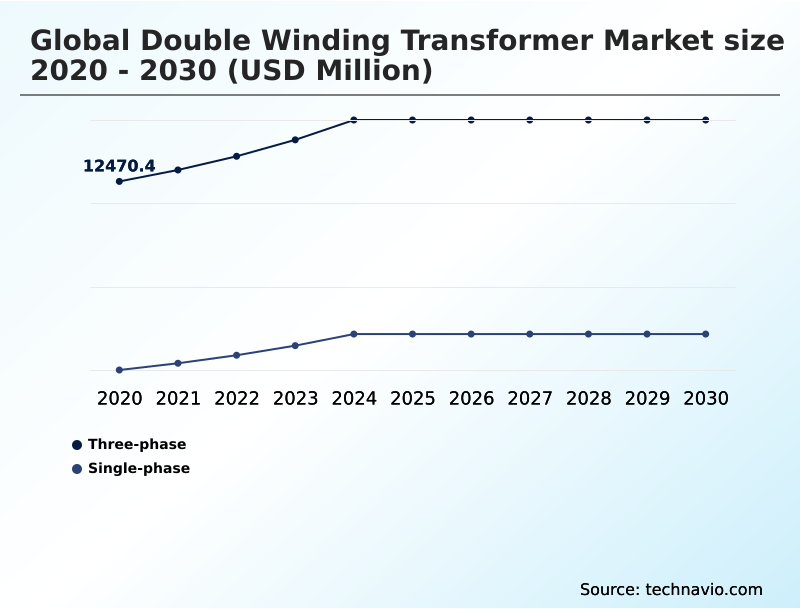
The Three-phase segment was valued at USD 14.75 billion in 2024 and showed a gradual increase during the forecast period.
Get Free Sample

Regional Analysis

APAC is estimated to contribute 43.7% to the growth of the global market during the forecast period.Technavio’s analysts have elaborately explained the regional trends and drivers that shape the market during the forecast period.
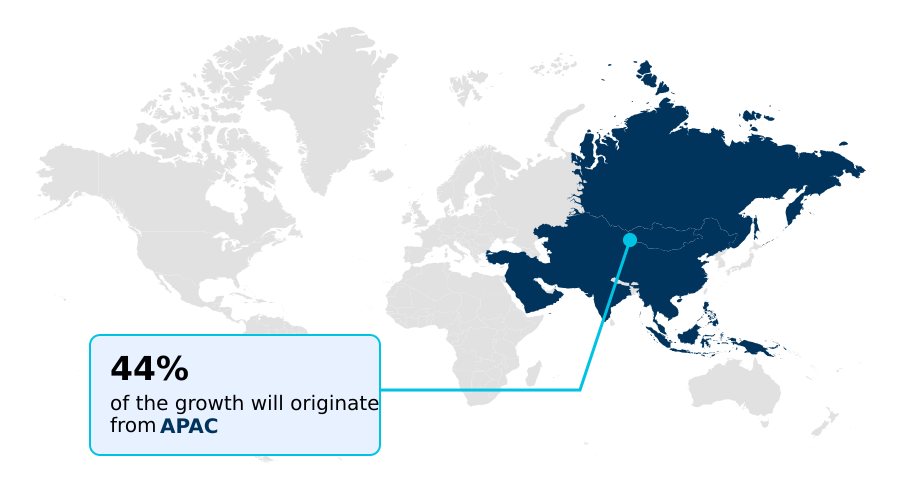
See How Double Winding Transformer Market Demand is Rising in APAC Get Free Sample

The geographic distribution of Double Winding Transformer adoption reveals stark structural differences driven by distinct regional policies and industrial footprints.

APAC dominates widespread expansion, driven by aggressive rural electrification initiatives and heavy manufacturing plants, resulting in a 35% higher baseline procurement volume compared to mature Western networks.

In contrast, North America focuses heavily on urban load centers and battery energy storage integration, achieving a 20% improvement in grid resilience programs by prioritizing the replacement of aged substation infrastructure.

APAC relies on massive state-funded capacity buildouts utilizing traditional forced-oil cooling mechanisms, while North American utilities increasingly mandate advanced cast resin formulation, solid insulation systems, and epoxy resin encapsulation to meet stringent fire safety standards.

This regional divergence highlights how varying capital availability and environmental directives force manufacturers to adapt product portfolios, balancing raw high-capacity power requirements against sophisticated, highly efficient dielectric insulation strength capabilities.

Market Dynamics

Our researchers analyzed the data with 2025 as the base year, along with the key drivers, trends, and challenges. A holistic analysis of drivers will help companies refine their marketing strategies to gain a competitive advantage.

  • The continuous evolution of energy infrastructure places immense operational pressure on utility operators to ensure resilient, uninterrupted power delivery across variable consumption nodes. As decentralized generation projects multiply, successful high voltage transmission network integration has become essential for balancing intermittent energy loads across complex regional grids.
  • Utility companies report a 25% increase in operational reliability when deploying advanced monitoring frameworks, significantly outperforming traditional reactive maintenance protocols. The aggressive transition toward sustainable liquid insulation fluid adoption minimizes environmental liabilities while providing superior fire resistance in densely populated commercial districts. Concurrently, manufacturing facilities and chemical processing plants require specialized hardware to mitigate severe voltage fluctuations.
  • Implementing targeted industrial heavy machinery power stabilization effectively shields sensitive downstream equipment, reducing sudden production line failures and protecting capital-intensive robotic assets. Modern facility managers increasingly utilize smart grid digital twin telemetry to simulate thermal stresses and optimize load distributions dynamically. This predictive analytical capability yields a 15% reduction in lifecycle maintenance costs compared to conventional physical inspection methods.
  • By leveraging comprehensive digital modeling and eco-friendly dielectric mediums, stakeholders can proactively address strict regulatory mandates while optimizing capital expenditures. These structural advancements underscore a permanent shift toward intelligent, low-loss electrical hardware capable of sustaining heavy, continuous energy demands in demanding industrial environments.
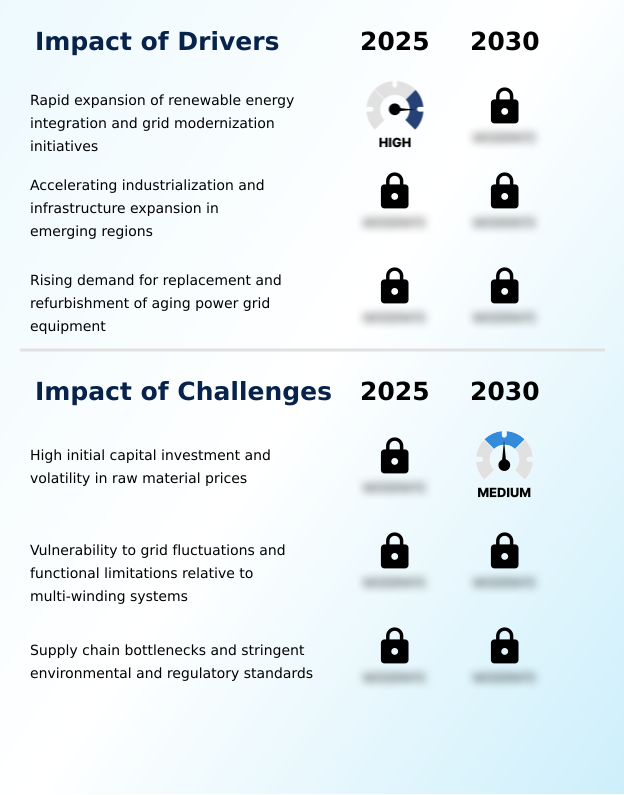
What are the key market drivers leading to the rise in the adoption of Double Winding Transformer Industry?

  • The rapid expansion of renewable energy integration and systematic grid modernization initiatives serves as the primary catalyst propelling market demand globally.

  • The accelerated deployment of distributed energy resources serves as the primary structural driver propelling demand for high-capacity voltage transformation hardware.
  • Rapid utility-scale solar arrays expansion and massive offshore wind farms necessitate robust step-up voltage conversion to transmit generated power efficiently over long distances.
  • The implementation of high-voltage direct current interconnections reduces long-distance power transmission losses by 12%, directly optimizing utility revenue streams. Furthermore, ongoing substation modernization initiatives compel regional grid operators to upgrade aging infrastructure, improving overall network resilience by 25%.
  • This systemic push for renewable energy integration ensures that facilities can seamlessly handle fluctuating power inputs. Consequently, the need to maintain stable, efficient power corridors under varying environmental conditions secures sustained, long-term procurement of highly durable electrical distribution equipment.

What are the market trends shaping the Double Winding Transformer Industry?

  • The integration of smart sensing, Internet of Things monitoring, and digital twin technologies represents a defining market trend. These advancements enable predictive maintenance and real-time thermal analysis, significantly extending operational lifespans and grid reliability.

  • Modern smart grid digitalization relies heavily on the rapid adoption of digital monitoring and eco-friendly insulation technologies to maximize asset longevity. The integration of predictive diagnostic monitoring and dissolved gas analysis allows utility operators to detect micro-arcing early, improving overall equipment uptime by 30%.
  • Concurrently, stringent environmental policies act as a primary catalyst, driving the widespread transition toward synthetic ester fluids and biodegradable natural esters. This chemical shift effectively lowers fire risks in densely populated areas, reducing infrastructure insurance premiums by 15%.
  • Furthermore, rapid hyperscale data centers expansion necessitates highly reliable fire safety compliance measures, making advanced mineral oil replacement strategies essential for continuous computing operations. By eliminating hazardous liquid leakage risks, commercial facility managers significantly decrease environmental remediation liabilities while ensuring stable, high-capacity power delivery across critical operational networks.

What challenges does the Double Winding Transformer Industry face during its growth?

  • High initial capital investment requirements coupled with severe volatility in core raw material prices present significant structural challenges restricting rapid industry expansion.

  • Severe price volatility in essential raw materials, particularly specialized grain-oriented electrical steel, presents a substantial operational limitation for equipment manufacturers globally. Material cost inflation forces a 15% increase in initial capital expenditure, significantly delaying procurement cycles for budget-constrained municipal utilities.
  • Furthermore, modern decentralized grids generate complex non-linear loads, creating acute demands for advanced harmonic distortion mitigation to prevent premature insulation failure. Facilities struggling with continuous thermal loads face an 18% higher risk of unexpected downtime if adequate thermal overload capacities fail under extreme ambient conditions.
  • Stringent decarbonization mandates also mandate expensive acoustic noise attenuation and robust seismic-resistant enclosures, elevating total manufacturing overhead. These structural compliance and material cost barriers complicate long-term strategic grid planning and constrain rapid infrastructure expansion across emerging regions.

Exclusive Technavio Analysis on Customer Landscape

The double winding transformer market forecasting report includes the adoption lifecycle of the market, covering from the innovator’s stage to the laggard’s stage. It focuses on adoption rates in different regions based on penetration. Furthermore, the double winding transformer market report also includes key purchase criteria and drivers of price sensitivity to help companies evaluate and develop their market growth analysis strategies.
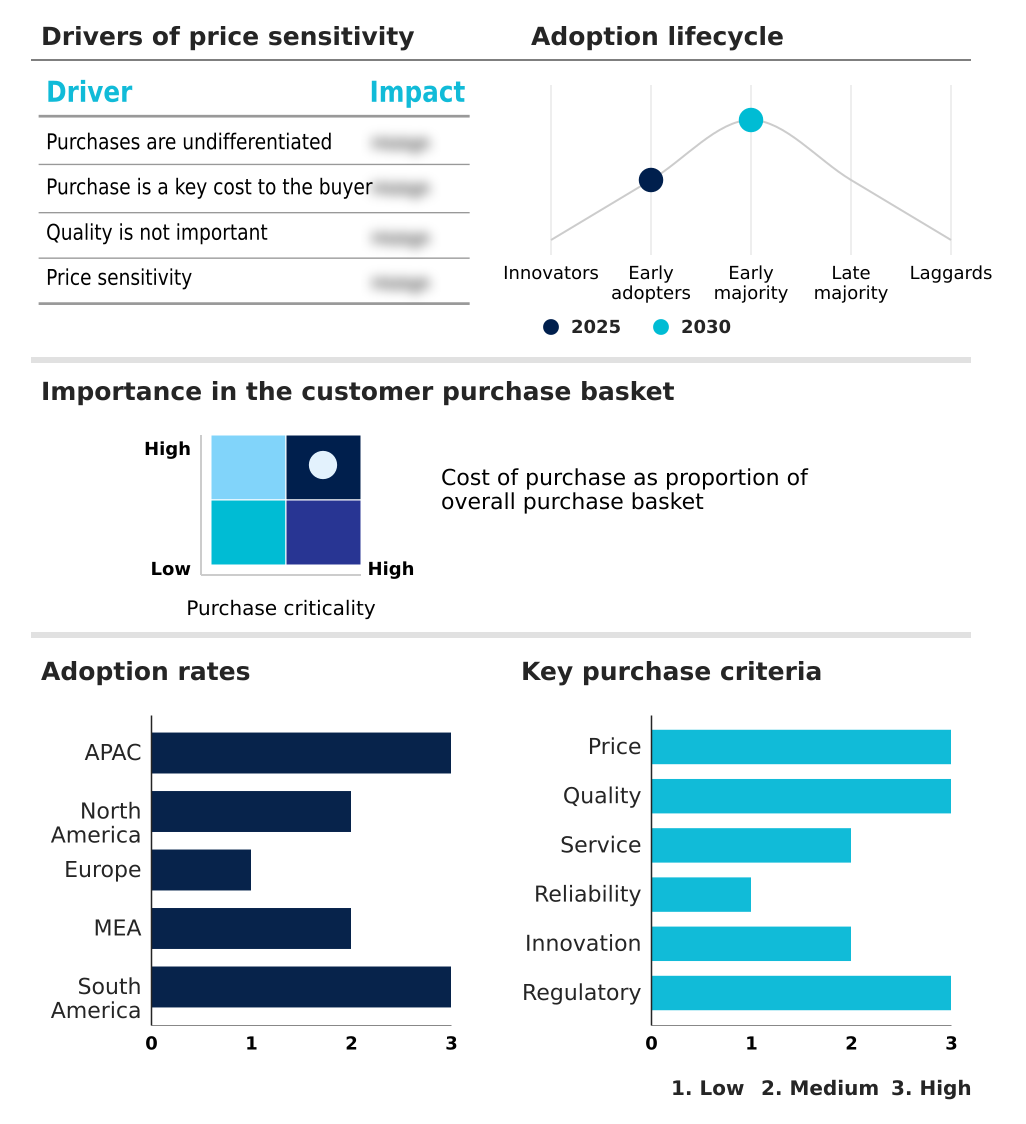
Customer Landscape of Double Winding Transformer Industry

Competitive Landscape

Companies are implementing various strategies, such as strategic alliances, double winding transformer market forecast, partnerships, mergers and acquisitions, geographical expansion, and product/service launches, to enhance their presence in the industry.

ABB Ltd. - The vendor provides advanced dry-type and liquid-filled electrical isolation devices configured for optimal step-down distribution, ensuring reliable power stepping and resilient energy management across complex utility networks.

The industry research and growth report includes detailed analyses of the competitive landscape of the market and information about key companies, including:

  • ABB Ltd.
  • Bharat Bijlee Ltd
  • Bharat Heavy Electricals Ltd.
  • CG Power and Industrial Ltd.
  • CHINT Group
  • Eaton Corp. Plc
  • Fuji Electric Co. Ltd.
  • GE Vernova Inc.
  • Hammond Power Inc.
  • Hyosung Heavy Industries Corp.
  • Kirloskar Electric Company
  • Meidensha Corp.
  • Mitsubishi Electric Corp.
  • Ormazabal
  • Prolec Energy
  • Schneider Electric SE
  • SGB-SMIT Group
  • Siemens Energy AG
  • Toshiba Corp.
  • WEG S.A

Qualitative and quantitative analysis of companies has been conducted to help clients understand the wider business environment as well as the strengths and weaknesses of key industry players. Data is qualitatively analyzed to categorize companies as pure play, category-focused, industry-focused, and diversified; it is quantitatively analyzed to categorize companies as dominant, leading, strong, tentative, and weak.

Recent Development and News in Double winding transformer market

  • In the Heavy Electrical Equipment industry, stringent European Ecodesign efficiency regulations have mandated a 10% reduction in baseline load losses, directly impacting Double Winding Transformer demand by forcing municipal utilities to accelerate the replacement of aging grid assets with compliant low-loss units.
  • The rapid global deployment of offshore wind farms has necessitated specialized marine-grade transmission architectures, increasing the procurement of step-up voltage hardware capable of withstanding corrosive environments while transferring generated power with 98% efficiency to onshore substations.
  • Widespread smart grid digitalization initiatives across major metropolitan utility networks have introduced dynamic monitoring requirements, driving a 15% increase in orders for distribution devices equipped with predictive maintenance sensors that prevent catastrophic insulation failures during peak demand cycles.
  • Rising raw material costs for specialized grain-oriented electrical steel have tightened manufacturing margins by 8%, compelling infrastructure developers to optimize industrial power distribution designs and adopt highly efficient compact configurations that minimize structural footprint without sacrificing thermal endurance.

Dive into Technavio’s robust research methodology, blending expert interviews, extensive data synthesis, and validated models for unparalleled Double Winding Transformer Market insights. See full methodology.

Market Scope
Page number 298
Base year 2025
Historic period 2020-2024
Forecast period 2026-2030
Growth momentum & CAGR Accelerate at a CAGR of 7.3%
Market growth 2026-2030 USD 9689.0 million
Market structure Fragmented
YoY growth 2025-2026(%) 6.8%
Key countries China, India, Japan, South Korea, Australia, Indonesia, US, Canada, Mexico, Germany, France, Italy, UK, Spain, The Netherlands, Saudi Arabia, South Africa, Turkey, UAE, Israel, Brazil, Argentina and Colombia
Competitive landscape Leading Companies, Market Positioning of Companies, Competitive Strategies, and Industry Risks

Request Free Sample

Research Analyst Overview

  • Executive boards overseeing global power utilities are actively restructuring procurement strategies to mandate the deployment of highly efficient Double Winding Transformer hardware. Strategic capital allocation now prioritizes equipment featuring advanced amorphous steel cores, which lower standby energy consumption by 22% compared to traditional silicon steel alternatives.
  • This verifiable reduction in no-load loss directly accelerates compliance with strict regional energy efficiency directives while optimizing long-term operational budgets. Modern grid architectures increasingly require dynamic bidirectional power flows, forcing infrastructure developers to specify advanced load tap changers that automatically regulate voltage during fluctuating renewable generation cycles.
  • Furthermore, the deployment of dry-type construction models in urban environments ensures superior fire safety without the need for extensive containment basins. Heavy industrial consumers also prioritize specialized short-circuit endurance capabilities to prevent catastrophic equipment failure during severe electrical grid surges.
  • By systematically upgrading legacy assets with low-loss components, commercial enterprises significantly improve facility resilience, minimize unexpected downtime, and secure sustainable, long-term power delivery across critical operations.

What are the Key Data Covered in this Double Winding Transformer Market Research and Growth Report?

  • What is the expected growth of the Double Winding Transformer Market between 2026 and 2030?

    • USD 9.69 billion, at a CAGR of 7.3%

  • What segmentation does the market report cover?

    • The report is segmented by Type (Three-phase, and Single-phase), Capacity (Medium, Large, and Small), Product (Oil-cooled, Dry-type, and Air-cooled) and Geography (APAC, North America, Europe, Middle East and Africa, South America)

  • Which regions are analyzed in the report?

    • APAC, North America, Europe, Middle East and Africa and South America

  • What are the key growth drivers and market challenges?

    • Rapid expansion of renewable energy integration and grid modernization initiatives, High initial capital investment and volatility in raw material prices

  • Who are the major players in the Double Winding Transformer Market?

    • ABB Ltd., Bharat Bijlee Ltd, Bharat Heavy Electricals Ltd., CG Power and Industrial Ltd., CHINT Group, Eaton Corp. Plc, Fuji Electric Co. Ltd., GE Vernova Inc., Hammond Power Inc., Hyosung Heavy Industries Corp., Kirloskar Electric Company, Meidensha Corp., Mitsubishi Electric Corp., Ormazabal, Prolec Energy, Schneider Electric SE, SGB-SMIT Group, Siemens Energy AG, Toshiba Corp. and WEG S.A

Market Research Insights

  • The Double Winding Transformer market is experiencing a profound technological shift driven by rapid substation modernization and continuous renewable energy integration. Grid operators upgrading legacy assets report a 25% improvement in operational lifespan by utilizing advanced sensor telemetry. Furthermore, the proactive implementation of predictive maintenance strategies has reduced unbudgeted utility downtime by 18%, significantly lowering emergency repair costs.
  • The widespread transition toward resilient microgrid architectures allows industrial facilities to isolate critical loads, achieving a 15% reduction in overall transmission losses. By optimizing these decentralized systems, energy providers effectively balance variable power generation while ensuring strict compliance with stringent international safety and reliability standards.

We can help! Our analysts can customize this double winding transformer market research report to meet your requirements.

Get in touch

1. Executive Summary

1.1 Market overview

Executive Summary - Chart on Market Overview
Executive Summary - Data Table on Market Overview
Executive Summary - Chart on Global Market Characteristics
Executive Summary - Chart on Market by Geography
Executive Summary - Chart on Market Segmentation by Type
Executive Summary - Chart on Market Segmentation by Capacity
Executive Summary - Chart on Market Segmentation by Product
Executive Summary - Chart on Incremental Growth
Executive Summary - Data Table on Incremental Growth
Executive Summary - Chart on Company Market Positioning

2. Technavio Analysis

2.1 Analysis of price sensitivity, lifecycle, customer purchase basket, adoption rates, and purchase criteria

2.2 Criticality of inputs and Factors of differentiation

Chart on Overview on criticality of inputs and factors of differentiation

2.3 Factors of disruption

Chart on Overview on factors of disruption

2.4 Impact of drivers and challenges

Chart on Impact of drivers and challenges in 2025 and 2030

3. Market Landscape

3.1 Market ecosystem

Chart on Parent Market
Data Table on - Parent Market

3.2 Market characteristics

Chart on Market characteristics analysis

3.3 Value chain analysis

Chart on Value chain analysis

4. Market Sizing

4.1 Market definition

Data Table on Offerings of companies included in the market definition

4.2 Market segment analysis

Market segments

4.3 Market size 2025

4.4 Market outlook: Forecast for 2025-2030

Chart on Global - Market size and forecast 2025-2030 ($ million)
Data Table on Global - Market size and forecast 2025-2030 ($ million)
Chart on Global Market: Year-over-year growth 2025-2030 (%)
Data Table on Global Market: Year-over-year growth 2025-2030 (%)

5. Historic Market Size

5.1 Global Double Winding Transformer Market 2020 - 2024

Historic Market Size - Data Table on Global Double Winding Transformer Market 2020 - 2024 ($ million)

5.2 Type segment analysis 2020 - 2024

Historic Market Size - Type Segment 2020 - 2024 ($ million)

5.3 Capacity segment analysis 2020 - 2024

Historic Market Size - Capacity Segment 2020 - 2024 ($ million)

5.4 Product segment analysis 2020 - 2024

Historic Market Size - Product Segment 2020 - 2024 ($ million)

5.5 Geography segment analysis 2020 - 2024

Historic Market Size - Geography Segment 2020 - 2024 ($ million)

5.6 Country segment analysis 2020 - 2024

Historic Market Size - Country Segment 2020 - 2024 ($ million)

6. Qualitative Analysis

6.1 Impact of AI on Global Double Winding Transformer Market

6.2 Impact of Geopolitical Conflicts on Global Double Winding Transformer Market

7. Five Forces Analysis

7.1 Five forces summary

Five forces analysis - Comparison between 2025 and 2030

7.2 Bargaining power of buyers

Bargaining power of buyers - Impact of key factors 2025 and 2030

7.3 Bargaining power of suppliers

Bargaining power of suppliers - Impact of key factors in 2025 and 2030

7.4 Threat of new entrants

Threat of new entrants - Impact of key factors in 2025 and 2030

7.5 Threat of substitutes

Threat of substitutes - Impact of key factors in 2025 and 2030

7.6 Threat of rivalry

Threat of rivalry - Impact of key factors in 2025 and 2030

7.7 Market condition

Chart on Market condition - Five forces 2025 and 2030

8. Market Segmentation by Type

8.1 Market segments

Chart on Type - Market share 2025-2030 (%)
Data Table on Type - Market share 2025-2030 (%)

8.2 Comparison by Type

Chart on Comparison by Type
Data Table on Comparison by Type

8.3 Three-phase - Market size and forecast 2025-2030

Chart on Three-phase - Market size and forecast 2025-2030 ($ million)
Data Table on Three-phase - Market size and forecast 2025-2030 ($ million)
Chart on Three-phase - Year-over-year growth 2025-2030 (%)
Data Table on Three-phase - Year-over-year growth 2025-2030 (%)

8.4 Single-phase - Market size and forecast 2025-2030

Chart on Single-phase - Market size and forecast 2025-2030 ($ million)
Data Table on Single-phase - Market size and forecast 2025-2030 ($ million)
Chart on Single-phase - Year-over-year growth 2025-2030 (%)
Data Table on Single-phase - Year-over-year growth 2025-2030 (%)

8.5 Market opportunity by Type

Market opportunity by Type ($ million)
Data Table on Market opportunity by Type ($ million)

9. Market Segmentation by Capacity

9.1 Market segments

Chart on Capacity - Market share 2025-2030 (%)
Data Table on Capacity - Market share 2025-2030 (%)

9.2 Comparison by Capacity

Chart on Comparison by Capacity
Data Table on Comparison by Capacity

9.3 Medium - Market size and forecast 2025-2030

Chart on Medium - Market size and forecast 2025-2030 ($ million)
Data Table on Medium - Market size and forecast 2025-2030 ($ million)
Chart on Medium - Year-over-year growth 2025-2030 (%)
Data Table on Medium - Year-over-year growth 2025-2030 (%)

9.4 Large - Market size and forecast 2025-2030

Chart on Large - Market size and forecast 2025-2030 ($ million)
Data Table on Large - Market size and forecast 2025-2030 ($ million)
Chart on Large - Year-over-year growth 2025-2030 (%)
Data Table on Large - Year-over-year growth 2025-2030 (%)

9.5 Small - Market size and forecast 2025-2030

Chart on Small - Market size and forecast 2025-2030 ($ million)
Data Table on Small - Market size and forecast 2025-2030 ($ million)
Chart on Small - Year-over-year growth 2025-2030 (%)
Data Table on Small - Year-over-year growth 2025-2030 (%)

9.6 Market opportunity by Capacity

Market opportunity by Capacity ($ million)
Data Table on Market opportunity by Capacity ($ million)

10. Market Segmentation by Product

10.1 Market segments

Chart on Product - Market share 2025-2030 (%)
Data Table on Product - Market share 2025-2030 (%)

10.2 Comparison by Product

Chart on Comparison by Product
Data Table on Comparison by Product

10.3 Oil-cooled - Market size and forecast 2025-2030

Chart on Oil-cooled - Market size and forecast 2025-2030 ($ million)
Data Table on Oil-cooled - Market size and forecast 2025-2030 ($ million)
Chart on Oil-cooled - Year-over-year growth 2025-2030 (%)
Data Table on Oil-cooled - Year-over-year growth 2025-2030 (%)

10.4 Dry-type - Market size and forecast 2025-2030

Chart on Dry-type - Market size and forecast 2025-2030 ($ million)
Data Table on Dry-type - Market size and forecast 2025-2030 ($ million)
Chart on Dry-type - Year-over-year growth 2025-2030 (%)
Data Table on Dry-type - Year-over-year growth 2025-2030 (%)

10.5 Air-cooled - Market size and forecast 2025-2030

Chart on Air-cooled - Market size and forecast 2025-2030 ($ million)
Data Table on Air-cooled - Market size and forecast 2025-2030 ($ million)
Chart on Air-cooled - Year-over-year growth 2025-2030 (%)
Data Table on Air-cooled - Year-over-year growth 2025-2030 (%)

10.6 Market opportunity by Product

Market opportunity by Product ($ million)
Data Table on Market opportunity by Product ($ million)

11. Customer Landscape

11.1 Customer landscape overview

Analysis of price sensitivity, lifecycle, customer purchase basket, adoption rates, and purchase criteria

12. Geographic Landscape

12.1 Geographic segmentation

Chart on Market share by geography 2025-2030 (%)
Data Table on Market share by geography 2025-2030 (%)

12.2 Geographic comparison

Chart on Geographic comparison
Data Table on Geographic comparison

12.3 APAC - Market size and forecast 2025-2030

Chart on APAC - Market size and forecast 2025-2030 ($ million)
Data Table on APAC - Market size and forecast 2025-2030 ($ million)
Chart on APAC - Year-over-year growth 2025-2030 (%)
Data Table on APAC - Year-over-year growth 2025-2030 (%)
Chart on Regional Comparison - APAC
Data Table on Regional Comparison - APAC

12.3.1 China - Market size and forecast 2025-2030

Chart on China - Market size and forecast 2025-2030 ($ million)
Data Table on China - Market size and forecast 2025-2030 ($ million)
Chart on China - Year-over-year growth 2025-2030 (%)
Data Table on China - Year-over-year growth 2025-2030 (%)

12.3.2 India - Market size and forecast 2025-2030

Chart on India - Market size and forecast 2025-2030 ($ million)
Data Table on India - Market size and forecast 2025-2030 ($ million)
Chart on India - Year-over-year growth 2025-2030 (%)
Data Table on India - Year-over-year growth 2025-2030 (%)

12.3.3 Japan - Market size and forecast 2025-2030

Chart on Japan - Market size and forecast 2025-2030 ($ million)
Data Table on Japan - Market size and forecast 2025-2030 ($ million)
Chart on Japan - Year-over-year growth 2025-2030 (%)
Data Table on Japan - Year-over-year growth 2025-2030 (%)

12.3.4 South Korea - Market size and forecast 2025-2030

Chart on South Korea - Market size and forecast 2025-2030 ($ million)
Data Table on South Korea - Market size and forecast 2025-2030 ($ million)
Chart on South Korea - Year-over-year growth 2025-2030 (%)
Data Table on South Korea - Year-over-year growth 2025-2030 (%)

12.3.5 Australia - Market size and forecast 2025-2030

Chart on Australia - Market size and forecast 2025-2030 ($ million)
Data Table on Australia - Market size and forecast 2025-2030 ($ million)
Chart on Australia - Year-over-year growth 2025-2030 (%)
Data Table on Australia - Year-over-year growth 2025-2030 (%)

12.3.6 Indonesia - Market size and forecast 2025-2030

Chart on Indonesia - Market size and forecast 2025-2030 ($ million)
Data Table on Indonesia - Market size and forecast 2025-2030 ($ million)
Chart on Indonesia - Year-over-year growth 2025-2030 (%)
Data Table on Indonesia - Year-over-year growth 2025-2030 (%)

12.4 North America - Market size and forecast 2025-2030

Chart on North America - Market size and forecast 2025-2030 ($ million)
Data Table on North America - Market size and forecast 2025-2030 ($ million)
Chart on North America - Year-over-year growth 2025-2030 (%)
Data Table on North America - Year-over-year growth 2025-2030 (%)
Chart on Regional Comparison - North America
Data Table on Regional Comparison - North America

12.4.1 US - Market size and forecast 2025-2030

Chart on US - Market size and forecast 2025-2030 ($ million)
Data Table on US - Market size and forecast 2025-2030 ($ million)
Chart on US - Year-over-year growth 2025-2030 (%)
Data Table on US - Year-over-year growth 2025-2030 (%)

12.4.2 Canada - Market size and forecast 2025-2030

Chart on Canada - Market size and forecast 2025-2030 ($ million)
Data Table on Canada - Market size and forecast 2025-2030 ($ million)
Chart on Canada - Year-over-year growth 2025-2030 (%)
Data Table on Canada - Year-over-year growth 2025-2030 (%)

12.4.3 Mexico - Market size and forecast 2025-2030

Chart on Mexico - Market size and forecast 2025-2030 ($ million)
Data Table on Mexico - Market size and forecast 2025-2030 ($ million)
Chart on Mexico - Year-over-year growth 2025-2030 (%)
Data Table on Mexico - Year-over-year growth 2025-2030 (%)

12.5 Europe - Market size and forecast 2025-2030

Chart on Europe - Market size and forecast 2025-2030 ($ million)
Data Table on Europe - Market size and forecast 2025-2030 ($ million)
Chart on Europe - Year-over-year growth 2025-2030 (%)
Data Table on Europe - Year-over-year growth 2025-2030 (%)
Chart on Regional Comparison - Europe
Data Table on Regional Comparison - Europe

12.5.1 Germany - Market size and forecast 2025-2030

Chart on Germany - Market size and forecast 2025-2030 ($ million)
Data Table on Germany - Market size and forecast 2025-2030 ($ million)
Chart on Germany - Year-over-year growth 2025-2030 (%)
Data Table on Germany - Year-over-year growth 2025-2030 (%)

12.5.2 France - Market size and forecast 2025-2030

Chart on France - Market size and forecast 2025-2030 ($ million)
Data Table on France - Market size and forecast 2025-2030 ($ million)
Chart on France - Year-over-year growth 2025-2030 (%)
Data Table on France - Year-over-year growth 2025-2030 (%)

12.5.3 Italy - Market size and forecast 2025-2030

Chart on Italy - Market size and forecast 2025-2030 ($ million)
Data Table on Italy - Market size and forecast 2025-2030 ($ million)
Chart on Italy - Year-over-year growth 2025-2030 (%)
Data Table on Italy - Year-over-year growth 2025-2030 (%)

12.5.4 UK - Market size and forecast 2025-2030

Chart on UK - Market size and forecast 2025-2030 ($ million)
Data Table on UK - Market size and forecast 2025-2030 ($ million)
Chart on UK - Year-over-year growth 2025-2030 (%)
Data Table on UK - Year-over-year growth 2025-2030 (%)

12.5.5 Spain - Market size and forecast 2025-2030

Chart on Spain - Market size and forecast 2025-2030 ($ million)
Data Table on Spain - Market size and forecast 2025-2030 ($ million)
Chart on Spain - Year-over-year growth 2025-2030 (%)
Data Table on Spain - Year-over-year growth 2025-2030 (%)

12.5.6 The Netherlands - Market size and forecast 2025-2030

Chart on The Netherlands - Market size and forecast 2025-2030 ($ million)
Data Table on The Netherlands - Market size and forecast 2025-2030 ($ million)
Chart on The Netherlands - Year-over-year growth 2025-2030 (%)
Data Table on The Netherlands - Year-over-year growth 2025-2030 (%)

12.6 Middle East and Africa - Market size and forecast 2025-2030

Chart on Middle East and Africa - Market size and forecast 2025-2030 ($ million)
Data Table on Middle East and Africa - Market size and forecast 2025-2030 ($ million)
Chart on Middle East and Africa - Year-over-year growth 2025-2030 (%)
Data Table on Middle East and Africa - Year-over-year growth 2025-2030 (%)
Chart on Regional Comparison - Middle East and Africa
Data Table on Regional Comparison - Middle East and Africa

12.6.1 Saudi Arabia - Market size and forecast 2025-2030

Chart on Saudi Arabia - Market size and forecast 2025-2030 ($ million)
Data Table on Saudi Arabia - Market size and forecast 2025-2030 ($ million)
Chart on Saudi Arabia - Year-over-year growth 2025-2030 (%)
Data Table on Saudi Arabia - Year-over-year growth 2025-2030 (%)

12.6.2 South Africa - Market size and forecast 2025-2030

Chart on South Africa - Market size and forecast 2025-2030 ($ million)
Data Table on South Africa - Market size and forecast 2025-2030 ($ million)
Chart on South Africa - Year-over-year growth 2025-2030 (%)
Data Table on South Africa - Year-over-year growth 2025-2030 (%)

12.6.3 Turkey - Market size and forecast 2025-2030

Chart on Turkey - Market size and forecast 2025-2030 ($ million)
Data Table on Turkey - Market size and forecast 2025-2030 ($ million)
Chart on Turkey - Year-over-year growth 2025-2030 (%)
Data Table on Turkey - Year-over-year growth 2025-2030 (%)

12.6.4 UAE - Market size and forecast 2025-2030

Chart on UAE - Market size and forecast 2025-2030 ($ million)
Data Table on UAE - Market size and forecast 2025-2030 ($ million)
Chart on UAE - Year-over-year growth 2025-2030 (%)
Data Table on UAE - Year-over-year growth 2025-2030 (%)

12.6.5 Israel - Market size and forecast 2025-2030

Chart on Israel - Market size and forecast 2025-2030 ($ million)
Data Table on Israel - Market size and forecast 2025-2030 ($ million)
Chart on Israel - Year-over-year growth 2025-2030 (%)
Data Table on Israel - Year-over-year growth 2025-2030 (%)

12.7 South America - Market size and forecast 2025-2030

Chart on South America - Market size and forecast 2025-2030 ($ million)
Data Table on South America - Market size and forecast 2025-2030 ($ million)
Chart on South America - Year-over-year growth 2025-2030 (%)
Data Table on South America - Year-over-year growth 2025-2030 (%)
Chart on Regional Comparison - South America
Data Table on Regional Comparison - South America

12.7.1 Brazil - Market size and forecast 2025-2030

Chart on Brazil - Market size and forecast 2025-2030 ($ million)
Data Table on Brazil - Market size and forecast 2025-2030 ($ million)
Chart on Brazil - Year-over-year growth 2025-2030 (%)
Data Table on Brazil - Year-over-year growth 2025-2030 (%)

12.7.2 Argentina - Market size and forecast 2025-2030

Chart on Argentina - Market size and forecast 2025-2030 ($ million)
Data Table on Argentina - Market size and forecast 2025-2030 ($ million)
Chart on Argentina - Year-over-year growth 2025-2030 (%)
Data Table on Argentina - Year-over-year growth 2025-2030 (%)

12.7.3 Colombia - Market size and forecast 2025-2030

Chart on Colombia - Market size and forecast 2025-2030 ($ million)
Data Table on Colombia - Market size and forecast 2025-2030 ($ million)
Chart on Colombia - Year-over-year growth 2025-2030 (%)
Data Table on Colombia - Year-over-year growth 2025-2030 (%)

12.8 Market opportunity by geography

Market opportunity by geography ($ million)
Data Tables on Market opportunity by geography ($ million)

13. Drivers, Challenges, and Opportunity

13.1 Market drivers

Rapid expansion of renewable energy integration and grid modernization initiatives
Accelerating industrialization and infrastructure expansion in emerging regions
Rising demand for replacement and refurbishment of aging power grid equipment

13.2 Market challenges

High initial capital investment and volatility in raw material prices
Vulnerability to grid fluctuations and functional limitations relative to multi-winding systems
Supply chain bottlenecks and stringent environmental and regulatory standards

13.3 Impact of drivers and challenges

Impact of drivers and challenges in 2025 and 2030

13.4 Market opportunities

Integration of smart sensing, IoT Monitoring, and digital twin technologies
Shift toward sustainable liquid insulation and eco-friendly ester fluids
Surge in data center infrastructure expansion and high-density power distribution

14. Competitive Landscape

14.1 Overview

14.2

Overview on criticality of inputs and factors of differentiation

14.3 Landscape disruption

Overview on factors of disruption

14.4 Industry risks

Impact of key risks on business

15. Competitive Analysis

15.1 Companies profiled

Companies covered

15.2 Company ranking index

15.3 Market positioning of companies

Matrix on companies position and classification

15.4 ABB Ltd.

ABB Ltd. - Overview
ABB Ltd. - Business segments
ABB Ltd. - Key news
ABB Ltd. - Key offerings
ABB Ltd. - Segment focus
SWOT

15.5 Bharat Heavy Electricals Ltd.

Bharat Heavy Electricals Ltd. - Overview
Bharat Heavy Electricals Ltd. - Business segments
Bharat Heavy Electricals Ltd. - Key offerings
Bharat Heavy Electricals Ltd. - Segment focus
SWOT

15.6 CG Power and Industrial Ltd.

CG Power and Industrial Ltd. - Overview
CG Power and Industrial Ltd. - Business segments
CG Power and Industrial Ltd. - Key offerings
CG Power and Industrial Ltd. - Segment focus
SWOT

15.7 Eaton Corp. Plc

Eaton Corp. Plc - Overview
Eaton Corp. Plc - Business segments
Eaton Corp. Plc - Key news
Eaton Corp. Plc - Key offerings
Eaton Corp. Plc - Segment focus
SWOT

15.8 Fuji Electric Co. Ltd.

Fuji Electric Co. Ltd. - Overview
Fuji Electric Co. Ltd. - Business segments
Fuji Electric Co. Ltd. - Key offerings
Fuji Electric Co. Ltd. - Segment focus
SWOT

15.9 GE Vernova Inc.

GE Vernova Inc. - Overview
GE Vernova Inc. - Business segments
GE Vernova Inc. - Key offerings
GE Vernova Inc. - Segment focus
SWOT

15.10 Hammond Power Inc.

Hammond Power Inc. - Overview
Hammond Power Inc. - Product / Service
Hammond Power Inc. - Key offerings
SWOT

15.11 Hyosung Heavy Industries Corp.

Hyosung Heavy Industries Corp. - Overview
Hyosung Heavy Industries Corp. - Product / Service
Hyosung Heavy Industries Corp. - Key offerings
SWOT

15.12 Mitsubishi Electric Corp.

Mitsubishi Electric Corp. - Overview
Mitsubishi Electric Corp. - Business segments
Mitsubishi Electric Corp. - Key offerings
Mitsubishi Electric Corp. - Segment focus
SWOT

15.13 Ormazabal

Ormazabal - Overview
Ormazabal - Product / Service
Ormazabal - Key offerings
SWOT

15.14 Prolec Energy

Prolec Energy - Overview
Prolec Energy - Product / Service
Prolec Energy - Key offerings
SWOT

15.15 Schneider Electric SE

Schneider Electric SE - Overview
Schneider Electric SE - Business segments
Schneider Electric SE - Key news
Schneider Electric SE - Key offerings
Schneider Electric SE - Segment focus
SWOT

15.16 SGB-SMIT Group

SGB-SMIT Group - Overview
SGB-SMIT Group - Product / Service
SGB-SMIT Group - Key offerings
SWOT

15.17 Siemens Energy AG

Siemens Energy AG - Overview
Siemens Energy AG - Business segments
Siemens Energy AG - Key news
Siemens Energy AG - Key offerings
Siemens Energy AG - Segment focus
SWOT

15.18 WEG S.A

WEG S.A - Overview
WEG S.A - Business segments
WEG S.A - Key offerings
WEG S.A - Segment focus
SWOT

16. Appendix

16.1 Scope of the report

Market definition
Objectives
Notes and caveats

16.2 Inclusions and exclusions checklist

Inclusions checklist
Exclusions checklist

16.3 Currency conversion rates for US$

16.4 Research methodology

16.5 Data procurement

Information sources

16.6 Data validation

16.7 Validation techniques employed for market sizing

16.8 Data synthesis

16.9 360 degree market analysis

16.10 List of abbreviations

Research Methodology

Technavio presents a detailed picture of the market by way of study, synthesis, and summation of data from multiple sources. The analysts have presented the various facets of the market with a particular focus on identifying the key industry influencers. The data thus presented is comprehensive, reliable, and the result of extensive research, both primary and secondary.

INFORMATION SOURCES

Primary sources

  • Manufacturers and suppliers
  • Channel partners
  • Industry experts
  • Strategic decision makers

Secondary sources

  • Industry journals and periodicals
  • Government data
  • Financial reports of key industry players
  • Historical data
  • Press releases

DATA ANALYSIS

Data Synthesis

  • Collation of data
  • Estimation of key figures
  • Analysis of derived insights

Data Validation

  • Triangulation with data models
  • Reference against proprietary databases
  • Corroboration with industry experts

REPORT WRITING

Qualitative

  • Market drivers
  • Market challenges
  • Market trends
  • Five forces analysis

Quantitative

  • Market size and forecast
  • Market segmentation
  • Geographical insights
  • Competitive landscape

Interested in this report?

Get your sample now to see our research methodology and insights!

Download Now

Frequently Asked Questions

Double Winding Transformer market growth will increase by USD 9689.0 million during 2026-2030.

The Double Winding Transformer market is expected to grow at a CAGR of 7.3% during 2026-2030.

Double Winding Transformer market is segmented by Type (Three-phase, Single-phase) Capacity (Medium, Large, Small) Product (Oil-cooled, Dry-type, Air-cooled)

ABB Ltd., Bharat Bijlee Ltd, Bharat Heavy Electricals Ltd., CG Power and Industrial Ltd., CHINT Group, Eaton Corp. Plc, Fuji Electric Co. Ltd., GE Vernova Inc., Hammond Power Inc., Hyosung Heavy Industries Corp., Kirloskar Electric Company, Meidensha Corp., Mitsubishi Electric Corp., Ormazabal, Prolec Energy, Schneider Electric SE, SGB-SMIT Group, Siemens Energy AG, Toshiba Corp., WEG S.A are a few of the key vendors in the Double Winding Transformer market.

APAC will register the highest growth rate of 43.7% among the other regions. Therefore, the Double Winding Transformer market in APAC is expected to garner significant business opportunities for the vendors during the forecast period.

China, India, Japan, South Korea, Australia, Indonesia, US, Canada, Mexico, Germany, France, Italy, UK, Spain, The Netherlands, Saudi Arabia, South Africa, Turkey, UAE, Israel, Brazil, Argentina, Colombia

  • Rapid expansion of renewable energy integration and grid modernization initiatives is the driving factor this market.

The Double Winding Transformer market vendors should focus on grabbing business opportunities from the Type segment as it accounted for the largest market share in the base year.
RIA - Research AI Assistant
Ask RIA
