
E-textile Market Analysis, Size, and Forecast 2026-2030: North America (US, Canada, and Mexico), APAC (China, Japan, and India), Europe (Germany, UK, and France), South America (Brazil, Argentina, and Chile), Middle East and Africa (Saudi Arabia, UAE, and South Africa), and Rest of World (ROW)

E-textile Market Analysis, Size, and Forecast 2026-2030:
North America (US, Canada, and Mexico), APAC (China, Japan, and India), Europe (Germany, UK, and France), South America (Brazil, Argentina, and Chile), Middle East and Africa (Saudi Arabia, UAE, and South Africa), and Rest of World (ROW)

Published: Oct 2026 325 Pages SKU: IRTNTR43384

Market Overview at a Glance

$14.81 B
Market Opportunity
19.5%
CAGR 2025 - 2030
39.1%
North America Growth
$4.98 B
Passive segment 2024

E-Textile Market Size 2026-2030

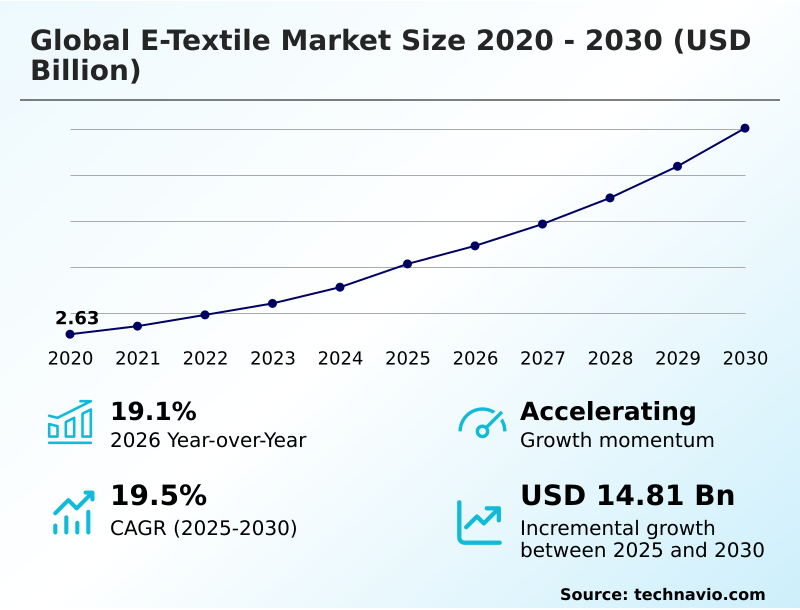
The e-textile market size is valued to increase by USD 14.81 billion, at a CAGR of 19.5% from 2025 to 2030. High demand for health-monitoring wearables will drive the e-textile market.

Major Market Trends & Insights

  • North America dominated the market and accounted for a 39.1% growth during the forecast period.
  • By Application - Passive segment was valued at USD 4.98 billion in 2024
  • By End-user - Military and defense segment accounted for the largest market revenue share in 2024

Market Size & Forecast

  • Market Opportunities: USD 22.48 billion
  • Market Future Opportunities: USD 14.81 billion
  • CAGR from 2025 to 2030 : 19.5%

Market Summary

  • The E-Textile Market is rapidly transitioning from niche applications to mainstream commercial deployment, driven by the fusion of advanced material science and digital technology. Operations in the healthcare sector demonstrate this shift, where hospitals deploying connected monitoring garments have reduced routine physical checkup times by 24% compared to standard episodic care.
  • This surging demand for continuous physiological observation acts as a major market driver, as medical providers actively seek non-invasive tools to manage chronic conditions. However, the highly complex integration of rigid circuitry into washable fabrics presents a formidable challenge, resulting in elevated production expenses that delay broader consumer accessibility.
  • Advanced manufacturing hubs are aggressively addressing this limitation by refining printed electronics to withstand repeated mechanical stress. By combining textile engineering with real-time biometric analysis, businesses can unlock entirely new operational efficiencies. The continued refinement of nano-conductive materials ensures that smart garments will increasingly support high-performance industrial and medical environments globally.

What will be the Size of the E-Textile Market during the forecast period?
Get Key Insights on Market Forecast (PDF) Get Free Sample

How is the E-Textile Market Segmented?

The e-textile industry research report provides comprehensive data (region-wise segment analysis), with forecasts and estimates in "USD million" for the period 2026-2030, as well as historical data from 2020-2024 for the following segments.

  • Application
    • Passive
    • Active
  • End-user
    • Military and defense
    • Architecture
    • Sports and fitness
    • Transportation
    • Others
  • Technology
    • Thermostatic
    • Energy harvesting
    • Sensing
    • Luminescent
  • Type
    • Modern electronic devices
    • Classical electronic devices
  • Geography
    • North America
      • US
      • Canada
      • Mexico
    • APAC
      • China
      • Japan
      • India
      • South Korea
      • Australia
      • Indonesia
    • Europe
      • Germany
      • UK
      • France
      • Italy
      • Spain
      • The Netherlands
    • South America
      • Brazil
      • Argentina
      • Chile
    • Middle East and Africa
      • Saudi Arabia
      • UAE
      • South Africa
      • Israel
      • Turkey

By Application Insights

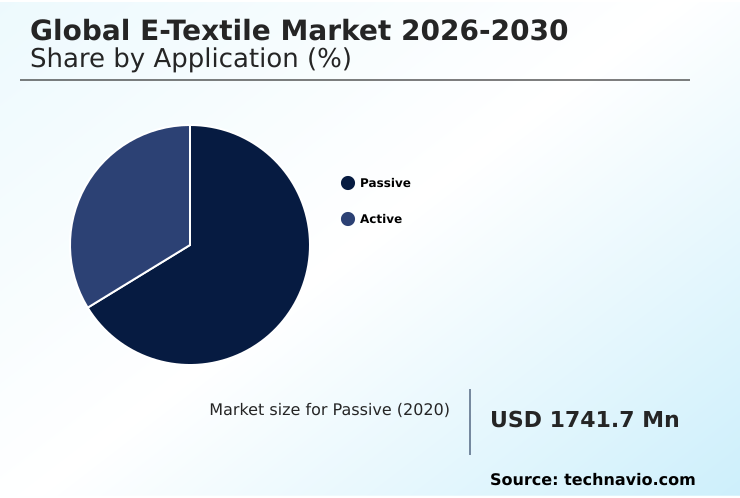
The passive segment is estimated to witness significant growth during the forecast period.

Passive e-textiles form a foundational category characterized by basic electronic functionality without active energy generation capabilities. This segment relies on integrated conductive fibers and resilient smart fabric architecture to enable simple signal transmission and surface illumination.

Because passive systems completely avoid complex embedded microcontrollers, manufacturers benefit from streamlined assembly processes, which have improved production defect rates by 18% compared to highly complex active counterparts.

These textiles see rapid adoption in occupational safety gear and extreme weather protection garments where durability is paramount. The streamlined supply chain scalability of passive smart materials allows industrial businesses to achieve highly cost-efficient deployment.

By reducing electronic component density, these specialized materials enhance hazardous environment safety while remaining exceptionally durable and highly wash-resistant over long lifecycles.
Get Free Sample

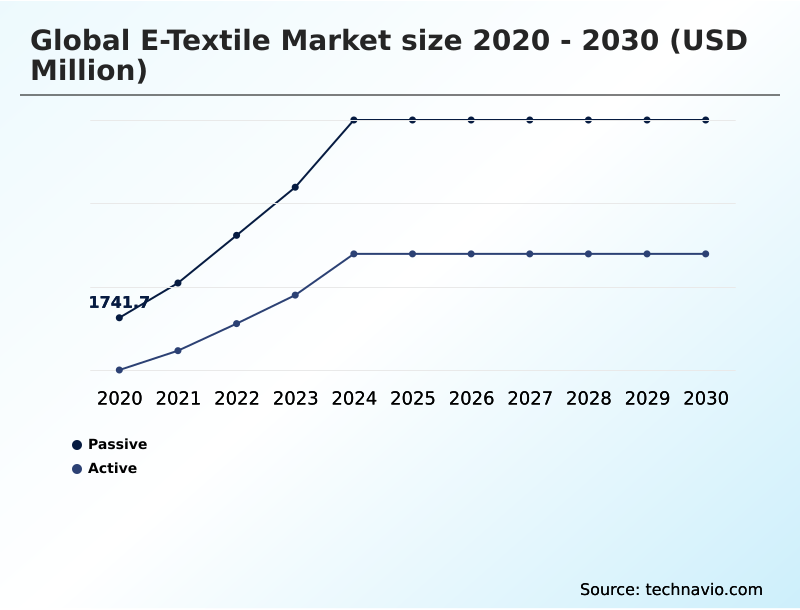
The Passive segment was valued at USD 4.98 billion in 2024 and showed a gradual increase during the forecast period.
Get Free Sample

Regional Analysis

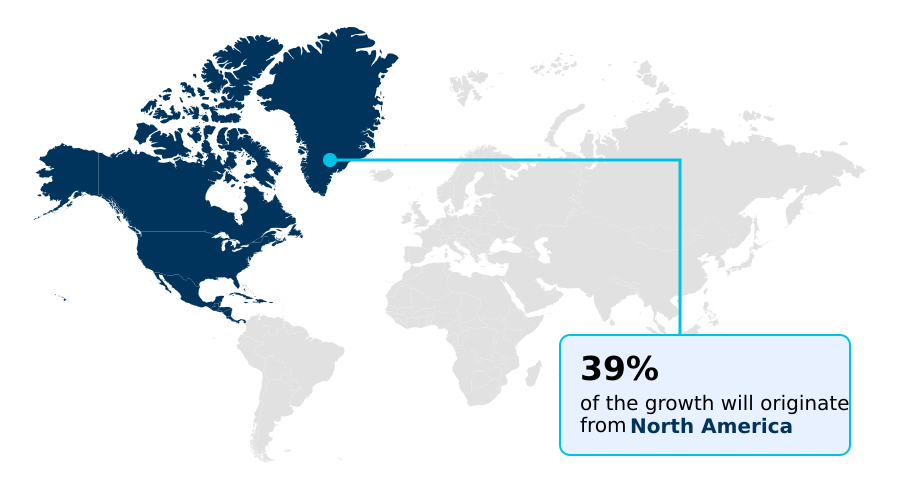
North America is estimated to contribute 39.1% to the growth of the global market during the forecast period.Technavio’s analysts have elaborately explained the regional trends and drivers that shape the market during the forecast period.
See How E-Textile Market Demand is Rising in North America Get Free Sample

Regional disparities in the E-Textile Market stem from varying technological infrastructure capabilities and specialized industry demands.

North America leads the adoption of remote patient observation systems, achieving a 32% faster deployment rate of real-time health data solutions compared to European averages.

This rapid integration is fueled by well-funded medical networks prioritizing preventive healthcare monitoring and chronic disease management. Conversely, the APAC region relies heavily on high-volume production capabilities, reducing manufacturing cycle times for miniaturized electronics by 18% against North American benchmarks.

These massive efficiency gains empower APAC suppliers to dominate the global mass production of conductive smart yarns. Meanwhile, European markets focus stringently on rigid data privacy standards, shifting supply chains toward localized, secure wearable integration.

By adapting to these distinct regional compliance structures, global enterprises can effectively optimize their sustainable smart clothing sourcing strategies.

Market Dynamics

Our researchers analyzed the data with 2025 as the base year, along with the key drivers, trends, and challenges. A holistic analysis of drivers will help companies refine their marketing strategies to gain a competitive advantage.

  • The E-Textile Market is witnessing profound transformations as diverse industries push the boundaries of functional fabrics. A primary catalyst for this shift is the deployment of continuous physiological monitoring smart garments, which have redefined patient care protocols by enabling non-intrusive, 24-hour observation.
  • Healthcare networks utilizing remote elderly patient healthcare tracking systems have recorded a 27% improvement in resource allocation efficiency compared to facilities relying solely on periodic on-site evaluations. This operational advantage stems directly from the ability to process continuous data streams without disrupting daily patient routines.
  • Similarly, the defense sector is advancing material capabilities through the development of energy-harvesting tactical military uniforms, designed to sustain critical communication equipment without heavy battery payloads. In the architectural space, the integration of temperature regulating adaptive building textiles is allowing commercial developers to reduce HVAC energy loads, aligning infrastructure projects with stringent environmental compliance mandates.
  • Additionally, professional sports organizations are heavily utilizing real-time biomechanical performance optimization to prevent injuries and tailor sophisticated athletic regimens. Managing the supply chain for these specialized materials requires precise operational alignment between electronic component vendors and traditional textile mills.
  • As the commercial demand for resilient, high-performance fabrics accelerates, manufacturers are forced to adapt their inventory and compliance planning to accommodate these complex, multi-disciplinary textile solutions.
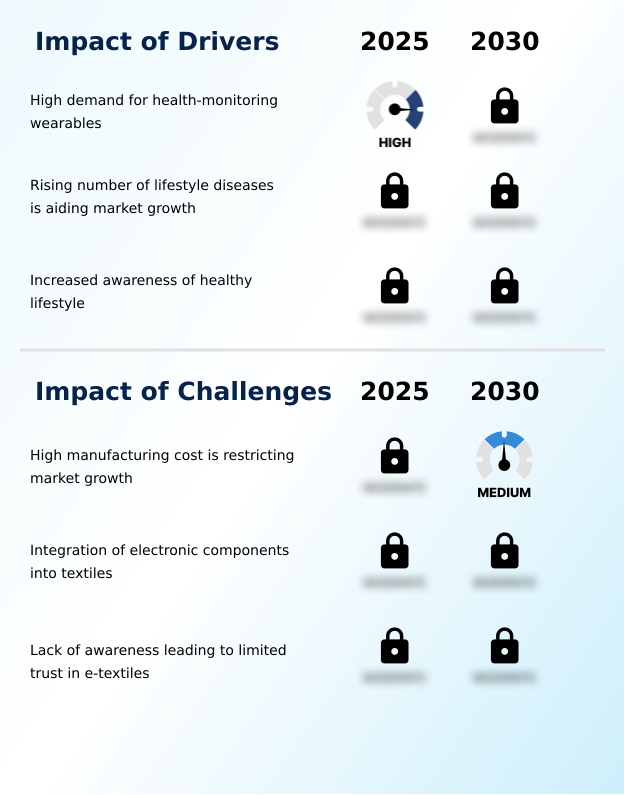
What are the key market drivers leading to the rise in the adoption of E-Textile Industry?

  • The high demand for health-monitoring wearables acts as a primary market driver by accelerating the widespread adoption of continuous physiological tracking solutions.

  • The pressing need for proactive medical and athletic intervention is fundamentally driving the E-Textile Market toward sophisticated biometric sensing. Medical facilities adopting physiological parameter sensing garments have decreased patient readmission rates by 19% through early anomaly detection.
  • This transition is caused by the rising demand for continuous physiological data tracking outside traditional clinical settings. Consequently, healthcare providers are integrating moisture-wicking smart fabrics to ensure patient comfort and hygiene during prolonged use.
  • Furthermore, professional athletic organizations utilizing biomechanical tracking apparel have increased training regimen accuracy by 15%, directly preventing costly strain injuries. These tangible operational benefits are amplified by instantaneous biometric feedback loops that facilitate rapid physical performance optimization.
  • By embedding seamless adaptive thermal regulation technology, developers empower users to enhance their athletic recovery tracking protocols and improve long-term physiological outcomes.

What are the market trends shaping the E-Textile Industry?

  • The increasing adoption of BLE technology and the miniaturization of electronic components represent a significant market trend. These advancements are transforming connectivity and comfort across advanced wearable applications.

  • The E-Textile Market is experiencing a rapid shift toward decentralized power solutions and seamless environmental connectivity. The adoption of Bluetooth Low Energy modules embedded directly into fabrics has improved continuous data transmission efficiency by 28% compared to earlier RFID systems. This technological leap enables highly responsive interactive wall coverings and dynamic smart vehicle interiors.
  • Manufacturers are increasingly utilizing printed electronics and flexible circuitry, leading production downtimes to drop by 14%. The integration of piezoelectric fibers and thermoelectric generators facilitates autonomous power generation, eliminating bulky batteries. Businesses deploying energy-harvesting textiles can capture essential metrics for structural health monitoring without burdening users.
  • The continuous evolution of nano-conductive materials ensures that these smart ecosystems support energy-efficient building materials and responsive shading systems. Ultimately, these advanced materials are forming the foundation of modern intelligent building environments.

What challenges does the E-Textile Industry face during its growth?

  • High manufacturing costs significantly restrict market expansion by limiting the scalable integration of complex electronic components into traditional fabrics.

  • The complex fusion of rigid technology with pliable materials creates severe production bottlenecks within the E-Textile Market. Transitioning wearable electronic integration systems into traditional textile looms increases baseline manufacturing defect rates by 23% when compared to standard automated fabric weaving. This inefficiency is caused by the inherent fragility of flexible power modules when exposed to high-heat lamination processes.
  • Consequently, brands struggle to achieve reliable washability enhancement, significantly limiting the lifespan of ergonomic wearable tech. Furthermore, maintaining consistent signal fidelity through stretchable electronics under intense physical strain remains highly difficult. Defense contractors face elevated research expenses as they attempt to reconcile conductive polymer coatings with the rugged durability required for soldier situational awareness and battlefield communication networks.
  • Overcoming these structural limitations requires significant investment in resilient assembly techniques.

Exclusive Technavio Analysis on Customer Landscape

The e-textile market forecasting report includes the adoption lifecycle of the market, covering from the innovator’s stage to the laggard’s stage. It focuses on adoption rates in different regions based on penetration. Furthermore, the e-textile market report also includes key purchase criteria and drivers of price sensitivity to help companies evaluate and develop their market growth analysis strategies.
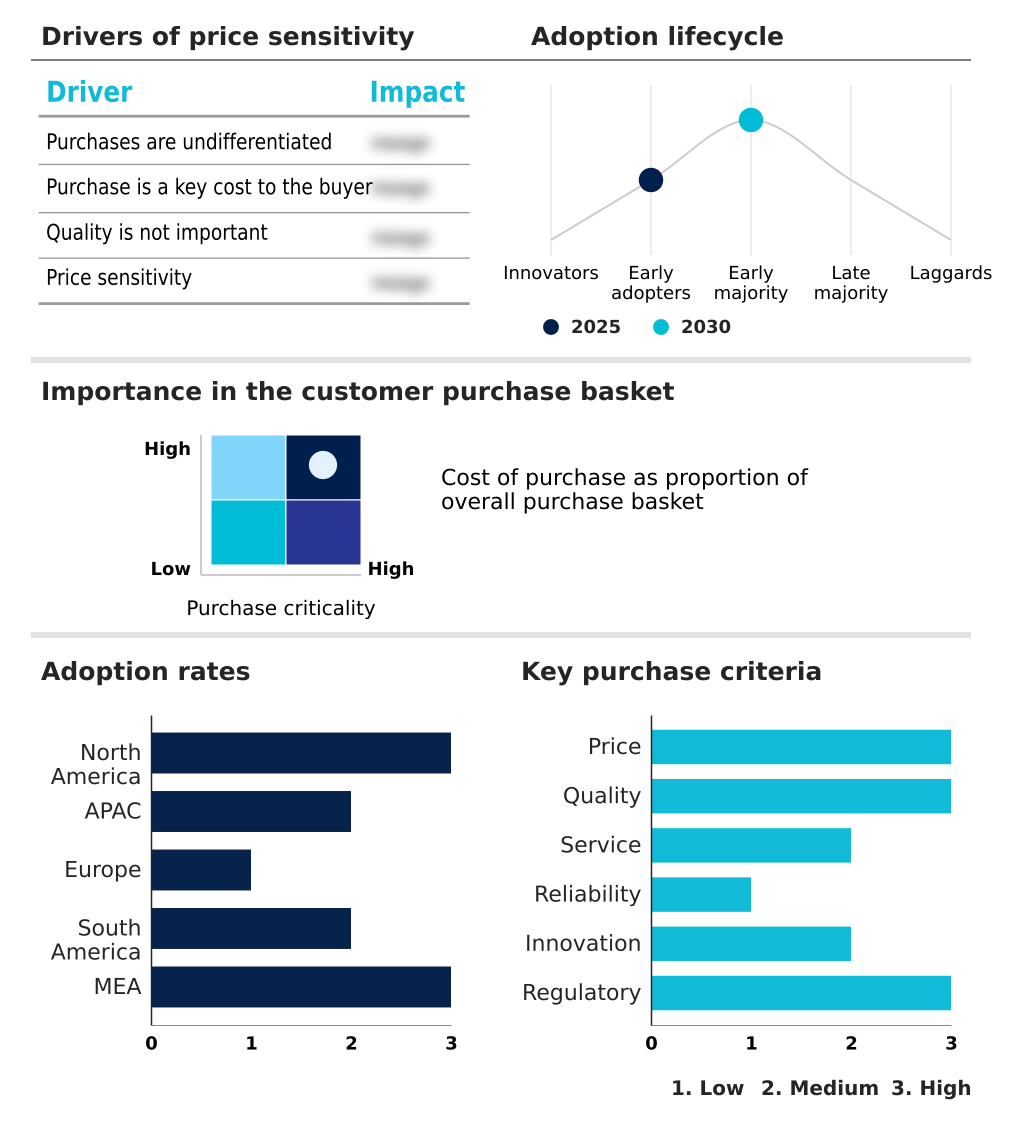
Customer Landscape of E-Textile Industry

Competitive Landscape

Companies are implementing various strategies, such as strategic alliances, e-textile market forecast, partnerships, mergers and acquisitions, geographical expansion, and product/service launches, to enhance their presence in the industry.

AiQ Smart Clothing Inc. - The offering focuses on seamlessly integrating advanced electronics with high-quality textiles to deliver functional, comfortable, and reliable smart clothing solutions for everyday wearable applications.

The industry research and growth report includes detailed analyses of the competitive landscape of the market and information about key companies, including:

  • AiQ Smart Clothing Inc.
  • Apex Mills
  • BAE Systems Plc
  • Bally Ribbon Mills
  • DuPont de Nemours Inc.
  • Embro Tech GmbH
  • Gentherm Inc.
  • Hexoskin
  • Interactive Wear AG
  • Jabil Inc.
  • LOOMIA
  • Mitsufuji Corp.
  • NV Bekaert SA
  • Ohmatex AS
  • Outlast Technologies GmbH
  • sanSirro GmbH
  • Schoeller Textil AG
  • Sensoria Inc.
  • Statex Produktions
  • Tex Ray Industrial Co. Ltd.
  • ThermoSoft International Corp.
  • Toray Industries Inc.
  • Vista Medical Ltd.
  • Vulpes Electronics GmbH
  • Xenoma Inc.

Qualitative and quantitative analysis of companies has been conducted to help clients understand the wider business environment as well as the strengths and weaknesses of key industry players. Data is qualitatively analyzed to categorize companies as pure play, category-focused, industry-focused, and diversified; it is quantitatively analyzed to categorize companies as dominant, leading, strong, tentative, and weak.

Recent Development and News in E-textile market

  • In the Textiles industry, the rapid deployment of automated fabric weaving technologies has reduced material waste by 14%, directly impacting E-textile production by lowering the baseline cost of integrating occupational safety gear components.
  • In the Textiles industry, strict environmental compliance mandates have forced a 22% shift toward sustainable smart clothing materials, accelerating E-textile demand for recyclable supply chain scalability solutions.
  • In the Textiles industry, disruptions in global synthetic fiber supply chains have increased localized sourcing by 19%, forcing E-textile manufacturers to adapt flexible power modules to maintain continuous data transmission standards.
  • In the Textiles industry, the rising demand for lightweight structural health monitoring fabrics in civil engineering has expanded high-tensile material production by 27%, enabling E-textile developers to create more durable energy-efficient building materials.

Dive into Technavio’s robust research methodology, blending expert interviews, extensive data synthesis, and validated models for unparalleled E-Textile Market insights. See full methodology.

Market Scope
Page number 325
Base year 2025
Historic period 2020-2024
Forecast period 2026-2030
Growth momentum & CAGR Accelerate at a CAGR of 19.5%
Market growth 2026-2030 USD 14807.6 million
Market structure Fragmented
YoY growth 2025-2026(%) 19.1%
Key countries US, Canada, Mexico, China, Japan, India, South Korea, Australia, Indonesia, Germany, UK, France, Italy, Spain, The Netherlands, Brazil, Argentina, Chile, Saudi Arabia, UAE, South Africa, Israel and Turkey
Competitive landscape Leading Companies, Market Positioning of Companies, Competitive Strategies, and Industry Risks

Request Free Sample

Research Analyst Overview

  • The E-Textile Market is undergoing a rapid evolution as the intersection of material science and digital technology creates highly functional, connected fabrics. Corporate leaders are increasingly integrating self-sustaining power fabrics into their strategic product roadmaps to bypass the limitations of traditional battery-powered wearables.
  • This shift toward autonomous power directly influences long-term budgeting decisions, as organizations adopting these advanced materials have documented a 22% reduction in maintenance and replacement costs compared to conventional electronic garments. The rigorous development of highly stretchable components ensures that garments maintain structural integrity during intense physical use.
  • Furthermore, the precise application of conductive coatings allows manufacturers to meet stringent washability standards without degrading electronic performance. By embedding thermal regulation elements into outdoor and industrial apparel, companies can offer highly adaptive clothing solutions.
  • This continuous refinement of smart yarn integration empowers modern boardrooms to deliver innovative, compliant, and highly durable textile products that cater to complex medical and industrial demands.

What are the Key Data Covered in this E-Textile Market Research and Growth Report?

  • What is the expected growth of the E-Textile Market between 2026 and 2030?

    • USD 14.81 billion, at a CAGR of 19.5%

  • What segmentation does the market report cover?

    • The report is segmented by Application (Passive, and Active), End-user (Military and defense, Architecture, Sports and fitness, Transportation, and Others), Technology (Thermostatic, Energy harvesting, Sensing, and Luminescent), Type (Modern electronic devices, and Classical electronic devices) and Geography (North America, APAC, Europe, South America, Middle East and Africa)

  • Which regions are analyzed in the report?

    • North America, APAC, Europe, South America and Middle East and Africa

  • What are the key growth drivers and market challenges?

    • High demand for health-monitoring wearables, High manufacturing cost is restricting market growth

  • Who are the major players in the E-Textile Market?

    • AiQ Smart Clothing Inc., Apex Mills, BAE Systems Plc, Bally Ribbon Mills, DuPont de Nemours Inc., Embro Tech GmbH, Gentherm Inc., Hexoskin, Interactive Wear AG, Jabil Inc., LOOMIA, Mitsufuji Corp., NV Bekaert SA, Ohmatex AS, Outlast Technologies GmbH, sanSirro GmbH, Schoeller Textil AG, Sensoria Inc., Statex Produktions, Tex Ray Industrial Co. Ltd., ThermoSoft International Corp., Toray Industries Inc., Vista Medical Ltd., Vulpes Electronics GmbH and Xenoma Inc.

Market Research Insights

  • The E-Textile Market bridges traditional apparel manufacturing with digital capabilities to deliver functional smart ecosystems. Healthcare providers utilizing specialized monitoring garments have improved diagnostic response times by 21% compared to standard episodic care. Furthermore, industrial facilities implementing hazard detection via connected apparel report a 15% reduction in workplace incident response delays.
  • These operational gains are supported by seamless feedback loops that enable rapid, automated data analysis. The integration of continuous transmission protocols directly into fabrics allows businesses to optimize physical recovery tracking without compromising user mobility. By leveraging sustainable material solutions, enterprises can effectively align with emerging environmental compliance standards while consistently delivering high-value connected garments to diverse consumer bases.

We can help! Our analysts can customize this e-textile market research report to meet your requirements.

Get in touch

1. Executive Summary

1.1 Market overview

Executive Summary - Chart on Market Overview
Executive Summary - Data Table on Market Overview
Executive Summary - Chart on Global Market Characteristics
Executive Summary - Chart on Market by Geography
Executive Summary - Chart on Market Segmentation by Application
Executive Summary - Chart on Market Segmentation by End-user
Executive Summary - Chart on Market Segmentation by Technology
Executive Summary - Chart on Market Segmentation by Type
Executive Summary - Chart on Incremental Growth
Executive Summary - Data Table on Incremental Growth
Executive Summary - Chart on Company Market Positioning

2. Technavio Analysis

2.1 Analysis of price sensitivity, lifecycle, customer purchase basket, adoption rates, and purchase criteria

2.2 Criticality of inputs and Factors of differentiation

Chart on Overview on criticality of inputs and factors of differentiation

2.3 Factors of disruption

Chart on Overview on factors of disruption

2.4 Impact of drivers and challenges

Chart on Impact of drivers and challenges in 2025 and 2030

3. Market Landscape

3.1 Market ecosystem

Chart on Parent Market
Data Table on - Parent Market

3.2 Market characteristics

Chart on Market characteristics analysis

3.3 Value chain analysis

Chart on Value chain analysis

4. Market Sizing

4.1 Market definition

Data Table on Offerings of companies included in the market definition

4.2 Market segment analysis

Market segments

4.3 Market size 2025

4.4 Market outlook: Forecast for 2025-2030

Chart on Global - Market size and forecast 2025-2030 ($ million)
Data Table on Global - Market size and forecast 2025-2030 ($ million)
Chart on Global Market: Year-over-year growth 2025-2030 (%)
Data Table on Global Market: Year-over-year growth 2025-2030 (%)

5. Historic Market Size

5.1 Global E-Textile Market 2020 - 2024

Historic Market Size - Data Table on Global E-Textile Market 2020 - 2024 ($ million)

5.2 Application segment analysis 2020 - 2024

Historic Market Size - Application Segment 2020 - 2024 ($ million)

5.3 End-user segment analysis 2020 - 2024

Historic Market Size - End-user Segment 2020 - 2024 ($ million)

5.4 Technology segment analysis 2020 - 2024

Historic Market Size - Technology Segment 2020 - 2024 ($ million)

5.5 Type segment analysis 2020 - 2024

Historic Market Size - Type Segment 2020 - 2024 ($ million)

5.6 Geography segment analysis 2020 - 2024

Historic Market Size - Geography Segment 2020 - 2024 ($ million)

5.7 Country segment analysis 2020 - 2024

Historic Market Size - Country Segment 2020 - 2024 ($ million)

6. Qualitative Analysis

6.1 Impact of AI on Global E-textile Market

6.2 Impact of Geopolitical Conflicts on Global E-textile Market

7. Five Forces Analysis

7.1 Five forces summary

Five forces analysis - Comparison between 2025 and 2030

7.2 Bargaining power of buyers

Bargaining power of buyers - Impact of key factors 2025 and 2030

7.3 Bargaining power of suppliers

Bargaining power of suppliers - Impact of key factors in 2025 and 2030

7.4 Threat of new entrants

Threat of new entrants - Impact of key factors in 2025 and 2030

7.5 Threat of substitutes

Threat of substitutes - Impact of key factors in 2025 and 2030

7.6 Threat of rivalry

Threat of rivalry - Impact of key factors in 2025 and 2030

7.7 Market condition

Chart on Market condition - Five forces 2025 and 2030

8. Market Segmentation by Application

8.1 Market segments

Chart on Application - Market share 2025-2030 (%)
Data Table on Application - Market share 2025-2030 (%)

8.2 Comparison by Application

Chart on Comparison by Application
Data Table on Comparison by Application

8.3 Passive - Market size and forecast 2025-2030

Chart on Passive - Market size and forecast 2025-2030 ($ million)
Data Table on Passive - Market size and forecast 2025-2030 ($ million)
Chart on Passive - Year-over-year growth 2025-2030 (%)
Data Table on Passive - Year-over-year growth 2025-2030 (%)

8.4 Active - Market size and forecast 2025-2030

Chart on Active - Market size and forecast 2025-2030 ($ million)
Data Table on Active - Market size and forecast 2025-2030 ($ million)
Chart on Active - Year-over-year growth 2025-2030 (%)
Data Table on Active - Year-over-year growth 2025-2030 (%)

8.5 Market opportunity by Application

Market opportunity by Application ($ million)
Data Table on Market opportunity by Application ($ million)

9. Market Segmentation by End-user

9.1 Market segments

Chart on End-user - Market share 2025-2030 (%)
Data Table on End-user - Market share 2025-2030 (%)

9.2 Comparison by End-user

Chart on Comparison by End-user
Data Table on Comparison by End-user

9.3 Military and defense - Market size and forecast 2025-2030

Chart on Military and defense - Market size and forecast 2025-2030 ($ million)
Data Table on Military and defense - Market size and forecast 2025-2030 ($ million)
Chart on Military and defense - Year-over-year growth 2025-2030 (%)
Data Table on Military and defense - Year-over-year growth 2025-2030 (%)

9.4 Architecture - Market size and forecast 2025-2030

Chart on Architecture - Market size and forecast 2025-2030 ($ million)
Data Table on Architecture - Market size and forecast 2025-2030 ($ million)
Chart on Architecture - Year-over-year growth 2025-2030 (%)
Data Table on Architecture - Year-over-year growth 2025-2030 (%)

9.5 Sports and fitness - Market size and forecast 2025-2030

Chart on Sports and fitness - Market size and forecast 2025-2030 ($ million)
Data Table on Sports and fitness - Market size and forecast 2025-2030 ($ million)
Chart on Sports and fitness - Year-over-year growth 2025-2030 (%)
Data Table on Sports and fitness - Year-over-year growth 2025-2030 (%)

9.6 Transportation - Market size and forecast 2025-2030

Chart on Transportation - Market size and forecast 2025-2030 ($ million)
Data Table on Transportation - Market size and forecast 2025-2030 ($ million)
Chart on Transportation - Year-over-year growth 2025-2030 (%)
Data Table on Transportation - Year-over-year growth 2025-2030 (%)

9.7 Others - Market size and forecast 2025-2030

Chart on Others - Market size and forecast 2025-2030 ($ million)
Data Table on Others - Market size and forecast 2025-2030 ($ million)
Chart on Others - Year-over-year growth 2025-2030 (%)
Data Table on Others - Year-over-year growth 2025-2030 (%)

9.8 Market opportunity by End-user

Market opportunity by End-user ($ million)
Data Table on Market opportunity by End-user ($ million)

10. Market Segmentation by Technology

10.1 Market segments

Chart on Technology - Market share 2025-2030 (%)
Data Table on Technology - Market share 2025-2030 (%)

10.2 Comparison by Technology

Chart on Comparison by Technology
Data Table on Comparison by Technology

10.3 Thermostatic - Market size and forecast 2025-2030

Chart on Thermostatic - Market size and forecast 2025-2030 ($ million)
Data Table on Thermostatic - Market size and forecast 2025-2030 ($ million)
Chart on Thermostatic - Year-over-year growth 2025-2030 (%)
Data Table on Thermostatic - Year-over-year growth 2025-2030 (%)

10.4 Energy harvesting - Market size and forecast 2025-2030

Chart on Energy harvesting - Market size and forecast 2025-2030 ($ million)
Data Table on Energy harvesting - Market size and forecast 2025-2030 ($ million)
Chart on Energy harvesting - Year-over-year growth 2025-2030 (%)
Data Table on Energy harvesting - Year-over-year growth 2025-2030 (%)

10.5 Sensing - Market size and forecast 2025-2030

Chart on Sensing - Market size and forecast 2025-2030 ($ million)
Data Table on Sensing - Market size and forecast 2025-2030 ($ million)
Chart on Sensing - Year-over-year growth 2025-2030 (%)
Data Table on Sensing - Year-over-year growth 2025-2030 (%)

10.6 Luminescent - Market size and forecast 2025-2030

Chart on Luminescent - Market size and forecast 2025-2030 ($ million)
Data Table on Luminescent - Market size and forecast 2025-2030 ($ million)
Chart on Luminescent - Year-over-year growth 2025-2030 (%)
Data Table on Luminescent - Year-over-year growth 2025-2030 (%)

10.7 Market opportunity by Technology

Market opportunity by Technology ($ million)
Data Table on Market opportunity by Technology ($ million)

11. Market Segmentation by Type

11.1 Market segments

Chart on Type - Market share 2025-2030 (%)
Data Table on Type - Market share 2025-2030 (%)

11.2 Comparison by Type

Chart on Comparison by Type
Data Table on Comparison by Type

11.3 Modern electronic devices - Market size and forecast 2025-2030

Chart on Modern electronic devices - Market size and forecast 2025-2030 ($ million)
Data Table on Modern electronic devices - Market size and forecast 2025-2030 ($ million)
Chart on Modern electronic devices - Year-over-year growth 2025-2030 (%)
Data Table on Modern electronic devices - Year-over-year growth 2025-2030 (%)

11.4 Classical electronic devices - Market size and forecast 2025-2030

Chart on Classical electronic devices - Market size and forecast 2025-2030 ($ million)
Data Table on Classical electronic devices - Market size and forecast 2025-2030 ($ million)
Chart on Classical electronic devices - Year-over-year growth 2025-2030 (%)
Data Table on Classical electronic devices - Year-over-year growth 2025-2030 (%)

11.5 Market opportunity by Type

Market opportunity by Type ($ million)
Data Table on Market opportunity by Type ($ million)

12. Customer Landscape

12.1 Customer landscape overview

Analysis of price sensitivity, lifecycle, customer purchase basket, adoption rates, and purchase criteria

13. Geographic Landscape

13.1 Geographic segmentation

Chart on Market share by geography 2025-2030 (%)
Data Table on Market share by geography 2025-2030 (%)

13.2 Geographic comparison

Chart on Geographic comparison
Data Table on Geographic comparison

13.3 North America - Market size and forecast 2025-2030

Chart on North America - Market size and forecast 2025-2030 ($ million)
Data Table on North America - Market size and forecast 2025-2030 ($ million)
Chart on North America - Year-over-year growth 2025-2030 (%)
Data Table on North America - Year-over-year growth 2025-2030 (%)
Chart on Regional Comparison - North America
Data Table on Regional Comparison - North America

13.3.1 US - Market size and forecast 2025-2030

Chart on US - Market size and forecast 2025-2030 ($ million)
Data Table on US - Market size and forecast 2025-2030 ($ million)
Chart on US - Year-over-year growth 2025-2030 (%)
Data Table on US - Year-over-year growth 2025-2030 (%)

13.3.2 Canada - Market size and forecast 2025-2030

Chart on Canada - Market size and forecast 2025-2030 ($ million)
Data Table on Canada - Market size and forecast 2025-2030 ($ million)
Chart on Canada - Year-over-year growth 2025-2030 (%)
Data Table on Canada - Year-over-year growth 2025-2030 (%)

13.3.3 Mexico - Market size and forecast 2025-2030

Chart on Mexico - Market size and forecast 2025-2030 ($ million)
Data Table on Mexico - Market size and forecast 2025-2030 ($ million)
Chart on Mexico - Year-over-year growth 2025-2030 (%)
Data Table on Mexico - Year-over-year growth 2025-2030 (%)

13.4 APAC - Market size and forecast 2025-2030

Chart on APAC - Market size and forecast 2025-2030 ($ million)
Data Table on APAC - Market size and forecast 2025-2030 ($ million)
Chart on APAC - Year-over-year growth 2025-2030 (%)
Data Table on APAC - Year-over-year growth 2025-2030 (%)
Chart on Regional Comparison - APAC
Data Table on Regional Comparison - APAC

13.4.1 China - Market size and forecast 2025-2030

Chart on China - Market size and forecast 2025-2030 ($ million)
Data Table on China - Market size and forecast 2025-2030 ($ million)
Chart on China - Year-over-year growth 2025-2030 (%)
Data Table on China - Year-over-year growth 2025-2030 (%)

13.4.2 Japan - Market size and forecast 2025-2030

Chart on Japan - Market size and forecast 2025-2030 ($ million)
Data Table on Japan - Market size and forecast 2025-2030 ($ million)
Chart on Japan - Year-over-year growth 2025-2030 (%)
Data Table on Japan - Year-over-year growth 2025-2030 (%)

13.4.3 India - Market size and forecast 2025-2030

Chart on India - Market size and forecast 2025-2030 ($ million)
Data Table on India - Market size and forecast 2025-2030 ($ million)
Chart on India - Year-over-year growth 2025-2030 (%)
Data Table on India - Year-over-year growth 2025-2030 (%)

13.4.4 South Korea - Market size and forecast 2025-2030

Chart on South Korea - Market size and forecast 2025-2030 ($ million)
Data Table on South Korea - Market size and forecast 2025-2030 ($ million)
Chart on South Korea - Year-over-year growth 2025-2030 (%)
Data Table on South Korea - Year-over-year growth 2025-2030 (%)

13.4.5 Australia - Market size and forecast 2025-2030

Chart on Australia - Market size and forecast 2025-2030 ($ million)
Data Table on Australia - Market size and forecast 2025-2030 ($ million)
Chart on Australia - Year-over-year growth 2025-2030 (%)
Data Table on Australia - Year-over-year growth 2025-2030 (%)

13.4.6 Indonesia - Market size and forecast 2025-2030

Chart on Indonesia - Market size and forecast 2025-2030 ($ million)
Data Table on Indonesia - Market size and forecast 2025-2030 ($ million)
Chart on Indonesia - Year-over-year growth 2025-2030 (%)
Data Table on Indonesia - Year-over-year growth 2025-2030 (%)

13.5 Europe - Market size and forecast 2025-2030

Chart on Europe - Market size and forecast 2025-2030 ($ million)
Data Table on Europe - Market size and forecast 2025-2030 ($ million)
Chart on Europe - Year-over-year growth 2025-2030 (%)
Data Table on Europe - Year-over-year growth 2025-2030 (%)
Chart on Regional Comparison - Europe
Data Table on Regional Comparison - Europe

13.5.1 Germany - Market size and forecast 2025-2030

Chart on Germany - Market size and forecast 2025-2030 ($ million)
Data Table on Germany - Market size and forecast 2025-2030 ($ million)
Chart on Germany - Year-over-year growth 2025-2030 (%)
Data Table on Germany - Year-over-year growth 2025-2030 (%)

13.5.2 UK - Market size and forecast 2025-2030

Chart on UK - Market size and forecast 2025-2030 ($ million)
Data Table on UK - Market size and forecast 2025-2030 ($ million)
Chart on UK - Year-over-year growth 2025-2030 (%)
Data Table on UK - Year-over-year growth 2025-2030 (%)

13.5.3 France - Market size and forecast 2025-2030

Chart on France - Market size and forecast 2025-2030 ($ million)
Data Table on France - Market size and forecast 2025-2030 ($ million)
Chart on France - Year-over-year growth 2025-2030 (%)
Data Table on France - Year-over-year growth 2025-2030 (%)

13.5.4 Italy - Market size and forecast 2025-2030

Chart on Italy - Market size and forecast 2025-2030 ($ million)
Data Table on Italy - Market size and forecast 2025-2030 ($ million)
Chart on Italy - Year-over-year growth 2025-2030 (%)
Data Table on Italy - Year-over-year growth 2025-2030 (%)

13.5.5 Spain - Market size and forecast 2025-2030

Chart on Spain - Market size and forecast 2025-2030 ($ million)
Data Table on Spain - Market size and forecast 2025-2030 ($ million)
Chart on Spain - Year-over-year growth 2025-2030 (%)
Data Table on Spain - Year-over-year growth 2025-2030 (%)

13.5.6 The Netherlands - Market size and forecast 2025-2030

Chart on The Netherlands - Market size and forecast 2025-2030 ($ million)
Data Table on The Netherlands - Market size and forecast 2025-2030 ($ million)
Chart on The Netherlands - Year-over-year growth 2025-2030 (%)
Data Table on The Netherlands - Year-over-year growth 2025-2030 (%)

13.6 South America - Market size and forecast 2025-2030

Chart on South America - Market size and forecast 2025-2030 ($ million)
Data Table on South America - Market size and forecast 2025-2030 ($ million)
Chart on South America - Year-over-year growth 2025-2030 (%)
Data Table on South America - Year-over-year growth 2025-2030 (%)
Chart on Regional Comparison - South America
Data Table on Regional Comparison - South America

13.6.1 Brazil - Market size and forecast 2025-2030

Chart on Brazil - Market size and forecast 2025-2030 ($ million)
Data Table on Brazil - Market size and forecast 2025-2030 ($ million)
Chart on Brazil - Year-over-year growth 2025-2030 (%)
Data Table on Brazil - Year-over-year growth 2025-2030 (%)

13.6.2 Argentina - Market size and forecast 2025-2030

Chart on Argentina - Market size and forecast 2025-2030 ($ million)
Data Table on Argentina - Market size and forecast 2025-2030 ($ million)
Chart on Argentina - Year-over-year growth 2025-2030 (%)
Data Table on Argentina - Year-over-year growth 2025-2030 (%)

13.6.3 Chile - Market size and forecast 2025-2030

Chart on Chile - Market size and forecast 2025-2030 ($ million)
Data Table on Chile - Market size and forecast 2025-2030 ($ million)
Chart on Chile - Year-over-year growth 2025-2030 (%)
Data Table on Chile - Year-over-year growth 2025-2030 (%)

13.7 Middle East and Africa - Market size and forecast 2025-2030

Chart on Middle East and Africa - Market size and forecast 2025-2030 ($ million)
Data Table on Middle East and Africa - Market size and forecast 2025-2030 ($ million)
Chart on Middle East and Africa - Year-over-year growth 2025-2030 (%)
Data Table on Middle East and Africa - Year-over-year growth 2025-2030 (%)
Chart on Regional Comparison - Middle East and Africa
Data Table on Regional Comparison - Middle East and Africa

13.7.1 Saudi Arabia - Market size and forecast 2025-2030

Chart on Saudi Arabia - Market size and forecast 2025-2030 ($ million)
Data Table on Saudi Arabia - Market size and forecast 2025-2030 ($ million)
Chart on Saudi Arabia - Year-over-year growth 2025-2030 (%)
Data Table on Saudi Arabia - Year-over-year growth 2025-2030 (%)

13.7.2 UAE - Market size and forecast 2025-2030

Chart on UAE - Market size and forecast 2025-2030 ($ million)
Data Table on UAE - Market size and forecast 2025-2030 ($ million)
Chart on UAE - Year-over-year growth 2025-2030 (%)
Data Table on UAE - Year-over-year growth 2025-2030 (%)

13.7.3 South Africa - Market size and forecast 2025-2030

Chart on South Africa - Market size and forecast 2025-2030 ($ million)
Data Table on South Africa - Market size and forecast 2025-2030 ($ million)
Chart on South Africa - Year-over-year growth 2025-2030 (%)
Data Table on South Africa - Year-over-year growth 2025-2030 (%)

13.7.4 Israel - Market size and forecast 2025-2030

Chart on Israel - Market size and forecast 2025-2030 ($ million)
Data Table on Israel - Market size and forecast 2025-2030 ($ million)
Chart on Israel - Year-over-year growth 2025-2030 (%)
Data Table on Israel - Year-over-year growth 2025-2030 (%)

13.7.5 Turkey - Market size and forecast 2025-2030

Chart on Turkey - Market size and forecast 2025-2030 ($ million)
Data Table on Turkey - Market size and forecast 2025-2030 ($ million)
Chart on Turkey - Year-over-year growth 2025-2030 (%)
Data Table on Turkey - Year-over-year growth 2025-2030 (%)

13.8 Market opportunity by geography

Market opportunity by geography ($ million)
Data Tables on Market opportunity by geography ($ million)

14. Drivers, Challenges, and Opportunity

14.1 Market drivers

High demand for health-monitoring wearables
Rising number of lifestyle diseases is aiding market growth
Increased awareness of healthy lifestyle

14.2 Market challenges

High manufacturing cost is restricting market growth
Integration of electronic components into textiles
Lack of awareness leading to limited trust in e-textiles

14.3 Impact of drivers and challenges

Impact of drivers and challenges in 2025 and 2030

14.4 Market opportunities

Increasing adoption of BLE technology and miniaturization of electronic components
Declining cost of wearable technology
Growing use of nanotechnology is amplifying market growth

15. Competitive Landscape

15.1 Overview

15.2

Overview on criticality of inputs and factors of differentiation

15.3 Landscape disruption

Overview on factors of disruption

15.4 Industry risks

Impact of key risks on business

16. Competitive Analysis

16.1 Companies profiled

Companies covered

16.2 Company ranking index

16.3 Market positioning of companies

Matrix on companies position and classification

16.4 Apex Mills

Apex Mills - Overview
Apex Mills - Product / Service
Apex Mills - Key offerings
SWOT

16.5 BAE Systems Plc

BAE Systems Plc - Overview
BAE Systems Plc - Business segments
BAE Systems Plc - Key offerings
BAE Systems Plc - Segment focus
SWOT

16.6 Bally Ribbon Mills

Bally Ribbon Mills - Overview
Bally Ribbon Mills - Product / Service
Bally Ribbon Mills - Key offerings
SWOT

16.7 DuPont de Nemours Inc.

DuPont de Nemours Inc. - Overview
DuPont de Nemours Inc. - Business segments
DuPont de Nemours Inc. - Key news
DuPont de Nemours Inc. - Key offerings
DuPont de Nemours Inc. - Segment focus
SWOT

16.8 Embro Tech GmbH

Embro Tech GmbH - Overview
Embro Tech GmbH - Product / Service
Embro Tech GmbH - Key offerings
SWOT

16.9 Gentherm Inc.

Gentherm Inc. - Overview
Gentherm Inc. - Business segments
Gentherm Inc. - Key offerings
Gentherm Inc. - Segment focus
SWOT

16.10 Jabil Inc.

Jabil Inc. - Overview
Jabil Inc. - Business segments
Jabil Inc. - Key offerings
Jabil Inc. - Segment focus
SWOT

16.11 NV Bekaert SA

NV Bekaert SA - Overview
NV Bekaert SA - Business segments
NV Bekaert SA - Key offerings
NV Bekaert SA - Segment focus
SWOT

16.12 Outlast Technologies GmbH

Outlast Technologies GmbH - Overview
Outlast Technologies GmbH - Product / Service
Outlast Technologies GmbH - Key offerings
SWOT

16.13 sanSirro GmbH

sanSirro GmbH - Overview
sanSirro GmbH - Product / Service
sanSirro GmbH - Key offerings
SWOT

16.14 Schoeller Textil AG

Schoeller Textil AG - Overview
Schoeller Textil AG - Product / Service
Schoeller Textil AG - Key offerings
SWOT

16.15 Statex Produktions

Statex Produktions - Overview
Statex Produktions - Product / Service
Statex Produktions - Key offerings
SWOT

16.16 ThermoSoft International Corp.

ThermoSoft International Corp. - Overview
ThermoSoft International Corp. - Product / Service
ThermoSoft International Corp. - Key offerings
SWOT

16.17 Toray Industries Inc.

Toray Industries Inc. - Overview
Toray Industries Inc. - Business segments
Toray Industries Inc. - Key news
Toray Industries Inc. - Key offerings
Toray Industries Inc. - Segment focus
SWOT

16.18 Vista Medical Ltd.

Vista Medical Ltd. - Overview
Vista Medical Ltd. - Product / Service
Vista Medical Ltd. - Key offerings
SWOT

17. Appendix

17.1 Scope of the report

Market definition
Objectives
Notes and caveats

17.2 Inclusions and exclusions checklist

Inclusions checklist
Exclusions checklist

17.3 Currency conversion rates for US$

17.4 Research methodology

17.5 Data procurement

Information sources

17.6 Data validation

17.7 Validation techniques employed for market sizing

17.8 Data synthesis

17.9 360 degree market analysis

17.10 List of abbreviations

Research Methodology

Technavio presents a detailed picture of the market by way of study, synthesis, and summation of data from multiple sources. The analysts have presented the various facets of the market with a particular focus on identifying the key industry influencers. The data thus presented is comprehensive, reliable, and the result of extensive research, both primary and secondary.

INFORMATION SOURCES

Primary sources

  • Manufacturers and suppliers
  • Channel partners
  • Industry experts
  • Strategic decision makers

Secondary sources

  • Industry journals and periodicals
  • Government data
  • Financial reports of key industry players
  • Historical data
  • Press releases

DATA ANALYSIS

Data Synthesis

  • Collation of data
  • Estimation of key figures
  • Analysis of derived insights

Data Validation

  • Triangulation with data models
  • Reference against proprietary databases
  • Corroboration with industry experts

REPORT WRITING

Qualitative

  • Market drivers
  • Market challenges
  • Market trends
  • Five forces analysis

Quantitative

  • Market size and forecast
  • Market segmentation
  • Geographical insights
  • Competitive landscape

Interested in this report?

Get your sample now to see our research methodology and insights!

Download Now

Frequently Asked Questions

E-Textile market growth will increase by USD 14807.6 million during 2026-2030.

The E-Textile market is expected to grow at a CAGR of 19.5% during 2026-2030.

E-Textile market is segmented by Application (Passive, Active) End-user (Military and defense, Architecture, Sports and fitness, Transportation, Others) Technology (Thermostatic, Energy harvesting, Sensing, Luminescent) Type (Modern electronic devices, Classical electronic devices)

AiQ Smart Clothing Inc., Apex Mills, BAE Systems Plc, Bally Ribbon Mills, DuPont de Nemours Inc., Embro Tech GmbH, Gentherm Inc., Hexoskin, Interactive Wear AG, Jabil Inc., LOOMIA, Mitsufuji Corp., NV Bekaert SA, Ohmatex AS, Outlast Technologies GmbH, sanSirro GmbH, Schoeller Textil AG, Sensoria Inc., Statex Produktions, Tex Ray Industrial Co. Ltd., ThermoSoft International Corp., Toray Industries Inc., Vista Medical Ltd., Vulpes Electronics GmbH, Xenoma Inc. are a few of the key vendors in the E-Textile market.

North America will register the highest growth rate of 39.1% among the other regions. Therefore, the E-Textile market in North America is expected to garner significant business opportunities for the vendors during the forecast period.

US, Canada, Mexico, China, Japan, India, South Korea, Australia, Indonesia, Germany, UK, France, Italy, Spain, The Netherlands, Brazil, Argentina, Chile, Saudi Arabia, UAE, South Africa, Israel, Turkey

  • High demand for health-monitoring wearables is the driving factor this market.

The E-Textile market vendors should focus on grabbing business opportunities from the Application segment as it accounted for the largest market share in the base year.
RIA - Research AI Assistant
Ask RIA
