
Ecommerce Fulfillment Service Market Analysis, Size, and Forecast 2026-2030: APAC (China, Japan, and India), North America (US, Canada, and Mexico), Europe (UK, Germany, and France), Middle East and Africa (UAE, Saudi Arabia, and South Africa), South America (Brazil, Argentina, and Chile), and Rest of World (ROW)

Ecommerce Fulfillment Service Market Analysis, Size, and Forecast 2026-2030:
APAC (China, Japan, and India), North America (US, Canada, and Mexico), Europe (UK, Germany, and France), Middle East and Africa (UAE, Saudi Arabia, and South Africa), South America (Brazil, Argentina, and Chile), and Rest of World (ROW)

Published: Oct 2026 322 Pages SKU: IRTNTR77194

Market Overview at a Glance

$292.62 B
Market Opportunity
19.4%
CAGR 2025 - 2030
27%
North America Growth
$70.96 B
Shipping fulfillment segment 2024

Ecommerce Fulfillment Service Market Size 2026-2030

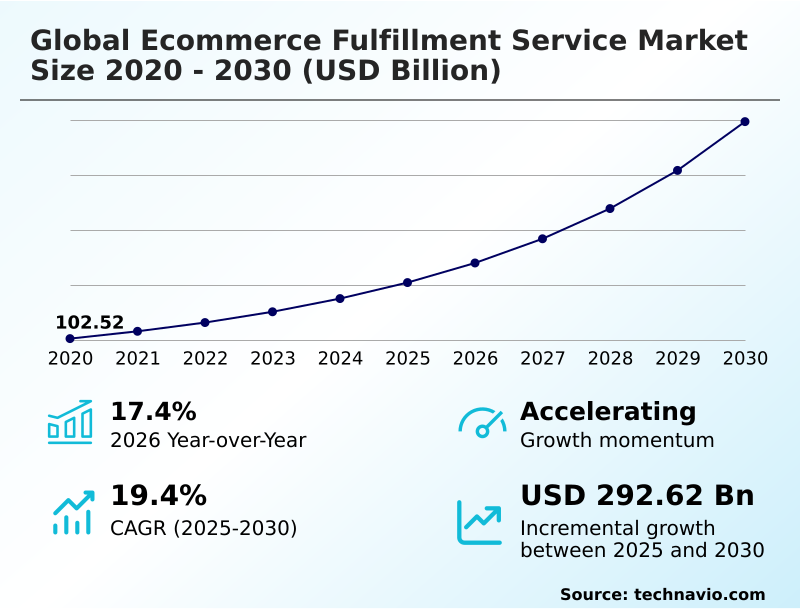
The ecommerce fulfillment service market size is valued to increase by USD 292.62 billion, at a CAGR of 19.4% from 2025 to 2030. Omnichannel commerce and multi-platform online retailing will drive the ecommerce fulfillment service market.

Major Market Trends & Insights

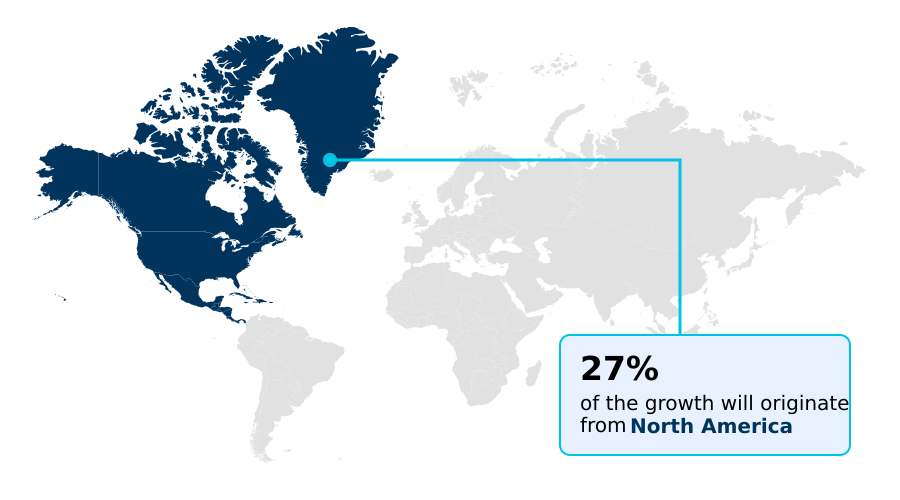
  • North America dominated the market and accounted for a 27% growth during the forecast period.
  • By Service - Shipping fulfillment segment was valued at USD 70.96 billion in 2024
  • By Retail Channel - B2B segment accounted for the largest market revenue share in 2024

Market Size & Forecast

  • Market Opportunities: USD 394.52 billion
  • Market Future Opportunities: USD 292.62 billion
  • CAGR from 2025 to 2030 : 19.4%

Market Summary

  • The Ecommerce Fulfillment Service ecosystem functions as the critical operational bridge connecting digital storefronts to final consumer delivery points. Modern commerce architectures increasingly depend on sophisticated third-party logistics to maintain inventory fluidity and accurate order execution.
  • When a mid-sized consumer electronics brand experiences viral social media demand, reliance on predictive algorithmic routing and dynamic slotting algorithms ensures stock is positioned close to end-users, preventing backorders. Facilities adopting automated storage and retrieval systems process inbound orders with a 45% reduction in manual picking errors compared to traditional shelving methods.
  • The persistent expansion of direct-to-consumer models acts as a primary market driver, compelling merchants to outsource warehousing to achieve multi-node orchestration without massive capital investments. Conversely, rising carrier surcharges present significant operational challenges, forcing providers to absorb heightened last-mile costs. Optimizing cross-docking automation and intelligent stock balancing remains essential for mitigating these cost pressures while satisfying rigorous delivery expectations.

What will be the Size of the Ecommerce Fulfillment Service Market during the forecast period?
Get Key Insights on Market Forecast (PDF) Get Free Sample

How is the Ecommerce Fulfillment Service Market Segmented?

The ecommerce fulfillment service industry research report provides comprehensive data (region-wise segment analysis), with forecasts and estimates in "USD million" for the period 2026-2030, as well as historical data from 2020-2024 for the following segments.

  • Service
    • Shipping fulfillment
    • Warehousing and storage
    • Bundling fulfillment
    • Others
  • Retail channel
    • B2B
    • B2C
  • Application
    • Apparel and footwear
    • Consumer electronics
    • Home and kitchen
    • Sports and leisure
    • Others
  • Business segment
    • Large enterprises
    • SMEs
  • Geography
    • APAC
      • China
      • Japan
      • India
      • South Korea
      • Australia
      • Indonesia
    • North America
      • US
      • Canada
      • Mexico
    • Europe
      • UK
      • Germany
      • France
      • Italy
      • Spain
      • The Netherlands
    • Middle East and Africa
      • UAE
      • Saudi Arabia
      • South Africa
      • Egypt
      • Morocco
    • South America
      • Brazil
      • Argentina
      • Chile

By Service Insights

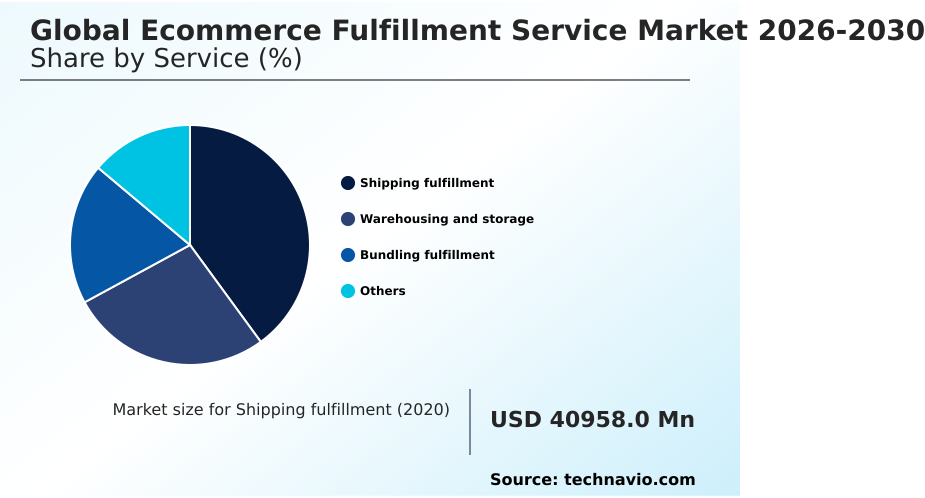
The shipping fulfillment segment is estimated to witness significant growth during the forecast period.

Shipping fulfillment operations represent a critical infrastructure layer determining supply chain agility and final-mile efficiency. As consumer demand for expedited delivery windows intensifies, merchants leverage multi-carrier management software to dynamically route packages based on real-time transit variables.

Transitioning from centralized dispatch to micro-fulfillment nodes reduces line-haul dependencies and structural bottlenecks. Modern distribution centers utilizing automated routing protocols have reported a 22% improvement in on-time delivery metrics during peak promotional cycles.

Integrating cloud-based inventory management enables businesses to synchronize stock levels with live shipping data, minimizing redundant transfers. This segment evolves continuously as logistics operators incorporate eco-friendly practices to balance aggressive service level agreements against escalating last-mile transit reduction priorities.
Get Free Sample

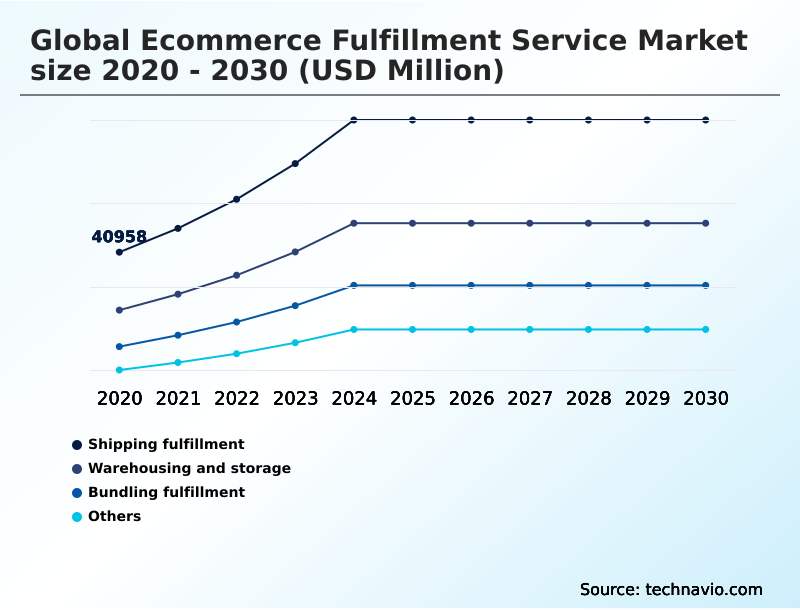
The Shipping fulfillment segment was valued at USD 70.96 billion in 2024 and showed a gradual increase during the forecast period.
Get Free Sample

Regional Analysis

North America is estimated to contribute 27% to the growth of the global market during the forecast period.Technavio’s analysts have elaborately explained the regional trends and drivers that shape the market during the forecast period.
See How Ecommerce Fulfillment Service Market Demand is Rising in North America Get Free Sample

The geographic distribution of Ecommerce Fulfillment Service infrastructure reveals distinct strategic adaptations between mature and emerging markets.

North American logistics networks aggressively prioritize autonomous mobile robots and zone-skipping logistics, achieving a 40% reduction in order processing cycles to meet next-day delivery mandates.

In contrast, APAC operations focus heavily on extreme high-density urban nodes, processing nearly 60% higher daily parcel volumes per square foot than Western counterparts due to intense population concentration and mobile commerce penetration.

These regional disparities dictate unique operational approaches; while Western providers emphasize reverse supply chain optimization and sustainable packaging solutions to manage high apparel return rates, Asian operators invest in robotic parcel sorting to handle massive outbound scale.

Consequently, businesses expanding internationally must align their operational strategies with the localized technological readiness defining each specific regional corridor.

Market Dynamics

Our researchers analyzed the data with 2025 as the base year, along with the key drivers, trends, and challenges. A holistic analysis of drivers will help companies refine their marketing strategies to gain a competitive advantage.

  • Strategic agility within the Ecommerce Fulfillment Service landscape increasingly depends on the integration of highly specialized operational workflows. Modern merchants require predictive inventory placement for digital sellers to accurately position stock ahead of localized demand spikes, ensuring capital is not tied up in redundant warehouse locations.
  • This capability relies heavily on data-synthesis tools that outperform legacy historical forecasting by predicting purchasing trends with up to a 28% higher accuracy rate. Furthermore, the transition toward automated robotic picking in distribution centers has fundamentally altered labor utilization, allowing facilities to maintain continuous throughput even during severe seasonal workforce shortages.
  • As the digital grocery sector matures, maintaining temperature-sensitive compliance in fresh food dictates a stringent overhaul of existing cold-chain assets, requiring multi-zone climate tracking that standard dry-goods facilities simply cannot support. Simultaneously, the normalization of frictionless online returns has mandated sophisticated reverse logistics triage for consumer returns to prevent severe inventory depreciation.
  • When functional merchandise is quickly re-entered into active systems, brands recover significantly more capital than through delayed liquidation channels. To combat rising last-mile expenses, logistics leaders are heavily investing in decentralized micro-fulfillment nodes for urban zones, placing goods exceptionally close to high-density populations.
  • This approach drastically curtails transport transit times and lowers fuel consumption, proving highly superior to centralized distribution models in achieving sustainable operational planning.
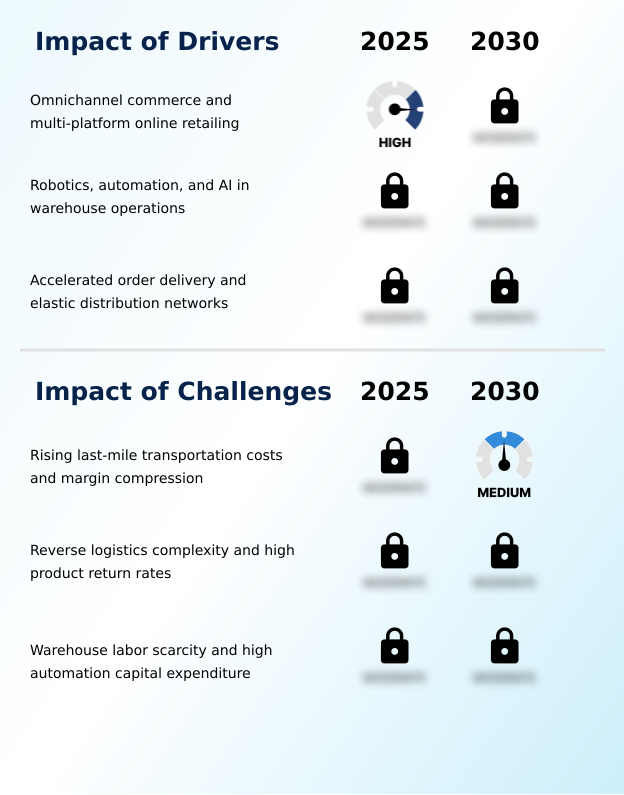
What are the key market drivers leading to the rise in the adoption of Ecommerce Fulfillment Service Industry?

  • The continuous expansion of omnichannel commerce alongside multi-platform digital retailing acts as the primary catalyst accelerating demand for advanced logistics infrastructure.

  • The rapid proliferation of digital commerce serves as a foundational driver accelerating outsourced logistics demand across the Ecommerce Fulfillment Service landscape. Brands seeking international market penetration lack the capital to build proprietary infrastructure, driving heavy reliance on external supply networks.
  • The necessity to navigate cross-border customs clearance efficiently compels merchants to leverage bonded warehouse infrastructure for frictionless trade operations.
  • Facilities utilizing labor constraint mitigation technologies and automated packaging lines achieve a 30% reduction in packaging waste and lower per-unit processing costs by nearly 18%. This mechanization effectively counters severe workforce shortages while accelerating dispatch rates.
  • Furthermore, the adoption of circular packaging material enables independent digital sellers to execute high-volume order fulfillment with sustainable precision, fundamentally democratizing global supply chain capabilities for modern enterprises.

What are the market trends shaping the Ecommerce Fulfillment Service Industry?

  • The integration of artificial intelligence for predictive inventory placement and dynamic demand forecasting represents a defining operational trend reshaping market capabilities.

  • The systemic shift toward algorithmic inventory orchestration represents a major trend redefining operational capabilities across the Ecommerce Fulfillment Service landscape. As consumers continuously demand tighter delivery windows, merchants are forced to adopt distributed warehouse network models to pre-position stock across various geographic regions.
  • Facilities integrating intelligent stock balancing have improved space utilization efficiency by 25% while simultaneously reducing worker travel time. This operational pivot directly mitigates the impact of unexpected demand spikes, yielding a 15% increase in order accuracy during peak promotional events. The implementation of omnichannel stock synchronization prevents disparate channel stockouts, ensuring brand continuity across retail platforms.
  • Transitioning from reactive storage to proactive inventory allocation modeling ensures that businesses maximize fulfillment velocity while maintaining strict control over line-haul freight expenditures.

What challenges does the Ecommerce Fulfillment Service Industry face during its growth?

  • Escalating last-mile transportation expenditures combined with severe operational margin compression present structural challenges that continuously constrain industry profitability.

  • Escalating last-mile distribution expenses and complex returns workflows present severe structural challenges within the Ecommerce Fulfillment Service environment. As consumer expectations for free shipping intensify, logistics operators must absorb the financial burden of decentralized routing, compressing operational margins significantly.
  • Managing the influx of customer returns requires highly labor-intensive reverse logistics triage, which can increase processing overhead by 40% compared to standard outbound fulfillment. Furthermore, implementing electrostatic discharge protection and batch expiration tracking demands costly specialized equipment, restricting profitability for mid-sized operators.
  • Attempting freight forward integration with legacy merchant software often results in extended deployment cycles, delaying projected operational improvements by up to 20%. Navigating these acute capital and operational barriers remains critical for service providers attempting to scale sustainable multi-node distribution networks without eroding service quality.

Exclusive Technavio Analysis on Customer Landscape

The ecommerce fulfillment service market forecasting report includes the adoption lifecycle of the market, covering from the innovator’s stage to the laggard’s stage. It focuses on adoption rates in different regions based on penetration. Furthermore, the ecommerce fulfillment service market report also includes key purchase criteria and drivers of price sensitivity to help companies evaluate and develop their market growth analysis strategies.
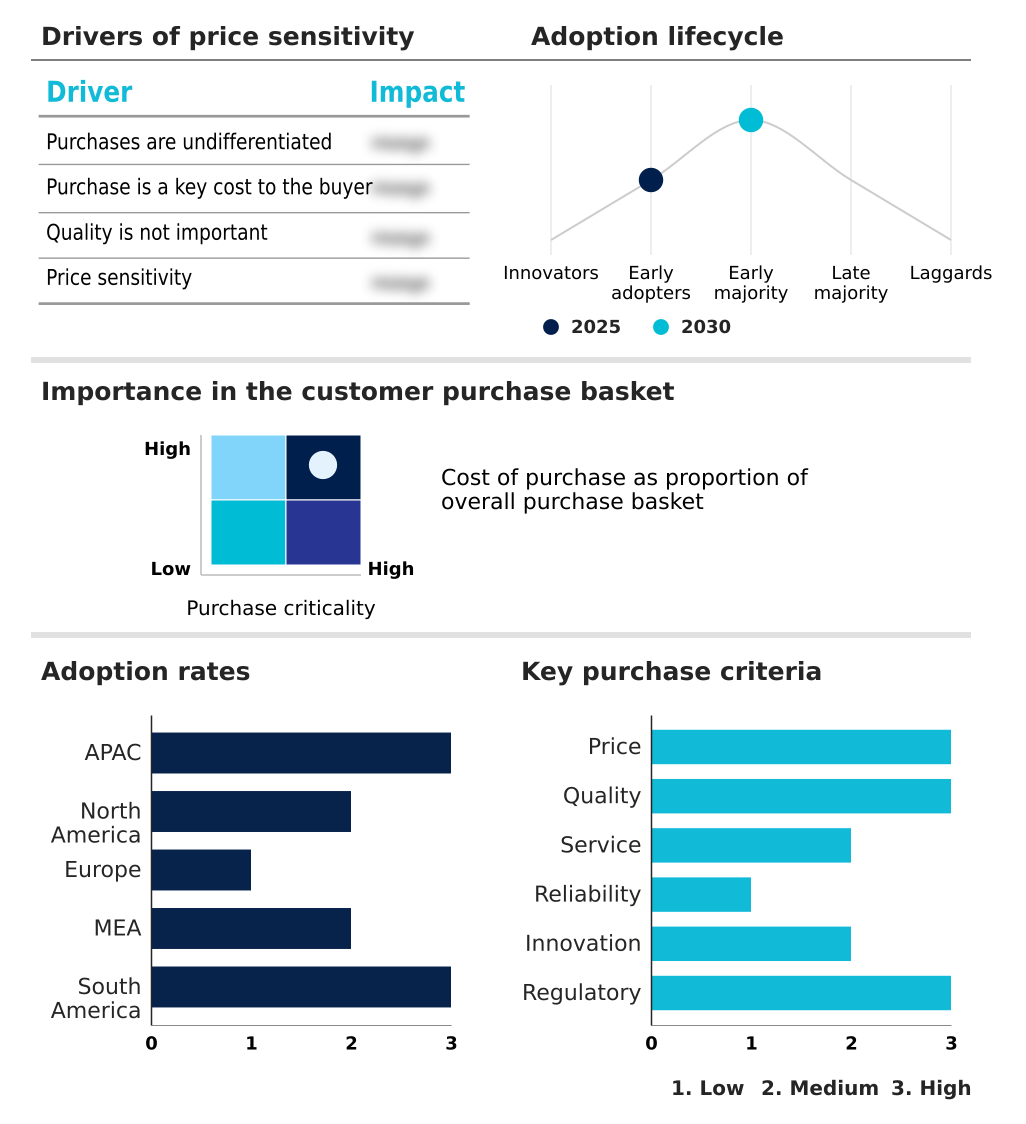
Customer Landscape of Ecommerce Fulfillment Service Industry

Competitive Landscape

Companies are implementing various strategies, such as strategic alliances, ecommerce fulfillment service market forecast, partnerships, mergers and acquisitions, geographical expansion, and product/service launches, to enhance their presence in the industry.

Amazon.com Inc. - Integrated retail and supply chain services enable merchants to outsource inventory storage, multi-channel order processing, and rapid parcel delivery to optimize operational agility and consumer satisfaction.

The industry research and growth report includes detailed analyses of the competitive landscape of the market and information about key companies, including:

  • Amazon.com Inc.
  • Arvato SE
  • CEVA Logistics SA
  • DCL Logistics
  • DHL International GmbH
  • DSV AS
  • FedEx Corp.
  • Flexport Inc.
  • GEODIS
  • GXO Logistics Inc.
  • Kuehne Nagel Management AG
  • Radial Inc.
  • Red Stag Fulfillment LLC
  • Rhenus SE and Co. KG
  • Ryder System Inc.
  • SEKO Logistics
  • Shipbob Inc.
  • ShipMonk Inc.
  • Shopify Inc.
  • United Parcel Service Inc.

Qualitative and quantitative analysis of companies has been conducted to help clients understand the wider business environment as well as the strengths and weaknesses of key industry players. Data is qualitatively analyzed to categorize companies as pure play, category-focused, industry-focused, and diversified; it is quantitatively analyzed to categorize companies as dominant, leading, strong, tentative, and weak.

Recent Development and News in Ecommerce fulfillment service market

  • In the Broadline Retail industry, the rapid expansion of direct-to-consumer dispatch models by established consumer packaged goods manufacturers has strained traditional centralized warehousing, directly impacting Ecommerce Fulfillment Service demand by requiring multi-tenant distribution networks that guarantee next-day delivery capabilities.
  • The implementation of stringent urban emission zones across major European municipalities has forced major retailers to rethink logistics, thereby driving Ecommerce Fulfillment Service providers to invest heavily in carbon-neutral facility design and urban delivery hubs to maintain compliance.
  • A structural shift toward circular economy mandates within the apparel sector has exponentially increased the volume of customer returns, compelling Ecommerce Fulfillment Service operators to deploy advanced systems and return merchandise authorization software capable of recovering sellable inventory.
  • The aggressive integration of automated grocery platforms has heightened requirements for perishable merchandise handling, accelerating Ecommerce Fulfillment Service infrastructure upgrades that include smart thermal sensors and temperature-controlled warehousing to prevent spoilage during transit.

Dive into Technavio’s robust research methodology, blending expert interviews, extensive data synthesis, and validated models for unparalleled Ecommerce Fulfillment Service Market insights. See full methodology.

Market Scope
Page number 322
Base year 2025
Historic period 2020-2024
Forecast period 2026-2030
Growth momentum & CAGR Accelerate at a CAGR of 19.4%
Market growth 2026-2030 USD 292615.2 million
Market structure Fragmented
YoY growth 2025-2026(%) 17.4%
Key countries China, Japan, India, South Korea, Australia, Indonesia, US, Canada, Mexico, UK, Germany, France, Italy, Spain, The Netherlands, UAE, Saudi Arabia, South Africa, Egypt, Morocco, Brazil, Argentina and Chile
Competitive landscape Leading Companies, Market Positioning of Companies, Competitive Strategies, and Industry Risks

Request Free Sample

Research Analyst Overview

  • The Ecommerce Fulfillment Service architecture is undergoing a rapid technological transformation as enterprises shift away from legacy warehousing toward integrated digital supply networks. Boardroom discussions are increasingly centered on aligning fulfillment strategies with aggressive sustainability and compliance targets. Implementing closed-loop waste management is no longer optional but a strict requirement for securing enterprise-level merchant contracts.
  • The adoption of predictive demand forecasting empowers executives to optimize inventory capital allocation, directly influencing broader product pricing strategies. Facilities that upgrade to warehouse execution platforms combined with automated guided vehicles observe a 35% reduction in overall order fulfillment cycle times compared to manual facilities. This operational acceleration mitigates the risks associated with volatile consumer purchasing behaviors.
  • Furthermore, the deployment of automated optical inspection during the packing phase ensures absolute order accuracy, protecting brand integrity. By bridging physical operations with real-time shipment visibility, modern logistics operators enable merchants to navigate supply chain disruptions seamlessly, securing competitive advantages through superior speed and reliable multi-channel execution.

What are the Key Data Covered in this Ecommerce Fulfillment Service Market Research and Growth Report?

  • What is the expected growth of the Ecommerce Fulfillment Service Market between 2026 and 2030?

    • USD 292.62 billion, at a CAGR of 19.4%

  • What segmentation does the market report cover?

    • The report is segmented by Service (Shipping fulfillment, Warehousing and storage, Bundling fulfillment, and Others), Retail Channel (B2B, and B2C), Application (Apparel and footwear, Consumer electronics, Home and kitchen, Sports and leisure, and Others), Business Segment (Large enterprises, and SMEs) and Geography (APAC, North America, Europe, Middle East and Africa, South America)

  • Which regions are analyzed in the report?

    • APAC, North America, Europe, Middle East and Africa and South America

  • What are the key growth drivers and market challenges?

    • Omnichannel commerce and multi-platform online retailing, Rising last-mile transportation costs and margin compression

  • Who are the major players in the Ecommerce Fulfillment Service Market?

    • Amazon.com Inc., Arvato SE, CEVA Logistics SA, DCL Logistics, DHL International GmbH, DSV AS, FedEx Corp., Flexport Inc., GEODIS, GXO Logistics Inc., Kuehne Nagel Management AG, Radial Inc., Red Stag Fulfillment LLC, Rhenus SE and Co. KG, Ryder System Inc., SEKO Logistics, Shipbob Inc., ShipMonk Inc., Shopify Inc. and United Parcel Service Inc.

Market Research Insights

  • The Ecommerce Fulfillment Service landscape is rapidly shifting toward highly automated, data-driven supply chain decentralization. Facilities that implement machine learning inventory optimization experience a 35% improvement in stock turnover efficiency relative to legacy manual tracking operations.
  • As digital commerce distribution models expand, businesses rely on sophisticated carrier networks to combat rising freight costs, leading to a 20% reduction in average transit expenditures. By leveraging high-density storage grids, modern distribution hubs can increase active stock capacity by over 50% within existing spatial footprints.
  • These structural enhancements empower digital merchants to navigate the peak volume bottleneck while ensuring a seamless post-purchase customer experience across fragmented international retail corridors.

We can help! Our analysts can customize this ecommerce fulfillment service market research report to meet your requirements.

Get in touch

1. Executive Summary

1.1 Market overview

Executive Summary - Chart on Market Overview
Executive Summary - Data Table on Market Overview
Executive Summary - Chart on Global Market Characteristics
Executive Summary - Chart on Market by Geography
Executive Summary - Chart on Market Segmentation by Service
Executive Summary - Chart on Market Segmentation by Retail Channel
Executive Summary - Chart on Market Segmentation by Application
Executive Summary - Chart on Market Segmentation by Business Segment
Executive Summary - Chart on Incremental Growth
Executive Summary - Data Table on Incremental Growth
Executive Summary - Chart on Company Market Positioning

2. Technavio Analysis

2.1 Analysis of price sensitivity, lifecycle, customer purchase basket, adoption rates, and purchase criteria

2.2 Criticality of inputs and Factors of differentiation

Chart on Overview on criticality of inputs and factors of differentiation

2.3 Factors of disruption

Chart on Overview on factors of disruption

2.4 Impact of drivers and challenges

Chart on Impact of drivers and challenges in 2025 and 2030

3. Market Landscape

3.1 Market ecosystem

Chart on Parent Market
Data Table on - Parent Market

3.2 Market characteristics

Chart on Market characteristics analysis

3.3 Value chain analysis

Chart on Value chain analysis

4. Market Sizing

4.1 Market definition

Data Table on Offerings of companies included in the market definition

4.2 Market segment analysis

Market segments

4.3 Market size 2025

4.4 Market outlook: Forecast for 2025-2030

Chart on Global - Market size and forecast 2025-2030 ($ million)
Data Table on Global - Market size and forecast 2025-2030 ($ million)
Chart on Global Market: Year-over-year growth 2025-2030 (%)
Data Table on Global Market: Year-over-year growth 2025-2030 (%)

5. Historic Market Size

5.1 Global Ecommerce Fulfillment Service Market 2020 - 2024

Historic Market Size - Data Table on Global Ecommerce Fulfillment Service Market 2020 - 2024 ($ million)

5.2 Service segment analysis 2020 - 2024

Historic Market Size - Service Segment 2020 - 2024 ($ million)

5.3 Retail Channel segment analysis 2020 - 2024

Historic Market Size - Retail Channel Segment 2020 - 2024 ($ million)

5.4 Application segment analysis 2020 - 2024

Historic Market Size - Application Segment 2020 - 2024 ($ million)

5.5 Business segment analysis 2020 - 2024

Historic Market Size - Business Segment 2020 - 2024 ($ million)

5.6 Geography segment analysis 2020 - 2024

Historic Market Size - Geography Segment 2020 - 2024 ($ million)

5.7 Country segment analysis 2020 - 2024

Historic Market Size - Country Segment 2020 - 2024 ($ million)

6. Qualitative Analysis

6.1 Impact of AI on Global Ecommerce Fulfillment Service Market

6.2 Impact of Geopolitical Conflicts on Global Ecommerce Fulfillment Service Market

7. Five Forces Analysis

7.1 Five forces summary

Five forces analysis - Comparison between 2025 and 2030

7.2 Bargaining power of buyers

Bargaining power of buyers - Impact of key factors 2025 and 2030

7.3 Bargaining power of suppliers

Bargaining power of suppliers - Impact of key factors in 2025 and 2030

7.4 Threat of new entrants

Threat of new entrants - Impact of key factors in 2025 and 2030

7.5 Threat of substitutes

Threat of substitutes - Impact of key factors in 2025 and 2030

7.6 Threat of rivalry

Threat of rivalry - Impact of key factors in 2025 and 2030

7.7 Market condition

Chart on Market condition - Five forces 2025 and 2030

8. Market Segmentation by Service

8.1 Market segments

Chart on Service - Market share 2025-2030 (%)
Data Table on Service - Market share 2025-2030 (%)

8.2 Comparison by Service

Chart on Comparison by Service
Data Table on Comparison by Service

8.3 Shipping fulfillment - Market size and forecast 2025-2030

Chart on Shipping fulfillment - Market size and forecast 2025-2030 ($ million)
Data Table on Shipping fulfillment - Market size and forecast 2025-2030 ($ million)
Chart on Shipping fulfillment - Year-over-year growth 2025-2030 (%)
Data Table on Shipping fulfillment - Year-over-year growth 2025-2030 (%)

8.4 Warehousing and storage - Market size and forecast 2025-2030

Chart on Warehousing and storage - Market size and forecast 2025-2030 ($ million)
Data Table on Warehousing and storage - Market size and forecast 2025-2030 ($ million)
Chart on Warehousing and storage - Year-over-year growth 2025-2030 (%)
Data Table on Warehousing and storage - Year-over-year growth 2025-2030 (%)

8.5 Bundling fulfillment - Market size and forecast 2025-2030

Chart on Bundling fulfillment - Market size and forecast 2025-2030 ($ million)
Data Table on Bundling fulfillment - Market size and forecast 2025-2030 ($ million)
Chart on Bundling fulfillment - Year-over-year growth 2025-2030 (%)
Data Table on Bundling fulfillment - Year-over-year growth 2025-2030 (%)

8.6 Others - Market size and forecast 2025-2030

Chart on Others - Market size and forecast 2025-2030 ($ million)
Data Table on Others - Market size and forecast 2025-2030 ($ million)
Chart on Others - Year-over-year growth 2025-2030 (%)
Data Table on Others - Year-over-year growth 2025-2030 (%)

8.7 Market opportunity by Service

Market opportunity by Service ($ million)
Data Table on Market opportunity by Service ($ million)

9. Market Segmentation by Retail Channel

9.1 Market segments

Chart on Retail Channel - Market share 2025-2030 (%)
Data Table on Retail Channel - Market share 2025-2030 (%)

9.2 Comparison by Retail Channel

Chart on Comparison by Retail Channel
Data Table on Comparison by Retail Channel

9.3 B2B - Market size and forecast 2025-2030

Chart on B2B - Market size and forecast 2025-2030 ($ million)
Data Table on B2B - Market size and forecast 2025-2030 ($ million)
Chart on B2B - Year-over-year growth 2025-2030 (%)
Data Table on B2B - Year-over-year growth 2025-2030 (%)

9.4 B2C - Market size and forecast 2025-2030

Chart on B2C - Market size and forecast 2025-2030 ($ million)
Data Table on B2C - Market size and forecast 2025-2030 ($ million)
Chart on B2C - Year-over-year growth 2025-2030 (%)
Data Table on B2C - Year-over-year growth 2025-2030 (%)

9.5 Market opportunity by Retail Channel

Market opportunity by Retail Channel ($ million)
Data Table on Market opportunity by Retail Channel ($ million)

10. Market Segmentation by Application

10.1 Market segments

Chart on Application - Market share 2025-2030 (%)
Data Table on Application - Market share 2025-2030 (%)

10.2 Comparison by Application

Chart on Comparison by Application
Data Table on Comparison by Application

10.3 Apparel and footwear - Market size and forecast 2025-2030

Chart on Apparel and footwear - Market size and forecast 2025-2030 ($ million)
Data Table on Apparel and footwear - Market size and forecast 2025-2030 ($ million)
Chart on Apparel and footwear - Year-over-year growth 2025-2030 (%)
Data Table on Apparel and footwear - Year-over-year growth 2025-2030 (%)

10.4 Consumer electronics - Market size and forecast 2025-2030

Chart on Consumer electronics - Market size and forecast 2025-2030 ($ million)
Data Table on Consumer electronics - Market size and forecast 2025-2030 ($ million)
Chart on Consumer electronics - Year-over-year growth 2025-2030 (%)
Data Table on Consumer electronics - Year-over-year growth 2025-2030 (%)

10.5 Home and kitchen - Market size and forecast 2025-2030

Chart on Home and kitchen - Market size and forecast 2025-2030 ($ million)
Data Table on Home and kitchen - Market size and forecast 2025-2030 ($ million)
Chart on Home and kitchen - Year-over-year growth 2025-2030 (%)
Data Table on Home and kitchen - Year-over-year growth 2025-2030 (%)

10.6 Sports and leisure - Market size and forecast 2025-2030

Chart on Sports and leisure - Market size and forecast 2025-2030 ($ million)
Data Table on Sports and leisure - Market size and forecast 2025-2030 ($ million)
Chart on Sports and leisure - Year-over-year growth 2025-2030 (%)
Data Table on Sports and leisure - Year-over-year growth 2025-2030 (%)

10.7 Others - Market size and forecast 2025-2030

Chart on Others - Market size and forecast 2025-2030 ($ million)
Data Table on Others - Market size and forecast 2025-2030 ($ million)
Chart on Others - Year-over-year growth 2025-2030 (%)
Data Table on Others - Year-over-year growth 2025-2030 (%)

10.8 Market opportunity by Application

Market opportunity by Application ($ million)
Data Table on Market opportunity by Application ($ million)

11. Market Segmentation by Business Segment

11.1 Market segments

Chart on Market Segmentation by Business Segment - Market share 2025-2030 (%)
Data Table on Market Segmentation by Business Segment - Market share 2025-2030 (%)

11.2 Comparison by Market Segmentation by Business Segment

Chart on Comparison by Market Segmentation by Business Segment
Data Table on Comparison by Market Segmentation by Business Segment

11.3 Large enterprises - Market size and forecast 2025-2030

Chart on Large enterprises - Market size and forecast 2025-2030 ($ million)
Data Table on Large enterprises - Market size and forecast 2025-2030 ($ million)
Chart on Large enterprises - Year-over-year growth 2025-2030 (%)
Data Table on Large enterprises - Year-over-year growth 2025-2030 (%)

11.4 SMEs - Market size and forecast 2025-2030

Chart on SMEs - Market size and forecast 2025-2030 ($ million)
Data Table on SMEs - Market size and forecast 2025-2030 ($ million)
Chart on SMEs - Year-over-year growth 2025-2030 (%)
Data Table on SMEs - Year-over-year growth 2025-2030 (%)

11.5 Market opportunity by Market Segmentation by Business Segment

Market opportunity by Market Segmentation by Business Segment ($ million)
Data Table on Market opportunity by Market Segmentation by Business Segment ($ million)

12. Customer Landscape

12.1 Customer landscape overview

Analysis of price sensitivity, lifecycle, customer purchase basket, adoption rates, and purchase criteria

13. Geographic Landscape

13.1 Geographic segmentation

Chart on Market share by geography 2025-2030 (%)
Data Table on Market share by geography 2025-2030 (%)

13.2 Geographic comparison

Chart on Geographic comparison
Data Table on Geographic comparison

13.3 APAC - Market size and forecast 2025-2030

Chart on APAC - Market size and forecast 2025-2030 ($ million)
Data Table on APAC - Market size and forecast 2025-2030 ($ million)
Chart on APAC - Year-over-year growth 2025-2030 (%)
Data Table on APAC - Year-over-year growth 2025-2030 (%)
Chart on Regional Comparison - APAC
Data Table on Regional Comparison - APAC

13.3.1 China - Market size and forecast 2025-2030

Chart on China - Market size and forecast 2025-2030 ($ million)
Data Table on China - Market size and forecast 2025-2030 ($ million)
Chart on China - Year-over-year growth 2025-2030 (%)
Data Table on China - Year-over-year growth 2025-2030 (%)

13.3.2 Japan - Market size and forecast 2025-2030

Chart on Japan - Market size and forecast 2025-2030 ($ million)
Data Table on Japan - Market size and forecast 2025-2030 ($ million)
Chart on Japan - Year-over-year growth 2025-2030 (%)
Data Table on Japan - Year-over-year growth 2025-2030 (%)

13.3.3 India - Market size and forecast 2025-2030

Chart on India - Market size and forecast 2025-2030 ($ million)
Data Table on India - Market size and forecast 2025-2030 ($ million)
Chart on India - Year-over-year growth 2025-2030 (%)
Data Table on India - Year-over-year growth 2025-2030 (%)

13.3.4 South Korea - Market size and forecast 2025-2030

Chart on South Korea - Market size and forecast 2025-2030 ($ million)
Data Table on South Korea - Market size and forecast 2025-2030 ($ million)
Chart on South Korea - Year-over-year growth 2025-2030 (%)
Data Table on South Korea - Year-over-year growth 2025-2030 (%)

13.3.5 Australia - Market size and forecast 2025-2030

Chart on Australia - Market size and forecast 2025-2030 ($ million)
Data Table on Australia - Market size and forecast 2025-2030 ($ million)
Chart on Australia - Year-over-year growth 2025-2030 (%)
Data Table on Australia - Year-over-year growth 2025-2030 (%)

13.3.6 Indonesia - Market size and forecast 2025-2030

Chart on Indonesia - Market size and forecast 2025-2030 ($ million)
Data Table on Indonesia - Market size and forecast 2025-2030 ($ million)
Chart on Indonesia - Year-over-year growth 2025-2030 (%)
Data Table on Indonesia - Year-over-year growth 2025-2030 (%)

13.4 North America - Market size and forecast 2025-2030

Chart on North America - Market size and forecast 2025-2030 ($ million)
Data Table on North America - Market size and forecast 2025-2030 ($ million)
Chart on North America - Year-over-year growth 2025-2030 (%)
Data Table on North America - Year-over-year growth 2025-2030 (%)
Chart on Regional Comparison - North America
Data Table on Regional Comparison - North America

13.4.1 US - Market size and forecast 2025-2030

Chart on US - Market size and forecast 2025-2030 ($ million)
Data Table on US - Market size and forecast 2025-2030 ($ million)
Chart on US - Year-over-year growth 2025-2030 (%)
Data Table on US - Year-over-year growth 2025-2030 (%)

13.4.2 Canada - Market size and forecast 2025-2030

Chart on Canada - Market size and forecast 2025-2030 ($ million)
Data Table on Canada - Market size and forecast 2025-2030 ($ million)
Chart on Canada - Year-over-year growth 2025-2030 (%)
Data Table on Canada - Year-over-year growth 2025-2030 (%)

13.4.3 Mexico - Market size and forecast 2025-2030

Chart on Mexico - Market size and forecast 2025-2030 ($ million)
Data Table on Mexico - Market size and forecast 2025-2030 ($ million)
Chart on Mexico - Year-over-year growth 2025-2030 (%)
Data Table on Mexico - Year-over-year growth 2025-2030 (%)

13.5 Europe - Market size and forecast 2025-2030

Chart on Europe - Market size and forecast 2025-2030 ($ million)
Data Table on Europe - Market size and forecast 2025-2030 ($ million)
Chart on Europe - Year-over-year growth 2025-2030 (%)
Data Table on Europe - Year-over-year growth 2025-2030 (%)
Chart on Regional Comparison - Europe
Data Table on Regional Comparison - Europe

13.5.1 UK - Market size and forecast 2025-2030

Chart on UK - Market size and forecast 2025-2030 ($ million)
Data Table on UK - Market size and forecast 2025-2030 ($ million)
Chart on UK - Year-over-year growth 2025-2030 (%)
Data Table on UK - Year-over-year growth 2025-2030 (%)

13.5.2 Germany - Market size and forecast 2025-2030

Chart on Germany - Market size and forecast 2025-2030 ($ million)
Data Table on Germany - Market size and forecast 2025-2030 ($ million)
Chart on Germany - Year-over-year growth 2025-2030 (%)
Data Table on Germany - Year-over-year growth 2025-2030 (%)

13.5.3 France - Market size and forecast 2025-2030

Chart on France - Market size and forecast 2025-2030 ($ million)
Data Table on France - Market size and forecast 2025-2030 ($ million)
Chart on France - Year-over-year growth 2025-2030 (%)
Data Table on France - Year-over-year growth 2025-2030 (%)

13.5.4 Italy - Market size and forecast 2025-2030

Chart on Italy - Market size and forecast 2025-2030 ($ million)
Data Table on Italy - Market size and forecast 2025-2030 ($ million)
Chart on Italy - Year-over-year growth 2025-2030 (%)
Data Table on Italy - Year-over-year growth 2025-2030 (%)

13.5.5 Spain - Market size and forecast 2025-2030

Chart on Spain - Market size and forecast 2025-2030 ($ million)
Data Table on Spain - Market size and forecast 2025-2030 ($ million)
Chart on Spain - Year-over-year growth 2025-2030 (%)
Data Table on Spain - Year-over-year growth 2025-2030 (%)

13.5.6 The Netherlands - Market size and forecast 2025-2030

Chart on The Netherlands - Market size and forecast 2025-2030 ($ million)
Data Table on The Netherlands - Market size and forecast 2025-2030 ($ million)
Chart on The Netherlands - Year-over-year growth 2025-2030 (%)
Data Table on The Netherlands - Year-over-year growth 2025-2030 (%)

13.6 Middle East and Africa - Market size and forecast 2025-2030

Chart on Middle East and Africa - Market size and forecast 2025-2030 ($ million)
Data Table on Middle East and Africa - Market size and forecast 2025-2030 ($ million)
Chart on Middle East and Africa - Year-over-year growth 2025-2030 (%)
Data Table on Middle East and Africa - Year-over-year growth 2025-2030 (%)
Chart on Regional Comparison - Middle East and Africa
Data Table on Regional Comparison - Middle East and Africa

13.6.1 UAE - Market size and forecast 2025-2030

Chart on UAE - Market size and forecast 2025-2030 ($ million)
Data Table on UAE - Market size and forecast 2025-2030 ($ million)
Chart on UAE - Year-over-year growth 2025-2030 (%)
Data Table on UAE - Year-over-year growth 2025-2030 (%)

13.6.2 Saudi Arabia - Market size and forecast 2025-2030

Chart on Saudi Arabia - Market size and forecast 2025-2030 ($ million)
Data Table on Saudi Arabia - Market size and forecast 2025-2030 ($ million)
Chart on Saudi Arabia - Year-over-year growth 2025-2030 (%)
Data Table on Saudi Arabia - Year-over-year growth 2025-2030 (%)

13.6.3 South Africa - Market size and forecast 2025-2030

Chart on South Africa - Market size and forecast 2025-2030 ($ million)
Data Table on South Africa - Market size and forecast 2025-2030 ($ million)
Chart on South Africa - Year-over-year growth 2025-2030 (%)
Data Table on South Africa - Year-over-year growth 2025-2030 (%)

13.6.4 Egypt - Market size and forecast 2025-2030

Chart on Egypt - Market size and forecast 2025-2030 ($ million)
Data Table on Egypt - Market size and forecast 2025-2030 ($ million)
Chart on Egypt - Year-over-year growth 2025-2030 (%)
Data Table on Egypt - Year-over-year growth 2025-2030 (%)

13.6.5 Morocco - Market size and forecast 2025-2030

Chart on Morocco - Market size and forecast 2025-2030 ($ million)
Data Table on Morocco - Market size and forecast 2025-2030 ($ million)
Chart on Morocco - Year-over-year growth 2025-2030 (%)
Data Table on Morocco - Year-over-year growth 2025-2030 (%)

13.7 South America - Market size and forecast 2025-2030

Chart on South America - Market size and forecast 2025-2030 ($ million)
Data Table on South America - Market size and forecast 2025-2030 ($ million)
Chart on South America - Year-over-year growth 2025-2030 (%)
Data Table on South America - Year-over-year growth 2025-2030 (%)
Chart on Regional Comparison - South America
Data Table on Regional Comparison - South America

13.7.1 Brazil - Market size and forecast 2025-2030

Chart on Brazil - Market size and forecast 2025-2030 ($ million)
Data Table on Brazil - Market size and forecast 2025-2030 ($ million)
Chart on Brazil - Year-over-year growth 2025-2030 (%)
Data Table on Brazil - Year-over-year growth 2025-2030 (%)

13.7.2 Argentina - Market size and forecast 2025-2030

Chart on Argentina - Market size and forecast 2025-2030 ($ million)
Data Table on Argentina - Market size and forecast 2025-2030 ($ million)
Chart on Argentina - Year-over-year growth 2025-2030 (%)
Data Table on Argentina - Year-over-year growth 2025-2030 (%)

13.7.3 Chile - Market size and forecast 2025-2030

Chart on Chile - Market size and forecast 2025-2030 ($ million)
Data Table on Chile - Market size and forecast 2025-2030 ($ million)
Chart on Chile - Year-over-year growth 2025-2030 (%)
Data Table on Chile - Year-over-year growth 2025-2030 (%)

13.8 Market opportunity by geography

Market opportunity by geography ($ million)
Data Tables on Market opportunity by geography ($ million)

14. Drivers, Challenges, and Opportunity

14.1 Market drivers

Omnichannel commerce and multi-platform online retailing
Robotics, automation, and AI in warehouse operations
Accelerated order delivery and elastic distribution networks

14.2 Market challenges

Rising last-mile transportation costs and margin compression
Reverse logistics complexity and high product return rates
Warehouse labor scarcity and high automation capital expenditure

14.3 Impact of drivers and challenges

Impact of drivers and challenges in 2025 and 2030

14.4 Market opportunities

AI-powered inventory placement and demand forecasting systems
Cold-chain and temperature-controlled e-commerce fulfillment
Sustainable packaging and decarbonized last-mile logistics

15. Competitive Landscape

15.1 Overview

15.2

Overview on criticality of inputs and factors of differentiation

15.3 Landscape disruption

Overview on factors of disruption

15.4 Industry risks

Impact of key risks on business

16. Competitive Analysis

16.1 Companies profiled

Companies covered

16.2 Company ranking index

16.3 Market positioning of companies

Matrix on companies position and classification

16.4 Amazon.com Inc.

Amazon.com Inc. - Overview
Amazon.com Inc. - Business segments
Amazon.com Inc. - Key news
Amazon.com Inc. - Key offerings
Amazon.com Inc. - Segment focus
SWOT

16.5 Arvato SE

Arvato SE - Overview
Arvato SE - Product / Service
Arvato SE - Key offerings
SWOT

16.6 CEVA Logistics SA

CEVA Logistics SA - Overview
CEVA Logistics SA - Product / Service
CEVA Logistics SA - Key offerings
SWOT

16.7 DHL International GmbH

DHL International GmbH - Overview
DHL International GmbH - Business segments
DHL International GmbH - Key news
DHL International GmbH - Key offerings
DHL International GmbH - Segment focus
SWOT

16.8 DSV AS

DSV AS - Overview
DSV AS - Business segments
DSV AS - Key offerings
DSV AS - Segment focus
SWOT

16.9 FedEx Corp.

FedEx Corp. - Overview
FedEx Corp. - Business segments
FedEx Corp. - Key news
FedEx Corp. - Key offerings
FedEx Corp. - Segment focus
SWOT

16.10 GEODIS

GEODIS - Overview
GEODIS - Product / Service
GEODIS - Key offerings
SWOT

16.11 GXO Logistics Inc.

GXO Logistics Inc. - Overview
GXO Logistics Inc. - Product / Service
GXO Logistics Inc. - Key offerings
SWOT

16.12 Kuehne Nagel Management AG

Kuehne Nagel Management AG - Overview
Kuehne Nagel Management AG - Business segments
Kuehne Nagel Management AG - Key news
Kuehne Nagel Management AG - Key offerings
Kuehne Nagel Management AG - Segment focus
SWOT

16.13 Rhenus SE and Co. KG

Rhenus SE and Co. KG - Overview
Rhenus SE and Co. KG - Product / Service
Rhenus SE and Co. KG - Key offerings
SWOT

16.14 Ryder System Inc.

Ryder System Inc. - Overview
Ryder System Inc. - Business segments
Ryder System Inc. - Key offerings
Ryder System Inc. - Segment focus
SWOT

16.15 SEKO Logistics

SEKO Logistics - Overview
SEKO Logistics - Product / Service
SEKO Logistics - Key offerings
SWOT

16.16 ShipMonk Inc.

ShipMonk Inc. - Overview
ShipMonk Inc. - Product / Service
ShipMonk Inc. - Key offerings
SWOT

16.17 Shopify Inc.

Shopify Inc. - Overview
Shopify Inc. - Product / Service
Shopify Inc. - Key offerings
SWOT

16.18 United Parcel Service Inc.

United Parcel Service Inc. - Overview
United Parcel Service Inc. - Business segments
United Parcel Service Inc. - Key offerings
United Parcel Service Inc. - Segment focus
SWOT

17. Appendix

17.1 Scope of the report

Market definition
Objectives
Notes and caveats

17.2 Inclusions and exclusions checklist

Inclusions checklist
Exclusions checklist

17.3 Currency conversion rates for US$

17.4 Research methodology

17.5 Data procurement

Information sources

17.6 Data validation

17.7 Validation techniques employed for market sizing

17.8 Data synthesis

17.9 360 degree market analysis

17.10 List of abbreviations

Research Methodology

Technavio presents a detailed picture of the market by way of study, synthesis, and summation of data from multiple sources. The analysts have presented the various facets of the market with a particular focus on identifying the key industry influencers. The data thus presented is comprehensive, reliable, and the result of extensive research, both primary and secondary.

INFORMATION SOURCES

Primary sources

  • Manufacturers and suppliers
  • Channel partners
  • Industry experts
  • Strategic decision makers

Secondary sources

  • Industry journals and periodicals
  • Government data
  • Financial reports of key industry players
  • Historical data
  • Press releases

DATA ANALYSIS

Data Synthesis

  • Collation of data
  • Estimation of key figures
  • Analysis of derived insights

Data Validation

  • Triangulation with data models
  • Reference against proprietary databases
  • Corroboration with industry experts

REPORT WRITING

Qualitative

  • Market drivers
  • Market challenges
  • Market trends
  • Five forces analysis

Quantitative

  • Market size and forecast
  • Market segmentation
  • Geographical insights
  • Competitive landscape

Interested in this report?

Get your sample now to see our research methodology and insights!

Download Now

Frequently Asked Questions

Ecommerce Fulfillment Service market growth will increase by USD 292615.2 million during 2026-2030.

The Ecommerce Fulfillment Service market is expected to grow at a CAGR of 19.4% during 2026-2030.

Ecommerce Fulfillment Service market is segmented by Service (Shipping fulfillment, Warehousing and storage, Bundling fulfillment, Others) Retail channel (B2B, B2C) Application (Apparel and footwear, Consumer electronics, Home and kitchen, Sports and leisure, Others) Business segment (Large enterprises, SMEs)

Amazon.com Inc., Arvato SE, CEVA Logistics SA, DCL Logistics, DHL International GmbH, DSV AS, FedEx Corp., Flexport Inc., GEODIS, GXO Logistics Inc., Kuehne Nagel Management AG, Radial Inc., Red Stag Fulfillment LLC, Rhenus SE and Co. KG, Ryder System Inc., SEKO Logistics, Shipbob Inc., ShipMonk Inc., Shopify Inc., United Parcel Service Inc. are a few of the key vendors in the Ecommerce Fulfillment Service market.

North America will register the highest growth rate of 27% among the other regions. Therefore, the Ecommerce Fulfillment Service market in North America is expected to garner significant business opportunities for the vendors during the forecast period.

China, Japan, India, South Korea, Australia, Indonesia, US, Canada, Mexico, UK, Germany, France, Italy, Spain, The Netherlands, UAE, Saudi Arabia, South Africa, Egypt, Morocco, Brazil, Argentina, Chile

  • Omnichannel commerce and multi-platform online retailing is the driving factor this market.

The Ecommerce Fulfillment Service market vendors should focus on grabbing business opportunities from the Service segment as it accounted for the largest market share in the base year.
RIA - Research AI Assistant
Ask RIA
