
Engineered Wood Products Market Analysis, Size, and Forecast 2026-2030: Europe (Germany, UK, and France), North America (US, Canada, and Mexico), APAC (China, Japan, and India), Middle East and Africa (Saudi Arabia, UAE, and South Africa), South America (Brazil, Argentina, and Chile), and Rest of World (ROW)

Engineered Wood Products Market Analysis, Size, and Forecast 2026-2030:
Europe (Germany, UK, and France), North America (US, Canada, and Mexico), APAC (China, Japan, and India), Middle East and Africa (Saudi Arabia, UAE, and South Africa), South America (Brazil, Argentina, and Chile), and Rest of World (ROW)

Published: Oct 2026 295 Pages SKU: IRTNTR70872

Market Overview at a Glance

$8.17 B
Market Opportunity
7.3%
CAGR 2025 - 2030
38.1%
Europe Growth
$7.83 B
Structural wood I-beams segment 2024

Engineered Wood Products Market Size 2026-2030

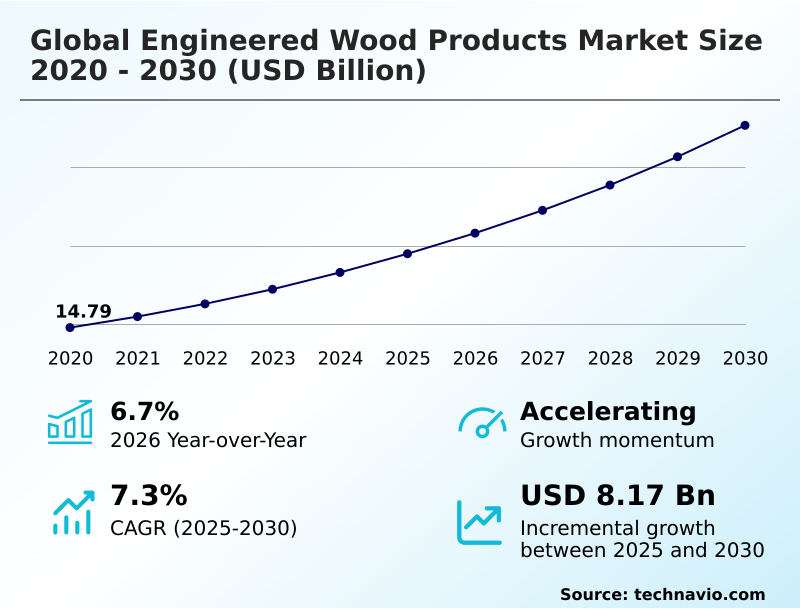
The engineered wood products market size is valued to increase by USD 8.17 billion, at a CAGR of 7.3% from 2025 to 2030. Accelerating adoption of mass timber and green building regulations will drive the engineered wood products market.

Major Market Trends & Insights

  • Europe dominated the market and accounted for a 38.1% growth during the forecast period.
  • By Product - Structural wood I-beams segment was valued at USD 7.83 billion in 2024
  • By Application - Construction segment accounted for the largest market revenue share in 2024

Market Size & Forecast

  • Market Opportunities: USD 12.88 billion
  • Market Future Opportunities: USD 8.17 billion
  • CAGR from 2025 to 2030 : 7.3%

Market Summary

  • The Engineered Wood Products Market exhibits robust expansion as the construction sector aggressively transitions toward sustainable, low-carbon structural alternatives. Real estate developers consistently substitute carbon-intensive concrete with cross-laminated timber multi-story construction materials to satisfy stringent corporate environmental compliance targets.
  • In commercial supply chains, the adoption of prefabricated modular engineered wood components has demonstrated a 20% reduction in on-site labor costs compared to traditional masonry techniques. The accelerating adoption of mass timber construction operates as a primary demand driver, as green building certified engineered timber allows institutional planners to seamlessly achieve required sustainability benchmarks.
  • Conversely, volatile raw material pricing and global supply chain disruptions pose significant operational challenges, frequently forcing manufacturers to absorb overhead spikes and delay project fulfillment. Advanced processing mills are responding by integrating smart sensors manufacturing systems to optimize wood fiber yield and mitigate input scarcity.
  • The reliance on moisture-resistant engineered wood structural components continues to redefine architectural capabilities across both residential and commercial development landscapes.

What will be the Size of the Engineered Wood Products Market during the forecast period?
Get Key Insights on Market Forecast (PDF) Get Free Sample

How is the Engineered Wood Products Market Segmented?

The engineered wood products industry research report provides comprehensive data (region-wise segment analysis), with forecasts and estimates in "USD million" for the period 2026-2030, as well as historical data from 2020-2024 for the following segments.

  • Product
    • Structural wood I-beams
    • LVL
    • Glued laminated timber (Glulam)
    • Others
  • Application
    • Construction
    • Furniture
    • Others
  • End-user
    • Residential
    • Non-residential
  • Geography
    • Europe
      • Germany
      • UK
      • France
      • Italy
      • Spain
      • The Netherlands
    • North America
      • US
      • Canada
      • Mexico
    • APAC
      • China
      • Japan
      • India
      • South Korea
      • Australia
      • Indonesia
    • Middle East and Africa
      • Saudi Arabia
      • UAE
      • South Africa
      • Israel
      • Turkey
    • South America
      • Brazil
      • Argentina
      • Chile

By Product Insights

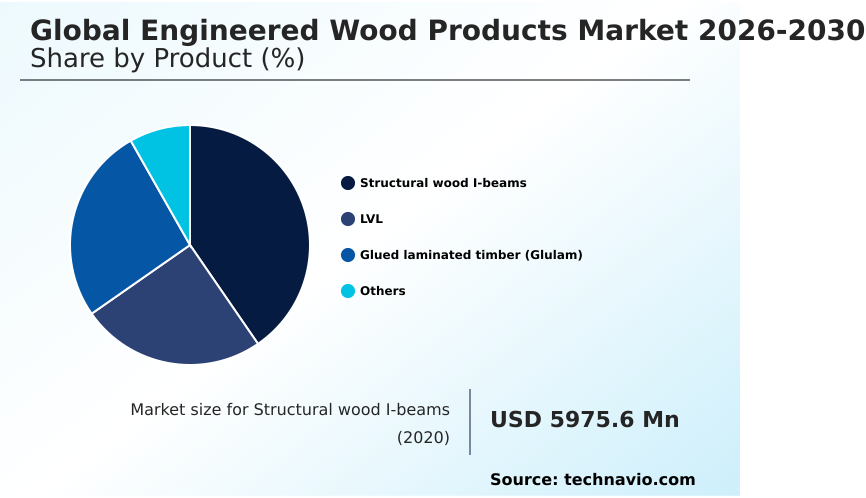
The structural wood i-beams segment is estimated to witness significant growth during the forecast period.

The structural wood I-beams segment operates as a foundational element within the engineered wood products market, driven by the escalating demand for highly engineered structural framing components.

Characterized by unparalleled dimensional stability, these elements provide a superior alternative to conventional lumber, specifically resisting common warping during residential floor framing assemblies.

This precise manufacturing process enhances the overall structural load-bearing capacity, leading to a 15% improvement in material efficiency compared to solid sawn equivalents.

By utilizing advanced automated computer numerical control systems, processing facilities achieve exacting tolerances that perfectly align with building information modeling software requirements.

Furthermore, the integration of moisture-resistant engineered wood and medium-density fiberboard allows developers to execute custom architectural layouts without compromising internal strength.

This continuous material evolution empowers structural engineers to seamlessly achieve strict zero-emission building mandates, effectively minimizing material waste while optimizing long-term performance metrics across diverse construction environments.
Get Free Sample

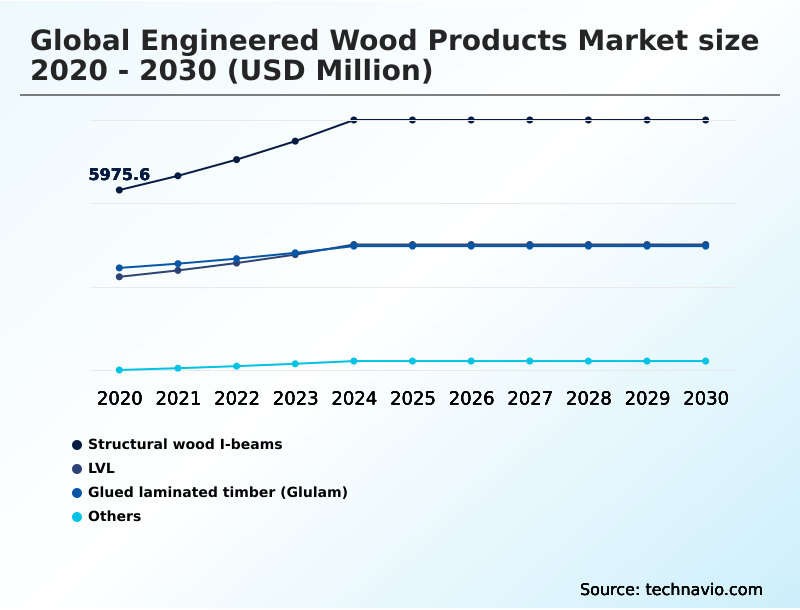
The Structural wood I-beams segment was valued at USD 7.83 billion in 2024 and showed a gradual increase during the forecast period.
Get Free Sample

Regional Analysis

Europe is estimated to contribute 38.1% to the growth of the global market during the forecast period.Technavio’s analysts have elaborately explained the regional trends and drivers that shape the market during the forecast period.
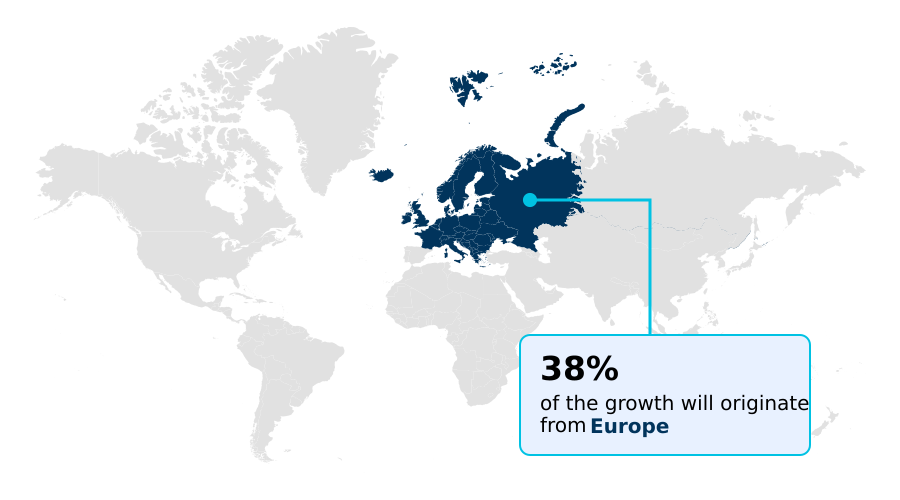
See How Engineered Wood Products Market Demand is Rising in Europe Get Free Sample

The geographic landscape of the engineered wood products market demonstrates stark contrast between mature European operations and rapidly accelerating North American networks.

Europe maintains an exceptionally high utilization of mass timber construction, where established circular bio-economy principles have enabled regional supply chains to achieve a 40% higher adoption rate of cross-laminated timber compared to North American benchmarks.

This disparity exists because European regulatory frameworks rigorously enforce sustainable forestry management, compelling developers to prioritize prefabricated timber systems.

Conversely, North America is experiencing a swift regulatory shift that is driving a 25% increase in the deployment of industrial prefabrication technologies for massive commercial real estate developments.

North American manufacturers are heavily investing in structural wood panels and high-density composite substrates to mitigate localized labor shortages, optimizing overall project execution efficiency by 15%.

Both regions continually advance fire-retardant treated wood components to ensure uncompromised structural integrity even amidst extreme thermal variances.

Market Dynamics

Our researchers analyzed the data with 2025 as the base year, along with the key drivers, trends, and challenges. A holistic analysis of drivers will help companies refine their marketing strategies to gain a competitive advantage.

  • The structural transition toward sustainable architecture heavily relies on the performance of structural load-bearing mass timber systems, which provide unparalleled stability across diverse climatic environments. Manufacturers are fundamentally shifting away from petrochemical synthetics, increasingly utilizing bio-based adhesives for engineered wood to satisfy aggressive environmental mandates.
  • This material evolution is particularly critical in cross-laminated timber multi-story construction, where developers require materials that offer superior strength-to-weight ratios compared to traditional heavy masonry.
  • In interior applications, the adoption of pre-laminated medium density fiberboard panels and high-density composite substrates for furniture has optimized spatial utility, allowing for a 15% reduction in overall material weight compared to solid hardwood alternatives without sacrificing durability. To maintain exact specifications, fabrication facilities deploy automated computer numerical control wood machining, ensuring that every component aligns perfectly with digital models.
  • The implementation of low-emission binding formulations for timber is essential for complying with global health standards, directly influencing the specification of structural wood I-beams for residential framing. Furthermore, the specification of green building certified engineered timber ensures that commercial portfolios align seamlessly with institutional sustainability goals.
  • Engineers rely heavily on moisture-resistant engineered wood structural components to combat environmental degradation, while fire-retardant treated mass timber assemblies address stringent commercial safety protocols. Driven by sustainable forestry certified laminated veneer lumber, supply chains are becoming notably more resilient.
  • The continuous integration of prefabricated modular engineered wood components and zero-emission building mass timber solutions ultimately redefines modern architectural workflows, supported by advanced structural acoustic engineered wood panels for optimal interior acoustic performance.
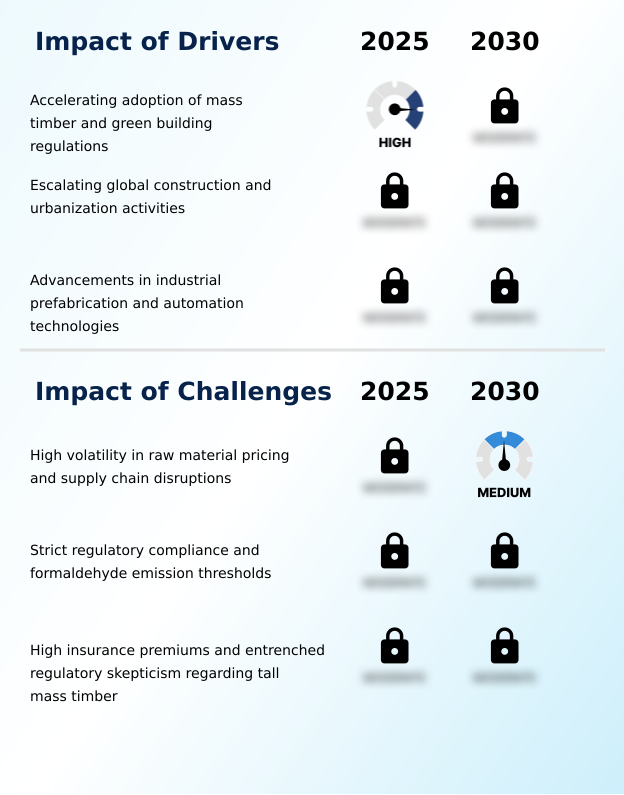
What are the key market drivers leading to the rise in the adoption of Engineered Wood Products Industry?

  • The accelerating adoption of mass timber systems, driven by increasingly stringent green building regulations, serves as the primary catalyst propelling market expansion.

  • The escalating enforcement of strict environmental regulations serves as a fundamental driver propelling the engineered wood products market toward universal adoption.
  • Structural engineering consortiums are rapidly responding to these pressures by substituting carbon-intensive structural steel with highly efficient multi-story wood assemblies.
  • This regulatory pressure has significantly accelerated the specification of glued laminated timber and oriented strand board, resulting in a 30% improvement in the overall carbon sequestration capabilities of newly developed commercial properties.
  • Furthermore, the rising reliance on modular construction methods has reduced on-site execution timelines by 22%, dramatically lowering vocational labor expenditures during massive urban infrastructure expansion projects.
  • By leveraging advanced structural timber composites and bio-based adhesives, manufacturers continuously maximize raw wood fiber yield. This material optimization ensures that developers consistently supply high-performance assemblies that seamlessly secure prestigious green building certifications while optimizing baseline real estate asset valuations.

What are the market trends shaping the Engineered Wood Products Industry?

  • The integration of Industry 4.0 principles and advanced computer numerical control systems represents a prominent trend shaping modern manufacturing workflows. This digital transition optimizes production efficiency and enables the precise fabrication of complex structural components.

  • The engineered wood products market is experiencing a profound technological transformation characterized by the rapid digitalization of off-site manufacturing processes. Processing facilities are aggressively adopting smart sensors manufacturing systems, directly translating architectural blueprints into precision digital timber installations to eliminate manual execution errors.
  • This integration of advanced digital fabrication techniques has improved dimensional cutting accuracy for laminated veneer lumber by 25% while simultaneously reducing raw material waste by 18% during high-volume production cycles. The transition toward intelligent ecosystems allows factories to effectively grade machine-stress-rated lumber and finger-jointed lumber with absolute certainty.
  • Consequently, developers benefit from a 20% acceleration in the delivery of complex multi-layered structural layouts. By incorporating specialized acoustic wood panels and optimizing the thermal performance structural shell, modern construction firms are redefining premium interior fit-out materials, allowing them to compress commercial schedules while maintaining rigorous environmental compliance.

What challenges does the Engineered Wood Products Industry face during its growth?

  • High volatility in raw material pricing, compounded by persistent supply chain disruptions, constitutes a significant structural challenge hindering consistent industrial growth.

  • Persistent instability regarding raw material pricing and essential chemical inputs represents a formidable operational challenge constraining the engineered wood products market. The manufacturing of robust materials like parallel strand lumber and oriented strand lumber relies heavily on the continuous availability of specialized resin bonding matrices, which remain highly vulnerable to fluctuating petrochemical supply chains.
  • These unpredictable overhead spikes have caused a 15% increase in baseline production costs, significantly compressing profit margins for processing mills catering to heavy-duty structural applications. Additionally, the aggressive implementation of lower formaldehyde emission thresholds requires capital-intensive formulation modifications to drastically curb volatile organic compound off-gassing.
  • This regulatory friction forces manufacturers to rapidly engineer alternative natural lignin binders and soy protein adhesives to satisfy stringent indoor air quality indices. Consequently, product certification cycles for seismic-resilient rebuilding components within sustainable building frameworks are extending by up to 20%, complicating long-term pricing guarantees.

Exclusive Technavio Analysis on Customer Landscape

The engineered wood products market forecasting report includes the adoption lifecycle of the market, covering from the innovator’s stage to the laggard’s stage. It focuses on adoption rates in different regions based on penetration. Furthermore, the engineered wood products market report also includes key purchase criteria and drivers of price sensitivity to help companies evaluate and develop their market growth analysis strategies.
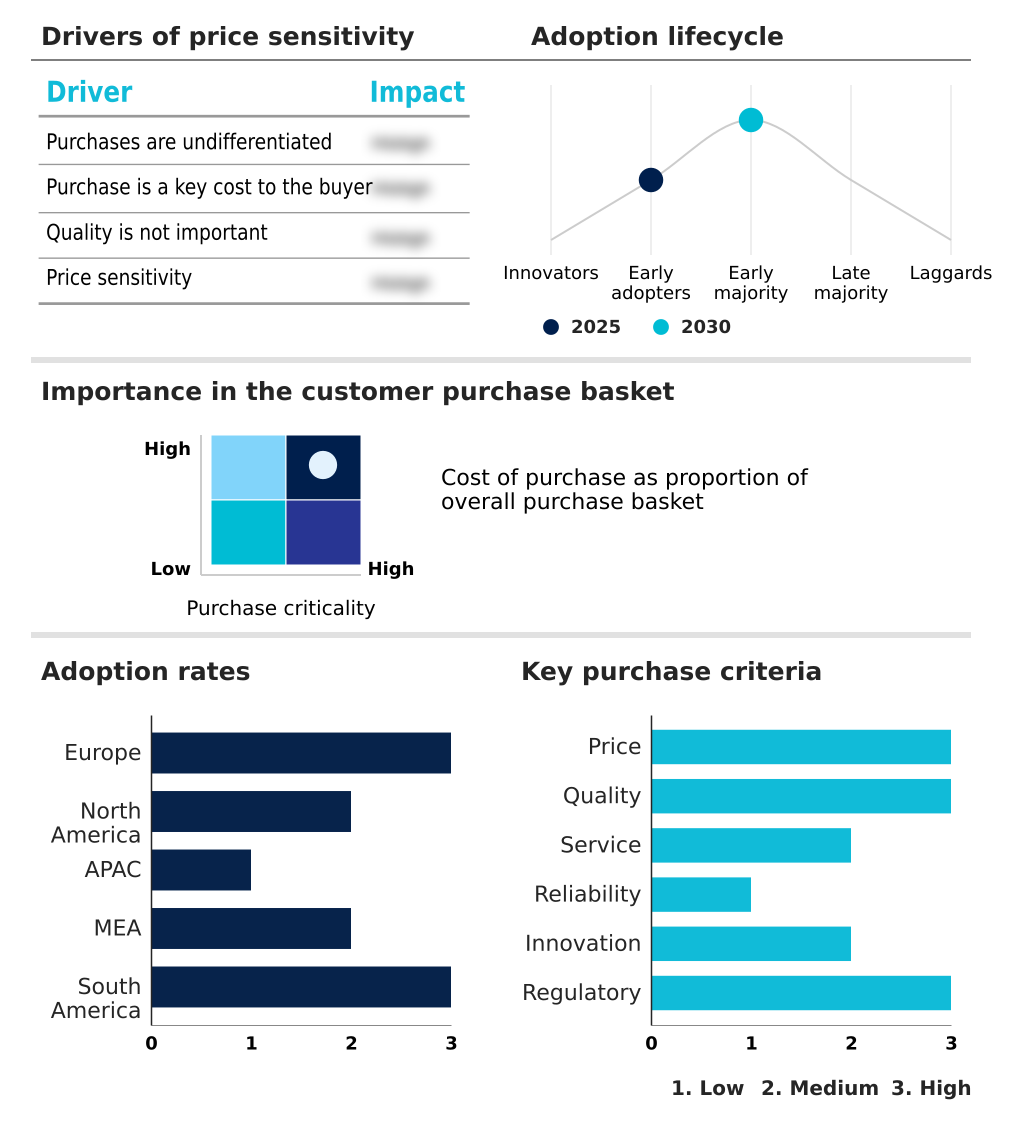
Customer Landscape of Engineered Wood Products Industry

Competitive Landscape

Companies are implementing various strategies, such as strategic alliances, engineered wood products market forecast, partnerships, mergers and acquisitions, geographical expansion, and product/service launches, to enhance their presence in the industry.

Action Tesa - The organization provides advanced engineered wood panels, including medium-density fiberboard and particle boards, delivering durable, dimensionally stable structural materials tailored for interior architecture and modular furniture construction requirements.

The industry research and growth report includes detailed analyses of the competitive landscape of the market and information about key companies, including:

  • Action Tesa
  • Binderholz GmbH
  • Boise Cascade Co.
  • Canfor Corp.
  • Century Plyboards India Ltd.
  • Greenpanel Industries Ltd.
  • Hasslacher Holding GmbH
  • KLH Massivholz GmbH
  • Louisiana Pacific Corp.
  • Mayr Melnhof Holz Holding AG
  • Mercer Mass Timber
  • Metsa Group
  • Nordic Structures
  • Pfeifer Holding GmbH
  • Roseburg Forest Products Co.
  • Schilliger Holz AG
  • Segezha Group
  • SmartLam NA
  • Stora Enso Oyj
  • Structurlam Mass Timber Corp.
  • Tolko Industries Ltd.
  • West Fraser Timber Co. Ltd.

Qualitative and quantitative analysis of companies has been conducted to help clients understand the wider business environment as well as the strengths and weaknesses of key industry players. Data is qualitatively analyzed to categorize companies as pure play, category-focused, industry-focused, and diversified; it is quantitatively analyzed to categorize companies as dominant, leading, strong, tentative, and weak.

Recent Development and News in Engineered wood products market

  • In the Building Products industry, the widespread integration of building information modeling software improved architectural planning efficiency by 22%, directly impacting engineered wood products demand by accelerating the precise specification of structural framing components.
  • The implementation of strict indoor air quality indices across urban infrastructure expansion projects restricted traditional solvent usage by 30%, pulling demand toward bio-based adhesives and low-emission binding formulations for timber.
  • The rapid scaling of modular construction methods reduced average commercial site assembly times by 18%, causing a significant supply chain shift toward prefabricated timber systems and multi-story wood assemblies.
  • Green building certifications and zero-emission building mandates forced a 25% reduction in allowable embodied carbon for new public facilities, fundamentally increasing the utilization of circular bio-economy principles and sustainable forestry management across regional supply networks.

Dive into Technavio’s robust research methodology, blending expert interviews, extensive data synthesis, and validated models for unparalleled Engineered Wood Products Market insights. See full methodology.

Market Scope
Page number 295
Base year 2025
Historic period 2020-2024
Forecast period 2026-2030
Growth momentum & CAGR Accelerate at a CAGR of 7.3%
Market growth 2026-2030 USD 8172.2 million
Market structure Fragmented
YoY growth 2025-2026(%) 6.7%
Key countries Germany, UK, France, Italy, Spain, The Netherlands, US, Canada, Mexico, China, Japan, India, South Korea, Australia, Indonesia, Saudi Arabia, UAE, South Africa, Israel, Turkey, Brazil, Argentina and Chile
Competitive landscape Leading Companies, Market Positioning of Companies, Competitive Strategies, and Industry Risks

Request Free Sample

Research Analyst Overview

  • The engineered wood products market exhibits a continuous trajectory of technological refinement, fundamentally altering structural material procurement across the global construction sector. Facilities producing cross-laminated timber and laminated veneer lumber are comprehensively integrating smart sensors manufacturing to continuously track moisture metrics and optimize high-speed tooling efficiency.
  • This strategic transition directly addresses stringent formaldehyde emission thresholds, prompting a systematic shift toward natural lignin binders and soy protein adhesives. By utilizing advanced resin bonding matrices, panel manufacturers have achieved a 30% reduction in structural volatile organic compound off-gassing, directly aligning product portfolios with rigorous corporate health compliance standards.
  • The deployment of structural timber composites inherently maximizes wood fiber yield, transforming logging residue into highly resilient building substrates. Developers utilizing oriented strand board and medium-density fiberboard consistently report enhanced thermal performance structural shell integrity, effectively mitigating energy consumption within large-scale commercial facilities.
  • This evolution underscores a critical architectural pivot toward lightweight, high-capacity structural elements, ensuring that modern infrastructure meets complex performance criteria while simultaneously accelerating assembly timelines through precision engineering and automated off-site fabrication protocols.

What are the Key Data Covered in this Engineered Wood Products Market Research and Growth Report?

  • What is the expected growth of the Engineered Wood Products Market between 2026 and 2030?

    • USD 8.17 billion, at a CAGR of 7.3%

  • What segmentation does the market report cover?

    • The report is segmented by Product (Structural wood I-beams, LVL, Glued laminated timber (Glulam), and Others), Application (Construction, Furniture, and Others), End-user (Residential, and Non-residential) and Geography (Europe, North America, APAC, Middle East and Africa, South America)

  • Which regions are analyzed in the report?

    • Europe, North America, APAC, Middle East and Africa and South America

  • What are the key growth drivers and market challenges?

    • Accelerating adoption of mass timber and green building regulations, High volatility in raw material pricing and supply chain disruptions

  • Who are the major players in the Engineered Wood Products Market?

    • Action Tesa, Binderholz GmbH, Boise Cascade Co., Canfor Corp., Century Plyboards India Ltd., Greenpanel Industries Ltd., Hasslacher Holding GmbH, KLH Massivholz GmbH, Louisiana Pacific Corp., Mayr Melnhof Holz Holding AG, Mercer Mass Timber, Metsa Group, Nordic Structures, Pfeifer Holding GmbH, Roseburg Forest Products Co., Schilliger Holz AG, Segezha Group, SmartLam NA, Stora Enso Oyj, Structurlam Mass Timber Corp., Tolko Industries Ltd. and West Fraser Timber Co. Ltd.

Market Research Insights

  • The Engineered Wood Products Market is undergoing a rapid structural evolution as developers increasingly mandate sustainable building frameworks to achieve ambitious environmental targets. By substituting traditional steel with multi-story wood assemblies, infrastructure projects have recorded a 35% improvement in overall carbon sequestration capabilities, directly aligning with stringent green building certifications.
  • Furthermore, the integration of off-site manufacturing processes and digital fabrication techniques has reduced on-site material waste by 22%, significantly lowering operational expenditures for commercial real estate developments. This transition toward modular construction methods accelerates project delivery timelines, optimizing capital deployment speeds while ensuring strict compliance with evolving zero-emission building mandates across modern urban infrastructure expansion initiatives.

We can help! Our analysts can customize this engineered wood products market research report to meet your requirements.

Get in touch

1. Executive Summary

1.1 Market overview

Executive Summary - Chart on Market Overview
Executive Summary - Data Table on Market Overview
Executive Summary - Chart on Global Market Characteristics
Executive Summary - Chart on Market by Geography
Executive Summary - Chart on Market Segmentation by Product
Executive Summary - Chart on Market Segmentation by Application
Executive Summary - Chart on Market Segmentation by End-user
Executive Summary - Chart on Incremental Growth
Executive Summary - Data Table on Incremental Growth
Executive Summary - Chart on Company Market Positioning

2. Technavio Analysis

2.1 Analysis of price sensitivity, lifecycle, customer purchase basket, adoption rates, and purchase criteria

2.2 Criticality of inputs and Factors of differentiation

Chart on Overview on criticality of inputs and factors of differentiation

2.3 Factors of disruption

Chart on Overview on factors of disruption

2.4 Impact of drivers and challenges

Chart on Impact of drivers and challenges in 2025 and 2030

3. Market Landscape

3.1 Market ecosystem

Chart on Parent Market
Data Table on - Parent Market

3.2 Market characteristics

Chart on Market characteristics analysis

3.3 Value chain analysis

Chart on Value chain analysis

4. Market Sizing

4.1 Market definition

Data Table on Offerings of companies included in the market definition

4.2 Market segment analysis

Market segments

4.3 Market size 2025

4.4 Market outlook: Forecast for 2025-2030

Chart on Global - Market size and forecast 2025-2030 ($ million)
Data Table on Global - Market size and forecast 2025-2030 ($ million)
Chart on Global Market: Year-over-year growth 2025-2030 (%)
Data Table on Global Market: Year-over-year growth 2025-2030 (%)

5. Historic Market Size

5.1 Global Engineered Wood Products Market 2020 - 2024

Historic Market Size - Data Table on Global Engineered Wood Products Market 2020 - 2024 ($ million)

5.2 Product segment analysis 2020 - 2024

Historic Market Size - Product Segment 2020 - 2024 ($ million)

5.3 Application segment analysis 2020 - 2024

Historic Market Size - Application Segment 2020 - 2024 ($ million)

5.4 End-user segment analysis 2020 - 2024

Historic Market Size - End-user Segment 2020 - 2024 ($ million)

5.5 Geography segment analysis 2020 - 2024

Historic Market Size - Geography Segment 2020 - 2024 ($ million)

5.6 Country segment analysis 2020 - 2024

Historic Market Size - Country Segment 2020 - 2024 ($ million)

6. Qualitative Analysis

6.1 Impact of AI on global engineered wood products market

6.2 Impact of geopolitical conflicts on global engineered wood products market

7. Five Forces Analysis

7.1 Five forces summary

Five forces analysis - Comparison between 2025 and 2030

7.2 Bargaining power of buyers

Bargaining power of buyers - Impact of key factors 2025 and 2030

7.3 Bargaining power of suppliers

Bargaining power of suppliers - Impact of key factors in 2025 and 2030

7.4 Threat of new entrants

Threat of new entrants - Impact of key factors in 2025 and 2030

7.5 Threat of substitutes

Threat of substitutes - Impact of key factors in 2025 and 2030

7.6 Threat of rivalry

Threat of rivalry - Impact of key factors in 2025 and 2030

7.7 Market condition

Chart on Market condition - Five forces 2025 and 2030

8. Market Segmentation by Product

8.1 Market segments

Chart on Product - Market share 2025-2030 (%)
Data Table on Product - Market share 2025-2030 (%)

8.2 Comparison by Product

Chart on Comparison by Product
Data Table on Comparison by Product

8.3 Structural wood I-beams - Market size and forecast 2025-2030

Chart on Structural wood I-beams - Market size and forecast 2025-2030 ($ million)
Data Table on Structural wood I-beams - Market size and forecast 2025-2030 ($ million)
Chart on Structural wood I-beams - Year-over-year growth 2025-2030 (%)
Data Table on Structural wood I-beams - Year-over-year growth 2025-2030 (%)

8.4 LVL - Market size and forecast 2025-2030

Chart on LVL - Market size and forecast 2025-2030 ($ million)
Data Table on LVL - Market size and forecast 2025-2030 ($ million)
Chart on LVL - Year-over-year growth 2025-2030 (%)
Data Table on LVL - Year-over-year growth 2025-2030 (%)

8.5 Glued laminated timber (Glulam) - Market size and forecast 2025-2030

Chart on Glued laminated timber (Glulam) - Market size and forecast 2025-2030 ($ million)
Data Table on Glued laminated timber (Glulam) - Market size and forecast 2025-2030 ($ million)
Chart on Glued laminated timber (Glulam) - Year-over-year growth 2025-2030 (%)
Data Table on Glued laminated timber (Glulam) - Year-over-year growth 2025-2030 (%)

8.6 Others - Market size and forecast 2025-2030

Chart on Others - Market size and forecast 2025-2030 ($ million)
Data Table on Others - Market size and forecast 2025-2030 ($ million)
Chart on Others - Year-over-year growth 2025-2030 (%)
Data Table on Others - Year-over-year growth 2025-2030 (%)

8.7 Market opportunity by Product

Market opportunity by Product ($ million)
Data Table on Market opportunity by Product ($ million)

9. Market Segmentation by Application

9.1 Market segments

Chart on Application - Market share 2025-2030 (%)
Data Table on Application - Market share 2025-2030 (%)

9.2 Comparison by Application

Chart on Comparison by Application
Data Table on Comparison by Application

9.3 Construction - Market size and forecast 2025-2030

Chart on Construction - Market size and forecast 2025-2030 ($ million)
Data Table on Construction - Market size and forecast 2025-2030 ($ million)
Chart on Construction - Year-over-year growth 2025-2030 (%)
Data Table on Construction - Year-over-year growth 2025-2030 (%)

9.4 Furniture - Market size and forecast 2025-2030

Chart on Furniture - Market size and forecast 2025-2030 ($ million)
Data Table on Furniture - Market size and forecast 2025-2030 ($ million)
Chart on Furniture - Year-over-year growth 2025-2030 (%)
Data Table on Furniture - Year-over-year growth 2025-2030 (%)

9.5 Others - Market size and forecast 2025-2030

Chart on Others - Market size and forecast 2025-2030 ($ million)
Data Table on Others - Market size and forecast 2025-2030 ($ million)
Chart on Others - Year-over-year growth 2025-2030 (%)
Data Table on Others - Year-over-year growth 2025-2030 (%)

9.6 Market opportunity by Application

Market opportunity by Application ($ million)
Data Table on Market opportunity by Application ($ million)

10. Market Segmentation by End-user

10.1 Market segments

Chart on End-user - Market share 2025-2030 (%)
Data Table on End-user - Market share 2025-2030 (%)

10.2 Comparison by End-user

Chart on Comparison by End-user
Data Table on Comparison by End-user

10.3 Residential - Market size and forecast 2025-2030

Chart on Residential - Market size and forecast 2025-2030 ($ million)
Data Table on Residential - Market size and forecast 2025-2030 ($ million)
Chart on Residential - Year-over-year growth 2025-2030 (%)
Data Table on Residential - Year-over-year growth 2025-2030 (%)

10.4 Non-residential - Market size and forecast 2025-2030

Chart on Non-residential - Market size and forecast 2025-2030 ($ million)
Data Table on Non-residential - Market size and forecast 2025-2030 ($ million)
Chart on Non-residential - Year-over-year growth 2025-2030 (%)
Data Table on Non-residential - Year-over-year growth 2025-2030 (%)

10.5 Market opportunity by End-user

Market opportunity by End-user ($ million)
Data Table on Market opportunity by End-user ($ million)

11. Customer Landscape

11.1 Customer landscape overview

Analysis of price sensitivity, lifecycle, customer purchase basket, adoption rates, and purchase criteria

12. Geographic Landscape

12.1 Geographic segmentation

Chart on Market share by geography 2025-2030 (%)
Data Table on Market share by geography 2025-2030 (%)

12.2 Geographic comparison

Chart on Geographic comparison
Data Table on Geographic comparison

12.3 Europe - Market size and forecast 2025-2030

Chart on Europe - Market size and forecast 2025-2030 ($ million)
Data Table on Europe - Market size and forecast 2025-2030 ($ million)
Chart on Europe - Year-over-year growth 2025-2030 (%)
Data Table on Europe - Year-over-year growth 2025-2030 (%)
Chart on Regional Comparison - Europe
Data Table on Regional Comparison - Europe

12.3.1 Germany - Market size and forecast 2025-2030

Chart on Germany - Market size and forecast 2025-2030 ($ million)
Data Table on Germany - Market size and forecast 2025-2030 ($ million)
Chart on Germany - Year-over-year growth 2025-2030 (%)
Data Table on Germany - Year-over-year growth 2025-2030 (%)

12.3.2 UK - Market size and forecast 2025-2030

Chart on UK - Market size and forecast 2025-2030 ($ million)
Data Table on UK - Market size and forecast 2025-2030 ($ million)
Chart on UK - Year-over-year growth 2025-2030 (%)
Data Table on UK - Year-over-year growth 2025-2030 (%)

12.3.3 France - Market size and forecast 2025-2030

Chart on France - Market size and forecast 2025-2030 ($ million)
Data Table on France - Market size and forecast 2025-2030 ($ million)
Chart on France - Year-over-year growth 2025-2030 (%)
Data Table on France - Year-over-year growth 2025-2030 (%)

12.3.4 Italy - Market size and forecast 2025-2030

Chart on Italy - Market size and forecast 2025-2030 ($ million)
Data Table on Italy - Market size and forecast 2025-2030 ($ million)
Chart on Italy - Year-over-year growth 2025-2030 (%)
Data Table on Italy - Year-over-year growth 2025-2030 (%)

12.3.5 Spain - Market size and forecast 2025-2030

Chart on Spain - Market size and forecast 2025-2030 ($ million)
Data Table on Spain - Market size and forecast 2025-2030 ($ million)
Chart on Spain - Year-over-year growth 2025-2030 (%)
Data Table on Spain - Year-over-year growth 2025-2030 (%)

12.3.6 The Netherlands - Market size and forecast 2025-2030

Chart on The Netherlands - Market size and forecast 2025-2030 ($ million)
Data Table on The Netherlands - Market size and forecast 2025-2030 ($ million)
Chart on The Netherlands - Year-over-year growth 2025-2030 (%)
Data Table on The Netherlands - Year-over-year growth 2025-2030 (%)

12.4 North America - Market size and forecast 2025-2030

Chart on North America - Market size and forecast 2025-2030 ($ million)
Data Table on North America - Market size and forecast 2025-2030 ($ million)
Chart on North America - Year-over-year growth 2025-2030 (%)
Data Table on North America - Year-over-year growth 2025-2030 (%)
Chart on Regional Comparison - North America
Data Table on Regional Comparison - North America

12.4.1 US - Market size and forecast 2025-2030

Chart on US - Market size and forecast 2025-2030 ($ million)
Data Table on US - Market size and forecast 2025-2030 ($ million)
Chart on US - Year-over-year growth 2025-2030 (%)
Data Table on US - Year-over-year growth 2025-2030 (%)

12.4.2 Canada - Market size and forecast 2025-2030

Chart on Canada - Market size and forecast 2025-2030 ($ million)
Data Table on Canada - Market size and forecast 2025-2030 ($ million)
Chart on Canada - Year-over-year growth 2025-2030 (%)
Data Table on Canada - Year-over-year growth 2025-2030 (%)

12.4.3 Mexico - Market size and forecast 2025-2030

Chart on Mexico - Market size and forecast 2025-2030 ($ million)
Data Table on Mexico - Market size and forecast 2025-2030 ($ million)
Chart on Mexico - Year-over-year growth 2025-2030 (%)
Data Table on Mexico - Year-over-year growth 2025-2030 (%)

12.5 APAC - Market size and forecast 2025-2030

Chart on APAC - Market size and forecast 2025-2030 ($ million)
Data Table on APAC - Market size and forecast 2025-2030 ($ million)
Chart on APAC - Year-over-year growth 2025-2030 (%)
Data Table on APAC - Year-over-year growth 2025-2030 (%)
Chart on Regional Comparison - APAC
Data Table on Regional Comparison - APAC

12.5.1 China - Market size and forecast 2025-2030

Chart on China - Market size and forecast 2025-2030 ($ million)
Data Table on China - Market size and forecast 2025-2030 ($ million)
Chart on China - Year-over-year growth 2025-2030 (%)
Data Table on China - Year-over-year growth 2025-2030 (%)

12.5.2 Japan - Market size and forecast 2025-2030

Chart on Japan - Market size and forecast 2025-2030 ($ million)
Data Table on Japan - Market size and forecast 2025-2030 ($ million)
Chart on Japan - Year-over-year growth 2025-2030 (%)
Data Table on Japan - Year-over-year growth 2025-2030 (%)

12.5.3 India - Market size and forecast 2025-2030

Chart on India - Market size and forecast 2025-2030 ($ million)
Data Table on India - Market size and forecast 2025-2030 ($ million)
Chart on India - Year-over-year growth 2025-2030 (%)
Data Table on India - Year-over-year growth 2025-2030 (%)

12.5.4 South Korea - Market size and forecast 2025-2030

Chart on South Korea - Market size and forecast 2025-2030 ($ million)
Data Table on South Korea - Market size and forecast 2025-2030 ($ million)
Chart on South Korea - Year-over-year growth 2025-2030 (%)
Data Table on South Korea - Year-over-year growth 2025-2030 (%)

12.5.5 Australia - Market size and forecast 2025-2030

Chart on Australia - Market size and forecast 2025-2030 ($ million)
Data Table on Australia - Market size and forecast 2025-2030 ($ million)
Chart on Australia - Year-over-year growth 2025-2030 (%)
Data Table on Australia - Year-over-year growth 2025-2030 (%)

12.5.6 Indonesia - Market size and forecast 2025-2030

Chart on Indonesia - Market size and forecast 2025-2030 ($ million)
Data Table on Indonesia - Market size and forecast 2025-2030 ($ million)
Chart on Indonesia - Year-over-year growth 2025-2030 (%)
Data Table on Indonesia - Year-over-year growth 2025-2030 (%)

12.6 Middle East and Africa - Market size and forecast 2025-2030

Chart on Middle East and Africa - Market size and forecast 2025-2030 ($ million)
Data Table on Middle East and Africa - Market size and forecast 2025-2030 ($ million)
Chart on Middle East and Africa - Year-over-year growth 2025-2030 (%)
Data Table on Middle East and Africa - Year-over-year growth 2025-2030 (%)
Chart on Regional Comparison - Middle East and Africa
Data Table on Regional Comparison - Middle East and Africa

12.6.1 Saudi Arabia - Market size and forecast 2025-2030

Chart on Saudi Arabia - Market size and forecast 2025-2030 ($ million)
Data Table on Saudi Arabia - Market size and forecast 2025-2030 ($ million)
Chart on Saudi Arabia - Year-over-year growth 2025-2030 (%)
Data Table on Saudi Arabia - Year-over-year growth 2025-2030 (%)

12.6.2 UAE - Market size and forecast 2025-2030

Chart on UAE - Market size and forecast 2025-2030 ($ million)
Data Table on UAE - Market size and forecast 2025-2030 ($ million)
Chart on UAE - Year-over-year growth 2025-2030 (%)
Data Table on UAE - Year-over-year growth 2025-2030 (%)

12.6.3 South Africa - Market size and forecast 2025-2030

Chart on South Africa - Market size and forecast 2025-2030 ($ million)
Data Table on South Africa - Market size and forecast 2025-2030 ($ million)
Chart on South Africa - Year-over-year growth 2025-2030 (%)
Data Table on South Africa - Year-over-year growth 2025-2030 (%)

12.6.4 Israel - Market size and forecast 2025-2030

Chart on Israel - Market size and forecast 2025-2030 ($ million)
Data Table on Israel - Market size and forecast 2025-2030 ($ million)
Chart on Israel - Year-over-year growth 2025-2030 (%)
Data Table on Israel - Year-over-year growth 2025-2030 (%)

12.6.5 Turkey - Market size and forecast 2025-2030

Chart on Turkey - Market size and forecast 2025-2030 ($ million)
Data Table on Turkey - Market size and forecast 2025-2030 ($ million)
Chart on Turkey - Year-over-year growth 2025-2030 (%)
Data Table on Turkey - Year-over-year growth 2025-2030 (%)

12.7 South America - Market size and forecast 2025-2030

Chart on South America - Market size and forecast 2025-2030 ($ million)
Data Table on South America - Market size and forecast 2025-2030 ($ million)
Chart on South America - Year-over-year growth 2025-2030 (%)
Data Table on South America - Year-over-year growth 2025-2030 (%)
Chart on Regional Comparison - South America
Data Table on Regional Comparison - South America

12.7.1 Brazil - Market size and forecast 2025-2030

Chart on Brazil - Market size and forecast 2025-2030 ($ million)
Data Table on Brazil - Market size and forecast 2025-2030 ($ million)
Chart on Brazil - Year-over-year growth 2025-2030 (%)
Data Table on Brazil - Year-over-year growth 2025-2030 (%)

12.7.2 Argentina - Market size and forecast 2025-2030

Chart on Argentina - Market size and forecast 2025-2030 ($ million)
Data Table on Argentina - Market size and forecast 2025-2030 ($ million)
Chart on Argentina - Year-over-year growth 2025-2030 (%)
Data Table on Argentina - Year-over-year growth 2025-2030 (%)

12.7.3 Chile - Market size and forecast 2025-2030

Chart on Chile - Market size and forecast 2025-2030 ($ million)
Data Table on Chile - Market size and forecast 2025-2030 ($ million)
Chart on Chile - Year-over-year growth 2025-2030 (%)
Data Table on Chile - Year-over-year growth 2025-2030 (%)

12.8 Market opportunity by geography

Market opportunity by geography ($ million)
Data Tables on Market opportunity by geography ($ million)

13. Drivers, Challenges, and Opportunity

13.1 Market drivers

Accelerating adoption of mass timber and green building regulations
Escalating global construction and urbanization activities
Advancements in industrial prefabrication and automation technologies

13.2 Market challenges

High volatility in raw material pricing and supply chain disruptions
Strict regulatory compliance and formaldehyde emission thresholds
High insurance premiums and entrenched regulatory skepticism regarding tall mass timber

13.3 Impact of drivers and challenges

Impact of drivers and challenges in 2025 and 2030

13.4 Market opportunities

Integration of industry 4.0 principles and advanced computer numerical control systems
Development of eco-friendly bio-based adhesives and low-emission binding formulations
Product portfolio diversification and customization across furniture design sectors

14. Competitive Landscape

14.1 Overview

14.2

Overview on criticality of inputs and factors of differentiation

14.3 Landscape disruption

Overview on factors of disruption

14.4 Industry risks

Impact of key risks on business

15. Competitive Analysis

15.1 Companies profiled

Companies covered

15.2 Company ranking index

15.3 Market positioning of companies

Matrix on companies position and classification

15.4 Action Tesa

Action Tesa - Overview
Action Tesa - Product / Service
Action Tesa - Key offerings
SWOT

15.5 Binderholz GmbH

Binderholz GmbH - Overview
Binderholz GmbH - Product / Service
Binderholz GmbH - Key offerings
SWOT

15.6 Boise Cascade Co.

Boise Cascade Co. - Overview
Boise Cascade Co. - Business segments
Boise Cascade Co. - Key offerings
Boise Cascade Co. - Segment focus
SWOT

15.7 Canfor Corp.

Canfor Corp. - Overview
Canfor Corp. - Business segments
Canfor Corp. - Key offerings
Canfor Corp. - Segment focus
SWOT

15.8 Century Plyboards India Ltd.

Century Plyboards India Ltd. - Overview
Century Plyboards India Ltd. - Business segments
Century Plyboards India Ltd. - Key offerings
Century Plyboards India Ltd. - Segment focus
SWOT

15.9 Greenpanel Industries Ltd.

Greenpanel Industries Ltd. - Overview
Greenpanel Industries Ltd. - Product / Service
Greenpanel Industries Ltd. - Key offerings
SWOT

15.10 Hasslacher Holding GmbH

Hasslacher Holding GmbH - Overview
Hasslacher Holding GmbH - Product / Service
Hasslacher Holding GmbH - Key offerings
SWOT

15.11 KLH Massivholz GmbH

KLH Massivholz GmbH - Overview
KLH Massivholz GmbH - Product / Service
KLH Massivholz GmbH - Key offerings
SWOT

15.12 Louisiana Pacific Corp.

Louisiana Pacific Corp. - Overview
Louisiana Pacific Corp. - Business segments
Louisiana Pacific Corp. - Key offerings
Louisiana Pacific Corp. - Segment focus
SWOT

15.13 Segezha Group

Segezha Group - Overview
Segezha Group - Business segments
Segezha Group - Key offerings
Segezha Group - Segment focus
SWOT

15.14 SmartLam NA

SmartLam NA - Overview
SmartLam NA - Product / Service
SmartLam NA - Key offerings
SWOT

15.15 Stora Enso Oyj

Stora Enso Oyj - Overview
Stora Enso Oyj - Business segments
Stora Enso Oyj - Key news
Stora Enso Oyj - Key offerings
Stora Enso Oyj - Segment focus
SWOT

15.16 Structurlam Mass Timber Corp.

Structurlam Mass Timber Corp. - Overview
Structurlam Mass Timber Corp. - Product / Service
Structurlam Mass Timber Corp. - Key offerings
SWOT

15.17 Tolko Industries Ltd.

Tolko Industries Ltd. - Overview
Tolko Industries Ltd. - Product / Service
Tolko Industries Ltd. - Key offerings
SWOT

15.18 West Fraser Timber Co. Ltd.

West Fraser Timber Co. Ltd. - Overview
West Fraser Timber Co. Ltd. - Business segments
West Fraser Timber Co. Ltd. - Key offerings
West Fraser Timber Co. Ltd. - Segment focus
SWOT

16. Appendix

16.1 Scope of the report

Market definition
Objectives
Notes and caveats

16.2 Inclusions and exclusions checklist

Inclusions checklist
Exclusions checklist

16.3 Currency conversion rates for US$

16.4 Research methodology

16.5 Data procurement

Information sources

16.6 Data validation

16.7 Validation techniques employed for market sizing

16.8 Data synthesis

16.9 360 degree market analysis

16.10 List of abbreviations

Research Methodology

Technavio presents a detailed picture of the market by way of study, synthesis, and summation of data from multiple sources. The analysts have presented the various facets of the market with a particular focus on identifying the key industry influencers. The data thus presented is comprehensive, reliable, and the result of extensive research, both primary and secondary.

INFORMATION SOURCES

Primary sources

  • Manufacturers and suppliers
  • Channel partners
  • Industry experts
  • Strategic decision makers

Secondary sources

  • Industry journals and periodicals
  • Government data
  • Financial reports of key industry players
  • Historical data
  • Press releases

DATA ANALYSIS

Data Synthesis

  • Collation of data
  • Estimation of key figures
  • Analysis of derived insights

Data Validation

  • Triangulation with data models
  • Reference against proprietary databases
  • Corroboration with industry experts

REPORT WRITING

Qualitative

  • Market drivers
  • Market challenges
  • Market trends
  • Five forces analysis

Quantitative

  • Market size and forecast
  • Market segmentation
  • Geographical insights
  • Competitive landscape

Interested in this report?

Get your sample now to see our research methodology and insights!

Download Now

Frequently Asked Questions

Engineered Wood Products market growth will increase by USD 8172.2 million during 2026-2030.

The Engineered Wood Products market is expected to grow at a CAGR of 7.3% during 2026-2030.

Engineered Wood Products market is segmented by Product (Structural wood I-beams, LVL, Glued laminated timber (Glulam), Others) Application (Construction, Furniture, Others) End-user (Residential, Non-residential)

Action Tesa, Binderholz GmbH, Boise Cascade Co., Canfor Corp., Century Plyboards India Ltd., Greenpanel Industries Ltd., Hasslacher Holding GmbH, KLH Massivholz GmbH, Louisiana Pacific Corp., Mayr Melnhof Holz Holding AG, Mercer Mass Timber, Metsa Group, Nordic Structures, Pfeifer Holding GmbH, Roseburg Forest Products Co., Schilliger Holz AG, Segezha Group, SmartLam NA, Stora Enso Oyj, Structurlam Mass Timber Corp., Tolko Industries Ltd., West Fraser Timber Co. Ltd. are a few of the key vendors in the Engineered Wood Products market.

Europe will register the highest growth rate of 38.1% among the other regions. Therefore, the Engineered Wood Products market in Europe is expected to garner significant business opportunities for the vendors during the forecast period.

Germany, UK, France, Italy, Spain, The Netherlands, US, Canada, Mexico, China, Japan, India, South Korea, Australia, Indonesia, Saudi Arabia, UAE, South Africa, Israel, Turkey, Brazil, Argentina, Chile

  • Accelerating adoption of mass timber and green building regulations is the driving factor this market.

The Engineered Wood Products market vendors should focus on grabbing business opportunities from the Product segment as it accounted for the largest market share in the base year.
RIA - Research AI Assistant
Ask RIA
