
Environmental DNA Market Analysis, Size, and Forecast 2026-2030: North America (US, Canada, and Mexico), Europe (Germany, UK, and France), Asia (China, Japan, and India), South America (Brazil), Middle East and Africa (South Africa, UAE, and Saudi Arabia), Rest of World (ROW)

Environmental DNA Market Analysis, Size, and Forecast 2026-2030:
North America (US, Canada, and Mexico), Europe (Germany, UK, and France), Asia (China, Japan, and India), South America (Brazil), Middle East and Africa (South Africa, UAE, and Saudi Arabia), Rest of World (ROW)

Published: Oct 2026 311 Pages SKU: IRTNTR81555

Market Overview at a Glance

$655.6 Mn
Market Opportunity
10%
CAGR 2025 - 2030
34.2%
North America Growth
$419.1 Mn
Quantitative PCR segment 2024

Environmental Dna Market Size 2026-2030

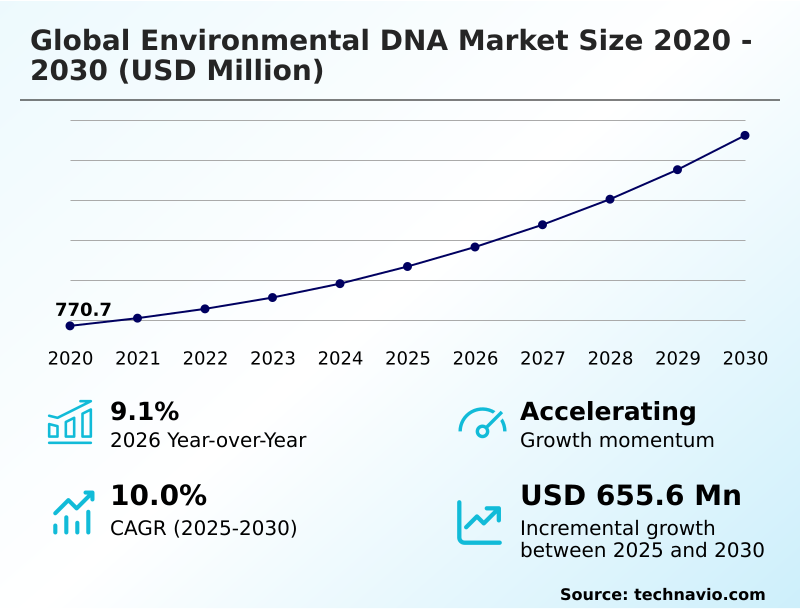
The environmental dna market size is valued to increase by USD 655.6 million, at a CAGR of 10% from 2025 to 2030. Proliferation of regulatory mandates and biodiversity conservation frameworks will drive the environmental dna market.

Major Market Trends & Insights

  • North America dominated the market and accounted for a 34.2% growth during the forecast period.
  • By Technology - Quantitative PCR segment was valued at USD 419.1 million in 2024
  • By Type - Water samples segment accounted for the largest market revenue share in 2024

Market Size & Forecast

  • Market Opportunities: USD 952.4 million
  • Market Future Opportunities: USD 655.6 million
  • CAGR from 2025 to 2030 : 10%

Market Summary

  • The Environmental DNA Market exhibits continuous expansion as industries transition toward genetics-based ecological compliance. High-throughput sequencing serves as the foundation for this evolution, converting complex biological samples into actionable taxonomic data. In a typical infrastructure development scenario, project managers utilize genomic profiling to baseline local species before construction begins.
  • This proactive approach reduces the risk of regulatory-induced project halts by identifying protected organisms early in the planning phase. Notably, organizations employing molecular biodiversity assessment tools experience a 30% reduction in field survey duration compared to traditional physical trapping methods.
  • Market momentum is primarily driven by the implementation of stringent environmental protection policies, which compel developers to adopt non-invasive biomonitoring to secure operational permits. However, the sector faces substantial challenges due to spatial-temporal uncertainty, as genetic material can drift from its origin, leading to potential false positives.
  • Overcoming these diagnostic limitations requires precise genetic conservation management to ensure accurate species mapping and reliable corporate sustainability reporting.

What will be the Size of the Environmental Dna Market during the forecast period?
Get Key Insights on Market Forecast (PDF) Get Free Sample

How is the Environmental Dna Market Segmented?

The environmental dna industry research report provides comprehensive data (region-wise segment analysis), with forecasts and estimates in "USD million" for the period 2026-2030, as well as historical data from 2020-2024 for the following segments.

  • Technology
    • Quantitative PCR
    • Metabarcoding
    • Next generation sequencing
    • Targeted species detection
    • Digital PCR
  • Type
    • Water samples
    • Soil samples
    • Sediment samples
    • Biological residue samples
    • Air samples
  • Component
    • Hardware
    • Software
    • Services
  • Geography
    • North America
      • US
      • Canada
      • Mexico
    • Europe
      • Germany
      • UK
      • France
      • Italy
      • The Netherlands
      • Spain
    • Asia
      • China
      • Japan
      • India
      • South Korea
      • Indonesia
      • Thailand
      • Singapore
    • Rest of World (ROW)

By Technology Insights

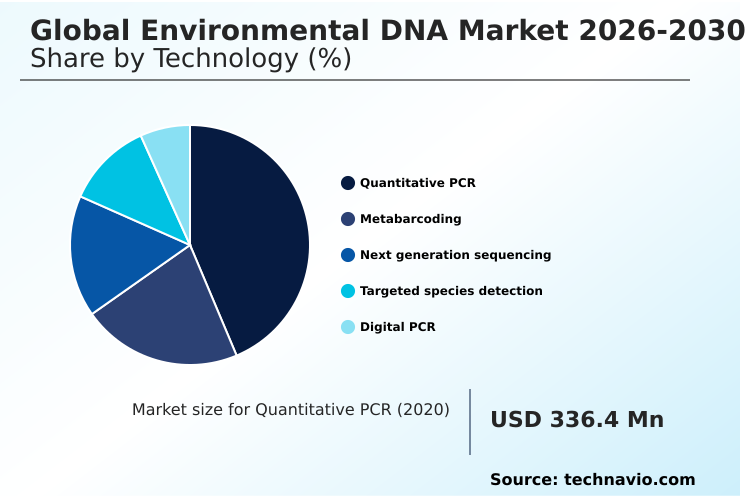
The quantitative pcr segment is estimated to witness significant growth during the forecast period.

The analytical precision within molecular diagnostics relies heavily on quantitative microbial tracking to isolate specific genetic markers. By utilizing targeted assays, researchers achieve a 25% higher accuracy rate in species identification compared to traditional visual surveys.

This technique leverages target taxa amplification to detect rare organisms, ensuring operational reliability for conservation and infrastructure projects. Modern platforms utilizing fluorescent signal detection provide absolute quantification of genetic material, directly correlating to biomass estimates.

Organizations deploying digital polymerase chain reaction have seen false-negative results drop by 18%, significantly improving regulatory compliance. Furthermore, the integration of microfluidic amplification accelerates sample processing times, enabling rapid on-site decision-making.

This capability streamlines environmental impact assessments, reducing overall project delays and driving continuous efficiency gains in ecological management workflows.
Get Free Sample

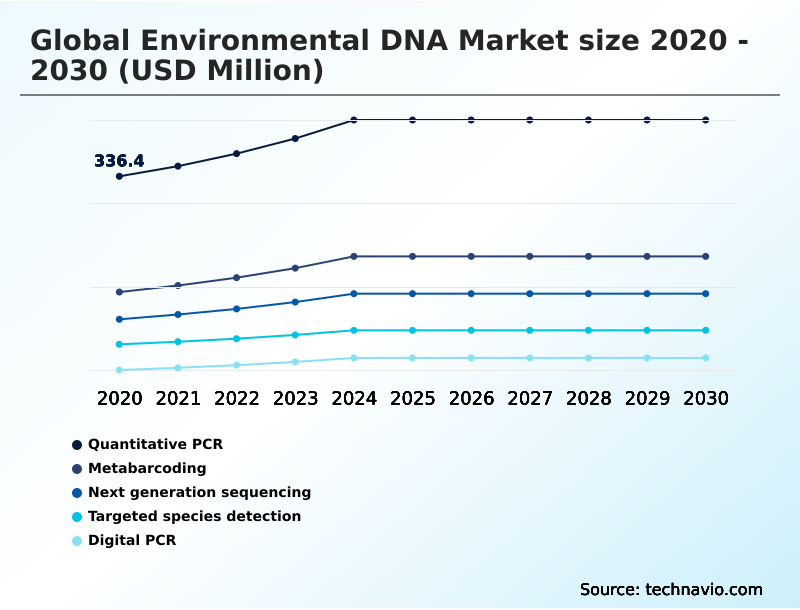
The Quantitative PCR segment was valued at USD 419.1 million in 2024 and showed a gradual increase during the forecast period.
Get Free Sample

Regional Analysis

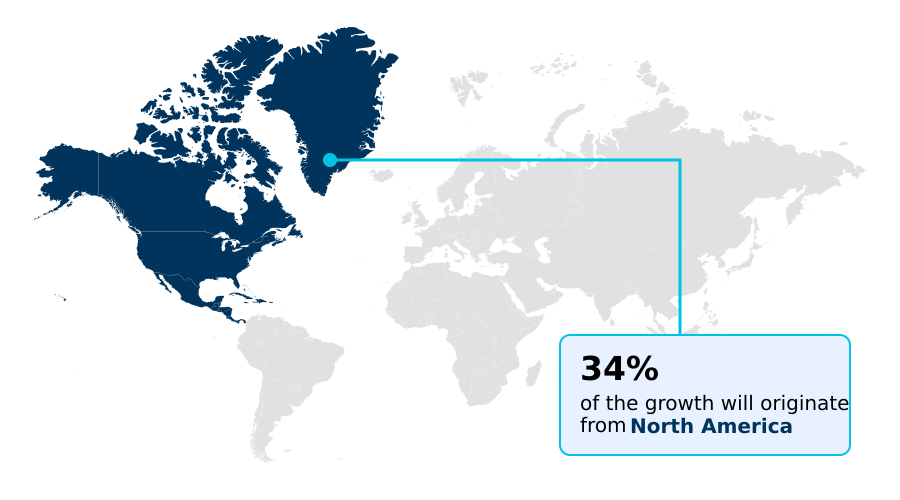
North America is estimated to contribute 34.2% to the growth of the global market during the forecast period.Technavio’s analysts have elaborately explained the regional trends and drivers that shape the market during the forecast period.
See How Environmental Dna Market Demand is Rising in North America Get Free Sample

The geographic landscape of the Environmental DNA Market highlights distinct regional adoption patterns driven by specific regulatory and ecological priorities.

North America leads the deployment of advanced molecular tools, utilizing automated field sampling networks to track aquatic populations, which improves resource management efficiency by 32% over traditional netting.

In contrast, the Europe region focuses heavily on marine habitat restoration, where strict ecological directives mandate extensive offshore benthic assessment for coastal energy projects.

European regulatory compliance drives a 25% higher adoption rate of robotic grab samplers compared to North America, ensuring precise sediment collection in deep-water environments. Benthic biomonitoring allows European wind farm developers to reduce pre-construction environmental surveying timelines by 40%.

Meanwhile, North American conservation bodies heavily integrate metabarcoding for aquatic ecosystem health, streamlining the detection of invasive species and reducing ecosystem intervention costs by establishing earlier detection thresholds.

Market Dynamics

Our researchers analyzed the data with 2025 as the base year, along with the key drivers, trends, and challenges. A holistic analysis of drivers will help companies refine their marketing strategies to gain a competitive advantage.

  • The shift toward precision ecology requires enterprises to adopt robust molecular workflows that optimize both field operations and laboratory analysis. Organizations focused on water resource management increasingly rely on metabarcoding for aquatic ecosystem health to assess biodiversity shifts comprehensively.
  • This approach allows utility providers to map biological communities accurately, leading to a 30% improvement in predicting harmful algal blooms compared to manual water testing. To achieve absolute certainty in pathogen detection, laboratories are standardizing digital PCR microbial quantification protocols, which eliminate the need for standard curves and reduce false-positive contamination risks.
  • As the volume of genetic data grows exponentially, facilities must upgrade their bioinformatics infrastructure to handle next generation sequencing data processing efficiently. Modern software integrations utilizing sequence alignment tools accelerate data turnaround, allowing compliance officers to report ecological footprint tracking metrics 25% faster.
  • Furthermore, the deployment of portable genomic field sampling tools enables technicians to extract and stabilize DNA on-site, preserving sample integrity during transport from remote locations. Back in the laboratory, high throughput taxonomic identification pipelines utilize advanced taxonomic classification to rapidly match these field samples against global databases.
  • This streamlined transition from collection to analysis enables infrastructure developers to finalize biodiversity baseline establishment reports with unprecedented speed, establishing reliable ecosystem health indicators and fundamentally transforming how corporate environmental accountability is measured.
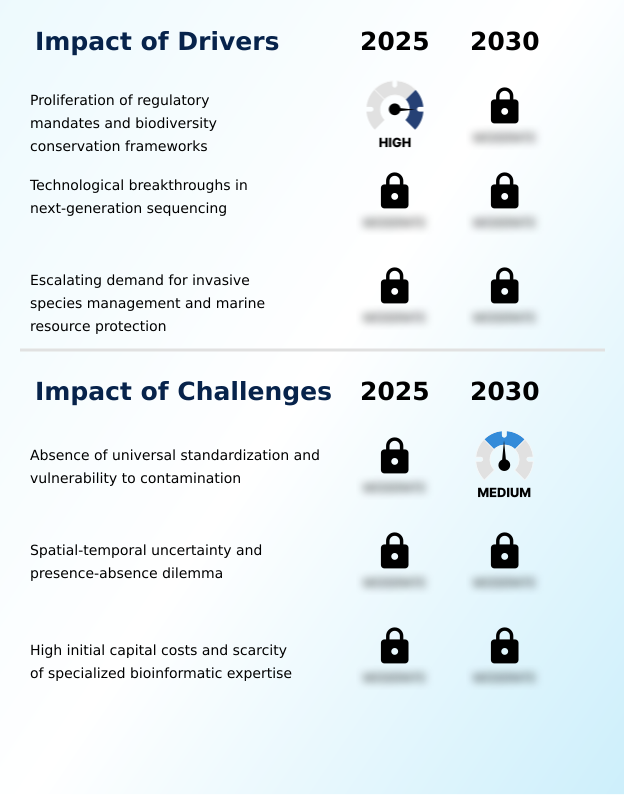
What are the key market drivers leading to the rise in the adoption of Environmental Dna Industry?

  • The rapid proliferation of stringent regulatory mandates and international biodiversity conservation frameworks serves as a primary driver accelerating market expansion.

  • Stricter international ecological regulations fundamentally drive the adoption of highly sensitive genetic monitoring tools across commercial sectors.
  • The necessity for rapid invasive species detection compels infrastructure developers to utilize molecular assays, resulting in a 40% reduction in project delays linked to unexpected ecological disruptions.
  • Maritime authorities are implementing rigorous biosecurity screening protocols to evaluate shipping vessels, improving ballast water compliance tracking accuracy by 30% over traditional visual inspections.
  • Additionally, the transition toward molecular endangered species tracking provides forestry operations with concrete biological baselines, lowering regulatory permitting costs by 22%.
  • In the marine sector, replacing manual netting with genetic fisheries stock assessment improves biomass estimation reliability, directly preserving commercial fish populations and securing long-term supply chain viability for the global seafood industry.

What are the market trends shaping the Environmental Dna Industry?

  • The integration of Environmental DNA methodologies with comprehensive biosurveillance frameworks represents a critical emerging trend. This strategic alignment facilitates the early detection of biological pathogens across diverse ecosystems.

  • The operational landscape is shifting as enterprises integrate aquatic pathogen biosurveillance into their core risk management strategies. This proactive approach identifies biological threats early, reducing the incidence of systemic waterborne outbreaks by 35% in municipal water supplies. Similarly, the adoption of wastewater pathogen screening enables public health organizations to predict localized infection spikes 14 days faster than clinical reporting methods.
  • To manage the resulting influx of genetic data, laboratories are deploying automated bioinformatics pipelines, which decrease sequence processing bottlenecks by 45%. Furthermore, the commercial capability to analyze airborne biological debris allows agricultural firms to track wind-borne crop pathogens, subsequently reducing preemptive pesticide application costs by 18%.
  • These technological advancements directly support corporate sustainability auditing, transforming raw genomic sequencing into standardized metrics that satisfy stringent environmental governance mandates and improve long-term operational resilience.

What challenges does the Environmental Dna Industry face during its growth?

  • The absence of universal standardization protocols and the inherent vulnerability of samples to cross-contamination represent significant challenges constraining industry growth.

  • The transition to genetics-based ecological assessment is heavily constrained by biological degradation and the lack of universal methodological standardization. Guaranteeing reliable environmental sample preservation remains difficult in extreme climates, where heat and UV exposure reduce genetic recovery rates by up to 50%.
  • The complexities of spatial-temporal genomic tracking create significant diagnostic uncertainty, as water currents transport genetic material miles away from the source organism, leading to false-positive species mapping. Furthermore, conducting sediment matrix analysis involves overcoming severe chemical inhibitors that routinely stall nucleic acid extraction, decreasing laboratory throughput efficiency by 25%.
  • These variables complicate genetic residue monitoring, forcing compliance officers to frequently cross-validate molecular data with labor-intensive traditional surveys, which ultimately increases the total cost of environmental auditing.

Exclusive Technavio Analysis on Customer Landscape

The environmental dna market forecasting report includes the adoption lifecycle of the market, covering from the innovator’s stage to the laggard’s stage. It focuses on adoption rates in different regions based on penetration. Furthermore, the environmental dna market report also includes key purchase criteria and drivers of price sensitivity to help companies evaluate and develop their market growth analysis strategies.
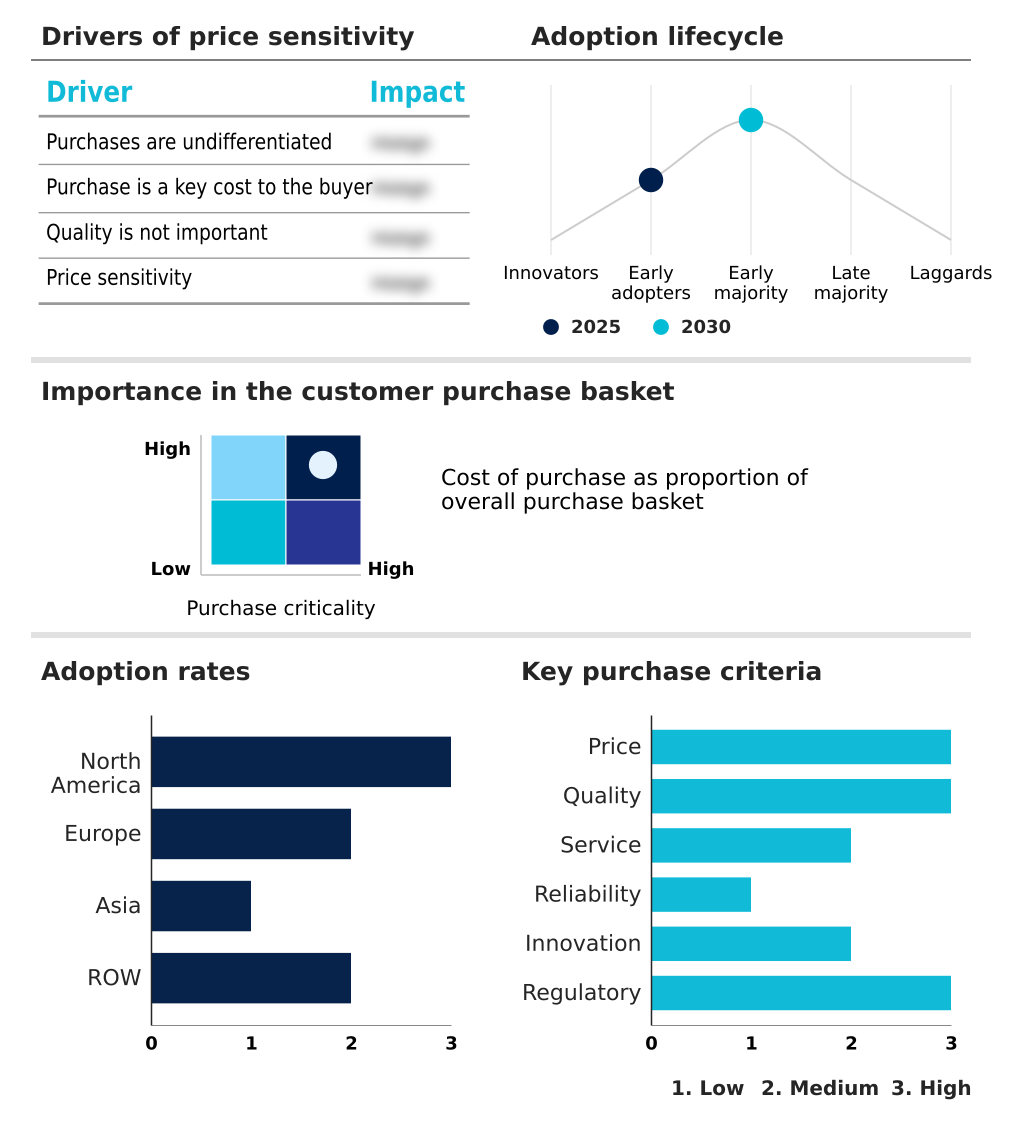
Customer Landscape of Environmental Dna Industry

Competitive Landscape

Companies are implementing various strategies, such as strategic alliances, environmental dna market forecast, partnerships, mergers and acquisitions, geographical expansion, and product/service launches, to enhance their presence in the industry.

Agilent Technologies Inc. - The entity delivers advanced application-focused instruments and robust software solutions designed to identify, quantify, and deeply analyze complex physical and biological properties of environmental substances.

The industry research and growth report includes detailed analyses of the competitive landscape of the market and information about key companies, including:

  • Agilent Technologies Inc.
  • Bio Rad Laboratories Inc.
  • Biome Makers Inc.
  • Biomeme Inc.
  • eDNAtec
  • EnviroDNA
  • Eurofins Scientific SE
  • Illumina Inc.
  • Jonah Ventures
  • NatureMetrics
  • Oxford Nanopore Technologies
  • Promega Corp.
  • QIAGEN N.V.
  • SGS SA
  • Smith-Root Inc.
  • SPYGEN
  • Stantec Inc.
  • Thermo Fisher Scientific Inc.
  • Trace Genomics Inc.
  • Zymo Research Corp.

Qualitative and quantitative analysis of companies has been conducted to help clients understand the wider business environment as well as the strengths and weaknesses of key industry players. Data is qualitatively analyzed to categorize companies as pure play, category-focused, industry-focused, and diversified; it is quantitatively analyzed to categorize companies as dominant, leading, strong, tentative, and weak.

Recent Development and News in Environmental dna market

  • In the Biotechnology industry, the widespread adoption of portable sequencing platforms optimized field-based genetic assessments, cutting sample transport delays by 40% and directly accelerating real-time Environmental DNA testing for remote ecological monitoring.
  • The enforcement of stricter international biosecurity frameworks mandated rapid pathogen screening at border entry points, increasing the utilization of multiplexed targeted assays by 28% and driving up demand for non-invasive molecular diagnostic services.
  • Advancements in automated nucleic acid extraction reduced laboratory contamination rates to under 2%, which significantly enhanced the reliability of genomic footprint analysis required for corporate environmental impact assessments.
  • The shift toward cloud-based bioinformatics pipelines decentralized complex metagenomic data processing, improving taxonomic identification speeds by over 35% and allowing smaller conservation agencies to adopt advanced ecological profiling tools.

Dive into Technavio’s robust research methodology, blending expert interviews, extensive data synthesis, and validated models for unparalleled Environmental Dna Market insights. See full methodology.

Market Scope
Page number 311
Base year 2025
Historic period 2020-2024
Forecast period 2026-2030
Growth momentum & CAGR Accelerate at a CAGR of 10%
Market growth 2026-2030 USD 655.6 million
Market structure Fragmented
YoY growth 2025-2026(%) 9.1%
Key countries US, Canada, Mexico, Germany, UK, France, Italy, The Netherlands, Spain, Russia, China, Japan, India, South Korea, Indonesia, Thailand, Singapore, Australia, Brazil, South Africa, UAE, Saudi Arabia and Turkey
Competitive landscape Leading Companies, Market Positioning of Companies, Competitive Strategies, and Industry Risks

Request Free Sample

Research Analyst Overview

  • The Environmental DNA Market is rapidly maturing as strategic boardroom decisions increasingly prioritize empirical ecological data for corporate compliance and risk mitigation. Organizations leverage metabarcoding analysis to generate verifiable biodiversity metrics, which directly influence infrastructure project budgeting and site selection.
  • By utilizing metagenomic shotgun sequencing, enterprise stakeholders can comprehensively evaluate entire microbial ecosystems without prior target knowledge, improving operational risk assessments by 20% compared to targeted sampling. This deep genetic insight allows compliance officers to proactively address environmental vulnerabilities before they trigger regulatory penalties.
  • The shift toward specialized amplicon sequencing provides high-resolution data on specific taxonomic groups, ensuring that critical habitat disruptions are minimized. Furthermore, the integration of nanopore sequencing technology delivers real-time molecular insights, significantly accelerating the biological auditing process for logistics and supply chain planning.
  • Implementing advanced ribosomal RNA targeting further refines these audits by distinguishing active, living organisms from legacy genetic debris. Ultimately, these sophisticated diagnostic capabilities transition ecological monitoring from a reactive regulatory burden into a proactive, data-driven strategy that safeguards both environmental integrity and corporate operational continuity.

What are the Key Data Covered in this Environmental Dna Market Research and Growth Report?

  • What is the expected growth of the Environmental Dna Market between 2026 and 2030?

    • USD 655.6 million, at a CAGR of 10%

  • What segmentation does the market report cover?

    • The report is segmented by Technology (Quantitative PCR, Metabarcoding, Next generation sequencing, Targeted species detection, and Digital PCR), Type (Water samples, Soil samples, Sediment samples, Biological residue samples, and Air samples), Component (Hardware, Software, and Services) and Geography (North America, Europe, Asia, Rest of World (ROW))

  • Which regions are analyzed in the report?

    • North America, Europe, Asia and Rest of World (ROW)

  • What are the key growth drivers and market challenges?

    • Proliferation of regulatory mandates and biodiversity conservation frameworks, Absence of universal standardization and vulnerability to contamination

  • Who are the major players in the Environmental Dna Market?

    • Agilent Technologies Inc., Bio Rad Laboratories Inc., Biome Makers Inc., Biomeme Inc., eDNAtec, EnviroDNA, Eurofins Scientific SE, Illumina Inc., Jonah Ventures, NatureMetrics, Oxford Nanopore Technologies, Promega Corp., QIAGEN N.V., SGS SA, Smith-Root Inc., SPYGEN, Stantec Inc., Thermo Fisher Scientific Inc., Trace Genomics Inc. and Zymo Research Corp.

Market Research Insights

  • The continuous evolution of environmental diagnostics demands highly accurate, scalable biological tracking systems. Incorporating agricultural runoff monitoring allows agrochemical firms to lower non-target toxicity incidents by 22%, ensuring precise environmental compliance. Advanced soil microbiome diagnostics provide critical insights, improving crop yield predictability by 15% through optimized microbial community profiling.
  • Modern water column filtration systems capture genetic material efficiently, achieving a 40% higher DNA yield compared to legacy sampling techniques. By transitioning to real-time genomic analysis, industrial facilities have improved their wastewater contamination detection rates by 28%. These measurable operational efficiencies reduce long-term ecological risks and streamline corporate sustainability reporting processes without requiring extensive manual field labor.

We can help! Our analysts can customize this environmental dna market research report to meet your requirements.

Get in touch

1. Executive Summary

1.1 Market overview

Executive Summary - Chart on Market Overview
Executive Summary - Data Table on Market Overview
Executive Summary - Chart on Global Market Characteristics
Executive Summary - Chart on Market by Geography
Executive Summary - Chart on Market Segmentation by Technology
Executive Summary - Chart on Market Segmentation by Type
Executive Summary - Chart on Market Segmentation by Component
Executive Summary - Chart on Incremental Growth
Executive Summary - Data Table on Incremental Growth
Executive Summary - Chart on Company Market Positioning

2. Technavio Analysis

2.1 Analysis of price sensitivity, lifecycle, customer purchase basket, adoption rates, and purchase criteria

2.2 Criticality of inputs and Factors of differentiation

Chart on Overview on criticality of inputs and factors of differentiation

2.3 Factors of disruption

Chart on Overview on factors of disruption

2.4 Impact of drivers and challenges

Chart on Impact of drivers and challenges in 2025 and 2030

3. Market Landscape

3.1 Market ecosystem

Chart on Parent Market
Data Table on - Parent Market

3.2 Market characteristics

Chart on Market characteristics analysis

3.3 Value chain analysis

Chart on Value chain analysis

4. Market Sizing

4.1 Market definition

Data Table on Offerings of companies included in the market definition

4.2 Market segment analysis

Market segments

4.3 Market size 2025

4.4 Market outlook: Forecast for 2025-2030

Chart on Global - Market size and forecast 2025-2030 ($ million)
Data Table on Global - Market size and forecast 2025-2030 ($ million)
Chart on Global Market: Year-over-year growth 2025-2030 (%)
Data Table on Global Market: Year-over-year growth 2025-2030 (%)

5. Historic Market Size

5.1 Global Environmental DNA Market 2020 - 2024

Historic Market Size - Data Table on Global Environmental DNA Market 2020 - 2024 ($ million)

5.2 Technology segment analysis 2020 - 2024

Historic Market Size - Technology Segment 2020 - 2024 ($ million)

5.3 Type segment analysis 2020 - 2024

Historic Market Size - Type Segment 2020 - 2024 ($ million)

5.4 Component segment analysis 2020 - 2024

Historic Market Size - Component Segment 2020 - 2024 ($ million)

5.5 Geography segment analysis 2020 - 2024

Historic Market Size - Geography Segment 2020 - 2024 ($ million)

5.6 Country segment analysis 2020 - 2024

Historic Market Size - Country Segment 2020 - 2024 ($ million)

6. Qualitative Analysis

6.1 Impact of AI on Global Environmental DNA Market

6.2 Impact of Geopolitical Conflicts on Global Environmental DNA Market

7. Five Forces Analysis

7.1 Five forces summary

Five forces analysis - Comparison between 2025 and 2030

7.2 Bargaining power of buyers

Bargaining power of buyers - Impact of key factors 2025 and 2030

7.3 Bargaining power of suppliers

Bargaining power of suppliers - Impact of key factors in 2025 and 2030

7.4 Threat of new entrants

Threat of new entrants - Impact of key factors in 2025 and 2030

7.5 Threat of substitutes

Threat of substitutes - Impact of key factors in 2025 and 2030

7.6 Threat of rivalry

Threat of rivalry - Impact of key factors in 2025 and 2030

7.7 Market condition

Chart on Market condition - Five forces 2025 and 2030

8. Market Segmentation by Technology

8.1 Market segments

Chart on Technology - Market share 2025-2030 (%)
Data Table on Technology - Market share 2025-2030 (%)

8.2 Comparison by Technology

Chart on Comparison by Technology
Data Table on Comparison by Technology

8.3 Quantitative PCR - Market size and forecast 2025-2030

Chart on Quantitative PCR - Market size and forecast 2025-2030 ($ million)
Data Table on Quantitative PCR - Market size and forecast 2025-2030 ($ million)
Chart on Quantitative PCR - Year-over-year growth 2025-2030 (%)
Data Table on Quantitative PCR - Year-over-year growth 2025-2030 (%)

8.4 Metabarcoding - Market size and forecast 2025-2030

Chart on Metabarcoding - Market size and forecast 2025-2030 ($ million)
Data Table on Metabarcoding - Market size and forecast 2025-2030 ($ million)
Chart on Metabarcoding - Year-over-year growth 2025-2030 (%)
Data Table on Metabarcoding - Year-over-year growth 2025-2030 (%)

8.5 Next generation sequencing - Market size and forecast 2025-2030

Chart on Next generation sequencing - Market size and forecast 2025-2030 ($ million)
Data Table on Next generation sequencing - Market size and forecast 2025-2030 ($ million)
Chart on Next generation sequencing - Year-over-year growth 2025-2030 (%)
Data Table on Next generation sequencing - Year-over-year growth 2025-2030 (%)

8.6 Targeted species detection - Market size and forecast 2025-2030

Chart on Targeted species detection - Market size and forecast 2025-2030 ($ million)
Data Table on Targeted species detection - Market size and forecast 2025-2030 ($ million)
Chart on Targeted species detection - Year-over-year growth 2025-2030 (%)
Data Table on Targeted species detection - Year-over-year growth 2025-2030 (%)

8.7 Digital PCR - Market size and forecast 2025-2030

Chart on Digital PCR - Market size and forecast 2025-2030 ($ million)
Data Table on Digital PCR - Market size and forecast 2025-2030 ($ million)
Chart on Digital PCR - Year-over-year growth 2025-2030 (%)
Data Table on Digital PCR - Year-over-year growth 2025-2030 (%)

8.8 Market opportunity by Technology

Market opportunity by Technology ($ million)
Data Table on Market opportunity by Technology ($ million)

9. Market Segmentation by Type

9.1 Market segments

Chart on Type - Market share 2025-2030 (%)
Data Table on Type - Market share 2025-2030 (%)

9.2 Comparison by Type

Chart on Comparison by Type
Data Table on Comparison by Type

9.3 Water samples - Market size and forecast 2025-2030

Chart on Water samples - Market size and forecast 2025-2030 ($ million)
Data Table on Water samples - Market size and forecast 2025-2030 ($ million)
Chart on Water samples - Year-over-year growth 2025-2030 (%)
Data Table on Water samples - Year-over-year growth 2025-2030 (%)

9.4 Soil samples - Market size and forecast 2025-2030

Chart on Soil samples - Market size and forecast 2025-2030 ($ million)
Data Table on Soil samples - Market size and forecast 2025-2030 ($ million)
Chart on Soil samples - Year-over-year growth 2025-2030 (%)
Data Table on Soil samples - Year-over-year growth 2025-2030 (%)

9.5 Sediment samples - Market size and forecast 2025-2030

Chart on Sediment samples - Market size and forecast 2025-2030 ($ million)
Data Table on Sediment samples - Market size and forecast 2025-2030 ($ million)
Chart on Sediment samples - Year-over-year growth 2025-2030 (%)
Data Table on Sediment samples - Year-over-year growth 2025-2030 (%)

9.6 Biological residue samples - Market size and forecast 2025-2030

Chart on Biological residue samples - Market size and forecast 2025-2030 ($ million)
Data Table on Biological residue samples - Market size and forecast 2025-2030 ($ million)
Chart on Biological residue samples - Year-over-year growth 2025-2030 (%)
Data Table on Biological residue samples - Year-over-year growth 2025-2030 (%)

9.7 Air samples - Market size and forecast 2025-2030

Chart on Air samples - Market size and forecast 2025-2030 ($ million)
Data Table on Air samples - Market size and forecast 2025-2030 ($ million)
Chart on Air samples - Year-over-year growth 2025-2030 (%)
Data Table on Air samples - Year-over-year growth 2025-2030 (%)

9.8 Market opportunity by Type

Market opportunity by Type ($ million)
Data Table on Market opportunity by Type ($ million)

10. Market Segmentation by Component

10.1 Market segments

Chart on Component - Market share 2025-2030 (%)
Data Table on Component - Market share 2025-2030 (%)

10.2 Comparison by Component

Chart on Comparison by Component
Data Table on Comparison by Component

10.3 Hardware - Market size and forecast 2025-2030

Chart on Hardware - Market size and forecast 2025-2030 ($ million)
Data Table on Hardware - Market size and forecast 2025-2030 ($ million)
Chart on Hardware - Year-over-year growth 2025-2030 (%)
Data Table on Hardware - Year-over-year growth 2025-2030 (%)

10.4 Software - Market size and forecast 2025-2030

Chart on Software - Market size and forecast 2025-2030 ($ million)
Data Table on Software - Market size and forecast 2025-2030 ($ million)
Chart on Software - Year-over-year growth 2025-2030 (%)
Data Table on Software - Year-over-year growth 2025-2030 (%)

10.5 Services - Market size and forecast 2025-2030

Chart on Services - Market size and forecast 2025-2030 ($ million)
Data Table on Services - Market size and forecast 2025-2030 ($ million)
Chart on Services - Year-over-year growth 2025-2030 (%)
Data Table on Services - Year-over-year growth 2025-2030 (%)

10.6 Market opportunity by Component

Market opportunity by Component ($ million)
Data Table on Market opportunity by Component ($ million)

11. Customer Landscape

11.1 Customer landscape overview

Analysis of price sensitivity, lifecycle, customer purchase basket, adoption rates, and purchase criteria

12. Geographic Landscape

12.1 Geographic segmentation

Chart on Market share by geography 2025-2030 (%)
Data Table on Market share by geography 2025-2030 (%)

12.2 Geographic comparison

Chart on Geographic comparison
Data Table on Geographic comparison

12.3 North America - Market size and forecast 2025-2030

Chart on North America - Market size and forecast 2025-2030 ($ million)
Data Table on North America - Market size and forecast 2025-2030 ($ million)
Chart on North America - Year-over-year growth 2025-2030 (%)
Data Table on North America - Year-over-year growth 2025-2030 (%)
Chart on Regional Comparison - North America
Data Table on Regional Comparison - North America

12.3.1 US - Market size and forecast 2025-2030

Chart on US - Market size and forecast 2025-2030 ($ million)
Data Table on US - Market size and forecast 2025-2030 ($ million)
Chart on US - Year-over-year growth 2025-2030 (%)
Data Table on US - Year-over-year growth 2025-2030 (%)

12.3.2 Canada - Market size and forecast 2025-2030

Chart on Canada - Market size and forecast 2025-2030 ($ million)
Data Table on Canada - Market size and forecast 2025-2030 ($ million)
Chart on Canada - Year-over-year growth 2025-2030 (%)
Data Table on Canada - Year-over-year growth 2025-2030 (%)

12.3.3 Mexico - Market size and forecast 2025-2030

Chart on Mexico - Market size and forecast 2025-2030 ($ million)
Data Table on Mexico - Market size and forecast 2025-2030 ($ million)
Chart on Mexico - Year-over-year growth 2025-2030 (%)
Data Table on Mexico - Year-over-year growth 2025-2030 (%)

12.4 Europe - Market size and forecast 2025-2030

Chart on Europe - Market size and forecast 2025-2030 ($ million)
Data Table on Europe - Market size and forecast 2025-2030 ($ million)
Chart on Europe - Year-over-year growth 2025-2030 (%)
Data Table on Europe - Year-over-year growth 2025-2030 (%)
Chart on Regional Comparison - Europe
Data Table on Regional Comparison - Europe

12.4.1 Germany - Market size and forecast 2025-2030

Chart on Germany - Market size and forecast 2025-2030 ($ million)
Data Table on Germany - Market size and forecast 2025-2030 ($ million)
Chart on Germany - Year-over-year growth 2025-2030 (%)
Data Table on Germany - Year-over-year growth 2025-2030 (%)

12.4.2 UK - Market size and forecast 2025-2030

Chart on UK - Market size and forecast 2025-2030 ($ million)
Data Table on UK - Market size and forecast 2025-2030 ($ million)
Chart on UK - Year-over-year growth 2025-2030 (%)
Data Table on UK - Year-over-year growth 2025-2030 (%)

12.4.3 France - Market size and forecast 2025-2030

Chart on France - Market size and forecast 2025-2030 ($ million)
Data Table on France - Market size and forecast 2025-2030 ($ million)
Chart on France - Year-over-year growth 2025-2030 (%)
Data Table on France - Year-over-year growth 2025-2030 (%)

12.4.4 Italy - Market size and forecast 2025-2030

Chart on Italy - Market size and forecast 2025-2030 ($ million)
Data Table on Italy - Market size and forecast 2025-2030 ($ million)
Chart on Italy - Year-over-year growth 2025-2030 (%)
Data Table on Italy - Year-over-year growth 2025-2030 (%)

12.4.5 The Netherlands - Market size and forecast 2025-2030

Chart on The Netherlands - Market size and forecast 2025-2030 ($ million)
Data Table on The Netherlands - Market size and forecast 2025-2030 ($ million)
Chart on The Netherlands - Year-over-year growth 2025-2030 (%)
Data Table on The Netherlands - Year-over-year growth 2025-2030 (%)

12.4.6 Spain - Market size and forecast 2025-2030

Chart on Spain - Market size and forecast 2025-2030 ($ million)
Data Table on Spain - Market size and forecast 2025-2030 ($ million)
Chart on Spain - Year-over-year growth 2025-2030 (%)
Data Table on Spain - Year-over-year growth 2025-2030 (%)

12.4.7 Russia - Market size and forecast 2025-2030

Chart on Russia - Market size and forecast 2025-2030 ($ million)
Data Table on Russia - Market size and forecast 2025-2030 ($ million)
Chart on Russia - Year-over-year growth 2025-2030 (%)
Data Table on Russia - Year-over-year growth 2025-2030 (%)

12.5 Asia - Market size and forecast 2025-2030

Chart on Asia - Market size and forecast 2025-2030 ($ million)
Data Table on Asia - Market size and forecast 2025-2030 ($ million)
Chart on Asia - Year-over-year growth 2025-2030 (%)
Data Table on Asia - Year-over-year growth 2025-2030 (%)
Chart on Regional Comparison - Asia
Data Table on Regional Comparison - Asia

12.5.1 China - Market size and forecast 2025-2030

Chart on China - Market size and forecast 2025-2030 ($ million)
Data Table on China - Market size and forecast 2025-2030 ($ million)
Chart on China - Year-over-year growth 2025-2030 (%)
Data Table on China - Year-over-year growth 2025-2030 (%)

12.5.2 Japan - Market size and forecast 2025-2030

Chart on Japan - Market size and forecast 2025-2030 ($ million)
Data Table on Japan - Market size and forecast 2025-2030 ($ million)
Chart on Japan - Year-over-year growth 2025-2030 (%)
Data Table on Japan - Year-over-year growth 2025-2030 (%)

12.5.3 India - Market size and forecast 2025-2030

Chart on India - Market size and forecast 2025-2030 ($ million)
Data Table on India - Market size and forecast 2025-2030 ($ million)
Chart on India - Year-over-year growth 2025-2030 (%)
Data Table on India - Year-over-year growth 2025-2030 (%)

12.5.4 South Korea - Market size and forecast 2025-2030

Chart on South Korea - Market size and forecast 2025-2030 ($ million)
Data Table on South Korea - Market size and forecast 2025-2030 ($ million)
Chart on South Korea - Year-over-year growth 2025-2030 (%)
Data Table on South Korea - Year-over-year growth 2025-2030 (%)

12.5.5 Indonesia - Market size and forecast 2025-2030

Chart on Indonesia - Market size and forecast 2025-2030 ($ million)
Data Table on Indonesia - Market size and forecast 2025-2030 ($ million)
Chart on Indonesia - Year-over-year growth 2025-2030 (%)
Data Table on Indonesia - Year-over-year growth 2025-2030 (%)

12.5.6 Thailand - Market size and forecast 2025-2030

Chart on Thailand - Market size and forecast 2025-2030 ($ million)
Data Table on Thailand - Market size and forecast 2025-2030 ($ million)
Chart on Thailand - Year-over-year growth 2025-2030 (%)
Data Table on Thailand - Year-over-year growth 2025-2030 (%)

12.5.7 Singapore - Market size and forecast 2025-2030

Chart on Singapore - Market size and forecast 2025-2030 ($ million)
Data Table on Singapore - Market size and forecast 2025-2030 ($ million)
Chart on Singapore - Year-over-year growth 2025-2030 (%)
Data Table on Singapore - Year-over-year growth 2025-2030 (%)

12.6 Rest of World (ROW) - Market size and forecast 2025-2030

Chart on Rest of World (ROW) - Market size and forecast 2025-2030 ($ million)
Data Table on Rest of World (ROW) - Market size and forecast 2025-2030 ($ million)
Chart on Rest of World (ROW) - Year-over-year growth 2025-2030 (%)
Data Table on Rest of World (ROW) - Year-over-year growth 2025-2030 (%)
Chart on Regional Comparison - Rest of World (ROW)
Data Table on Regional Comparison - Rest of World (ROW)

12.6.1 Australia - Market size and forecast 2025-2030

Chart on Australia - Market size and forecast 2025-2030 ($ million)
Data Table on Australia - Market size and forecast 2025-2030 ($ million)
Chart on Australia - Year-over-year growth 2025-2030 (%)
Data Table on Australia - Year-over-year growth 2025-2030 (%)

12.6.2 Brazil - Market size and forecast 2025-2030

Chart on Brazil - Market size and forecast 2025-2030 ($ million)
Data Table on Brazil - Market size and forecast 2025-2030 ($ million)
Chart on Brazil - Year-over-year growth 2025-2030 (%)
Data Table on Brazil - Year-over-year growth 2025-2030 (%)

12.6.3 South Africa - Market size and forecast 2025-2030

Chart on South Africa - Market size and forecast 2025-2030 ($ million)
Data Table on South Africa - Market size and forecast 2025-2030 ($ million)
Chart on South Africa - Year-over-year growth 2025-2030 (%)
Data Table on South Africa - Year-over-year growth 2025-2030 (%)

12.6.4 UAE - Market size and forecast 2025-2030

Chart on UAE - Market size and forecast 2025-2030 ($ million)
Data Table on UAE - Market size and forecast 2025-2030 ($ million)
Chart on UAE - Year-over-year growth 2025-2030 (%)
Data Table on UAE - Year-over-year growth 2025-2030 (%)

12.6.5 Saudi Arabia - Market size and forecast 2025-2030

Chart on Saudi Arabia - Market size and forecast 2025-2030 ($ million)
Data Table on Saudi Arabia - Market size and forecast 2025-2030 ($ million)
Chart on Saudi Arabia - Year-over-year growth 2025-2030 (%)
Data Table on Saudi Arabia - Year-over-year growth 2025-2030 (%)

12.6.6 Turkey - Market size and forecast 2025-2030

Chart on Turkey - Market size and forecast 2025-2030 ($ million)
Data Table on Turkey - Market size and forecast 2025-2030 ($ million)
Chart on Turkey - Year-over-year growth 2025-2030 (%)
Data Table on Turkey - Year-over-year growth 2025-2030 (%)

12.7 Market opportunity by geography

Market opportunity by geography ($ million)
Data Tables on Market opportunity by geography ($ million)

13. Drivers, Challenges, and Opportunity

13.1 Market drivers

Proliferation of regulatory mandates and biodiversity conservation frameworks
Technological breakthroughs in next-generation sequencing
Escalating demand for invasive species management and marine resource protection

13.2 Market challenges

Absence of universal standardization and vulnerability to contamination
Spatial-temporal uncertainty and presence-absence dilemma
High initial capital costs and scarcity of specialized bioinformatic expertise

13.3 Impact of drivers and challenges

Impact of drivers and challenges in 2025 and 2030

13.4 Market opportunities

Integration of eDNA with biosurveillance for early pathogen detection
Commercialization of eDNA services for corporate ESG auditing
Standardization of reference databases and open-access bioinformatics platforms

14. Competitive Landscape

14.1 Overview

14.2

Overview on criticality of inputs and factors of differentiation

14.3 Landscape disruption

Overview on factors of disruption

14.4 Industry risks

Impact of key risks on business

15. Competitive Analysis

15.1 Companies profiled

Companies covered

15.2 Company ranking index

15.3 Market positioning of companies

Matrix on companies position and classification

15.4 Biome Makers Inc.

Biome Makers Inc. - Overview
Biome Makers Inc. - Product / Service
Biome Makers Inc. - Key offerings
SWOT

15.5 Biomeme Inc.

Biomeme Inc. - Overview
Biomeme Inc. - Product / Service
Biomeme Inc. - Key offerings
SWOT

15.6 eDNAtec

eDNAtec - Overview
eDNAtec - Product / Service
eDNAtec - Key offerings
SWOT

15.7 EnviroDNA

EnviroDNA - Overview
EnviroDNA - Product / Service
EnviroDNA - Key offerings
SWOT

15.8 Eurofins Scientific SE

Eurofins Scientific SE - Overview
Eurofins Scientific SE - Business segments
Eurofins Scientific SE - Key offerings
Eurofins Scientific SE - Segment focus
SWOT

15.9 Illumina Inc.

Illumina Inc. - Overview
Illumina Inc. - Business segments
Illumina Inc. - Key news
Illumina Inc. - Key offerings
Illumina Inc. - Segment focus
SWOT

15.10 Jonah Ventures

Jonah Ventures - Overview
Jonah Ventures - Product / Service
Jonah Ventures - Key offerings
SWOT

15.11 NatureMetrics

NatureMetrics - Overview
NatureMetrics - Product / Service
NatureMetrics - Key offerings
SWOT

15.12 Oxford Nanopore Technologies

Oxford Nanopore Technologies - Overview
Oxford Nanopore Technologies - Product / Service
Oxford Nanopore Technologies - Key offerings
SWOT

15.13 QIAGEN N.V.

QIAGEN N.V. - Overview
QIAGEN N.V. - Product / Service
QIAGEN N.V. - Key offerings
SWOT

15.14 Smith-Root Inc.

Smith-Root Inc. - Overview
Smith-Root Inc. - Product / Service
Smith-Root Inc. - Key offerings
SWOT

15.15 SPYGEN

SPYGEN - Overview
SPYGEN - Product / Service
SPYGEN - Key offerings
SWOT

15.16 Thermo Fisher Scientific Inc.

Thermo Fisher Scientific Inc. - Overview
Thermo Fisher Scientific Inc. - Business segments
Thermo Fisher Scientific Inc. - Key news
Thermo Fisher Scientific Inc. - Key offerings
Thermo Fisher Scientific Inc. - Segment focus
SWOT

15.17 Trace Genomics Inc.

Trace Genomics Inc. - Overview
Trace Genomics Inc. - Product / Service
Trace Genomics Inc. - Key offerings
SWOT

15.18 Zymo Research Corp.

Zymo Research Corp. - Overview
Zymo Research Corp. - Product / Service
Zymo Research Corp. - Key offerings
SWOT

16. Appendix

16.1 Scope of the report

Market definition
Objectives
Notes and caveats

16.2 Inclusions and exclusions checklist

Inclusions checklist
Exclusions checklist

16.3 Currency conversion rates for US$

16.4 Research methodology

16.5 Data procurement

Information sources

16.6 Data validation

16.7 Validation techniques employed for market sizing

16.8 Data synthesis

16.9 360 degree market analysis

16.10 List of abbreviations

Research Methodology

Technavio presents a detailed picture of the market by way of study, synthesis, and summation of data from multiple sources. The analysts have presented the various facets of the market with a particular focus on identifying the key industry influencers. The data thus presented is comprehensive, reliable, and the result of extensive research, both primary and secondary.

INFORMATION SOURCES

Primary sources

  • Manufacturers and suppliers
  • Channel partners
  • Industry experts
  • Strategic decision makers

Secondary sources

  • Industry journals and periodicals
  • Government data
  • Financial reports of key industry players
  • Historical data
  • Press releases

DATA ANALYSIS

Data Synthesis

  • Collation of data
  • Estimation of key figures
  • Analysis of derived insights

Data Validation

  • Triangulation with data models
  • Reference against proprietary databases
  • Corroboration with industry experts

REPORT WRITING

Qualitative

  • Market drivers
  • Market challenges
  • Market trends
  • Five forces analysis

Quantitative

  • Market size and forecast
  • Market segmentation
  • Geographical insights
  • Competitive landscape

Interested in this report?

Get your sample now to see our research methodology and insights!

Download Now

Frequently Asked Questions

Environmental Dna market growth will increase by USD 655.6 million during 2026-2030.

The Environmental Dna market is expected to grow at a CAGR of 10% during 2026-2030.

Environmental Dna market is segmented by Technology (Quantitative PCR, Metabarcoding, Next generation sequencing, Targeted species detection, Digital PCR) Type (Water samples, Soil samples, Sediment samples, Biological residue samples, Air samples) Component (Hardware, Software, Services)

Agilent Technologies Inc., Bio Rad Laboratories Inc., Biome Makers Inc., Biomeme Inc., eDNAtec, EnviroDNA, Eurofins Scientific SE, Illumina Inc., Jonah Ventures, NatureMetrics, Oxford Nanopore Technologies, Promega Corp., QIAGEN N.V., SGS SA, Smith-Root Inc., SPYGEN, Stantec Inc., Thermo Fisher Scientific Inc., Trace Genomics Inc., Zymo Research Corp. are a few of the key vendors in the Environmental Dna market.

North America will register the highest growth rate of 34.2% among the other regions. Therefore, the Environmental Dna market in North America is expected to garner significant business opportunities for the vendors during the forecast period.

US, Canada, Mexico, Germany, UK, France, Italy, The Netherlands, Spain, Russia, China, Japan, India, South Korea, Indonesia, Thailand, Singapore, Australia, Brazil, South Africa, UAE, Saudi Arabia, Turkey

  • Proliferation of regulatory mandates and biodiversity conservation frameworks is the driving factor this market.

The Environmental Dna market vendors should focus on grabbing business opportunities from the Technology segment as it accounted for the largest market share in the base year.
RIA - Research AI Assistant
Ask RIA
