
Event Management As A Service Market Analysis, Size, and Forecast 2026-2030: North America (US, Canada, and Mexico), Europe (Germany, UK, and France), APAC (China, Japan, and South Korea), Middle East and Africa (UAE, Saudi Arabia, and South Africa), South America (Brazil, Argentina, and Chile), and Rest of World (ROW)

Event Management As A Service Market Analysis, Size, and Forecast 2026-2030:
North America (US, Canada, and Mexico), Europe (Germany, UK, and France), APAC (China, Japan, and South Korea), Middle East and Africa (UAE, Saudi Arabia, and South Africa), South America (Brazil, Argentina, and Chile), and Rest of World (ROW)

Published: Oct 2026 308 Pages SKU: IRTNTR70862

Market Overview at a Glance

$780.1 Mn
Market Opportunity
13%
CAGR 2025 - 2030
45.3%
North America Growth
$485.9 Mn
Corporate segment 2024

Event Management As A Service Market Size 2026-2030

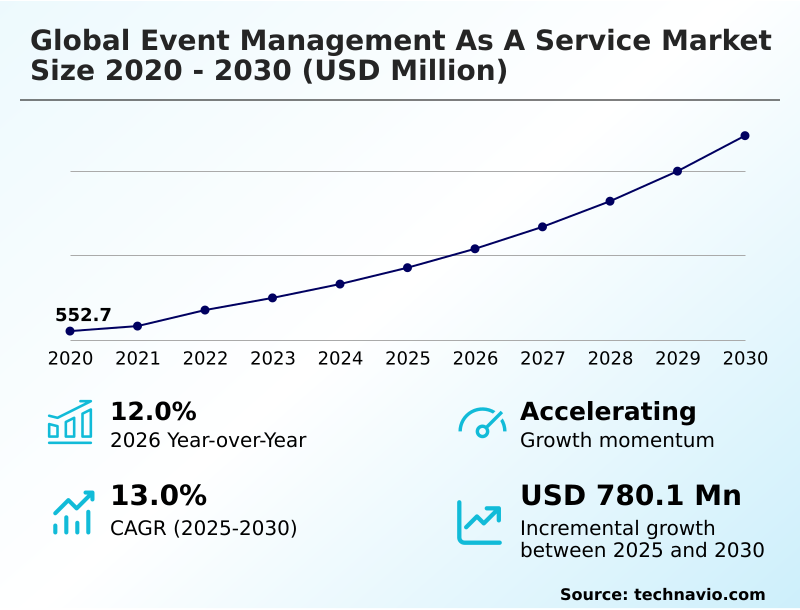
The event management as a service market size is valued to increase by USD 780.1 million, at a CAGR of 13% from 2025 to 2030. Proliferation of hybrid and virtual engagement models will drive the event management as a service market.

Major Market Trends & Insights

  • North America dominated the market and accounted for a 45.3% growth during the forecast period.
  • By End-user - Corporate segment was valued at USD 485.9 million in 2024
  • By Type - Pre-event services segment accounted for the largest market revenue share in 2024

Market Size & Forecast

  • Market Opportunities: USD 1.15 billion
  • Market Future Opportunities: USD 780.1 million
  • CAGR from 2025 to 2030 : 13%

Market Summary

  • The Event Management As A Service Market is undergoing a rapid architectural evolution driven by the convergence of physical logistics and digital engagement platforms. Modern corporate operations now treat event execution not as isolated administrative tasks, but as integrated commercial workflows.
  • For instance, a multinational financial institution synchronizing a decentralized partner summit relies on unified digital infrastructure to manage everything from attendee credentialing to post-session follow-ups without manual data handoffs. This centralized approach reduces administrative labor hours by up to 35%, significantly impacting overall operational efficiency.
  • The primary driver of this market is the proliferation of hybrid environments, which allows organizers to expand audience reach while maintaining physical event continuity. Conversely, the market faces a substantial challenge in the form of strict data privacy and regulatory compliance. Managing complex biometric and financial data across multiple international jurisdictions requires robust security protocols.
  • Without adequate data governance, organizations risk severe financial penalties and reputational damage. Ultimately, the Event Management As A Service Market continues to redefine how enterprises orchestrate professional gatherings.

What will be the Size of the Event Management As A Service Market during the forecast period?
Get Key Insights on Market Forecast (PDF) Get Free Sample

How is the Event Management As A Service Market Segmented?

The event management as a service industry research report provides comprehensive data (region-wise segment analysis), with forecasts and estimates in "USD million" for the period 2026-2030, as well as historical data from 2020-2024 for the following segments.

  • End-user
    • Corporate
    • PO and NGO
    • Individuals
  • Type
    • Pre-event services
    • Onsite services
    • Post-event services
  • Application
    • Venue and logistics
    • Event planning
    • Event marketing
    • Event technology
    • Attendee registration
  • Geography
    • North America
      • US
      • Canada
      • Mexico
    • Europe
      • Germany
      • UK
      • France
      • Italy
      • Spain
      • The Netherlands
    • APAC
      • China
      • Japan
      • South Korea
      • Australia
      • Singapore
      • India
    • Middle East and Africa
      • UAE
      • Saudi Arabia
      • South Africa
      • Israel
      • Turkey
    • South America
      • Brazil
      • Argentina
      • Chile

By End-user Insights

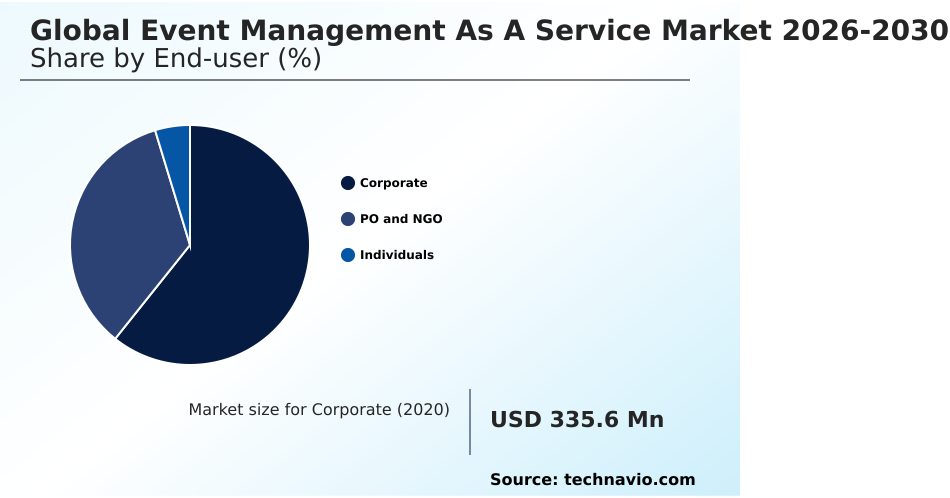
The corporate segment is estimated to witness significant growth during the forecast period.

The corporate segment dictates the most technologically rigorous operational standards within the Event Management As A Service Market. Large enterprises deploy sophisticated cloud-native architecture to seamlessly manage massive user conferences and partner symposiums.

Planners demand deep integration with customer databases, utilizing automated segmentation engines to target audiences efficiently.

To accelerate on-site logistics, corporate buyers enforce the use of contactless turnstile check-in and radio frequency identification verification, minimizing peak entry congestion by up to 32%.

The incorporation of bilingual credential processing and multi-tier ticketing engines allows for highly flexible access control across diverse international delegate profiles.

Organizations also rely heavily on interactive digital floor signage for navigation, session sentiment scoring for instant feedback, and secure digital content archiving to extend the lifespan of valuable corporate presentations.
Get Free Sample

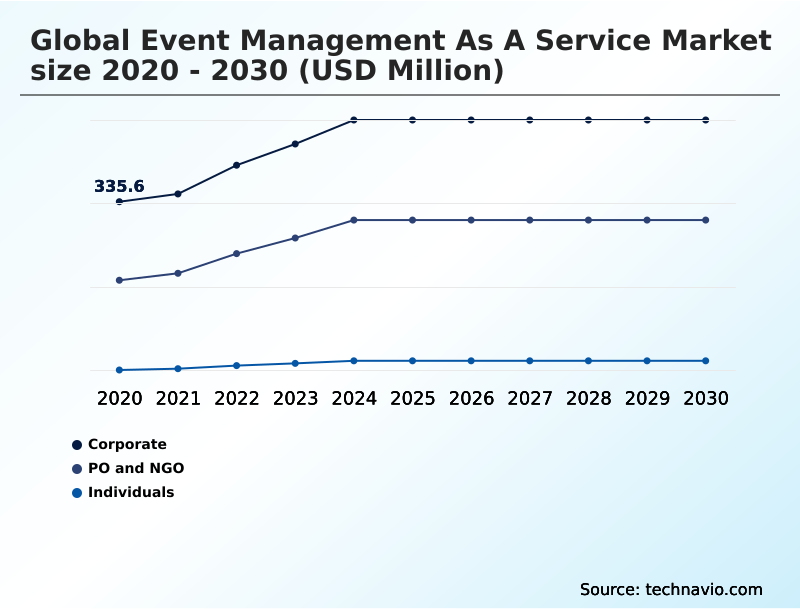
The Corporate segment was valued at USD 485.9 million in 2024 and showed a gradual increase during the forecast period.
Get Free Sample

Regional Analysis

North America is estimated to contribute 45.3% to the growth of the global market during the forecast period.Technavio’s analysts have elaborately explained the regional trends and drivers that shape the market during the forecast period.
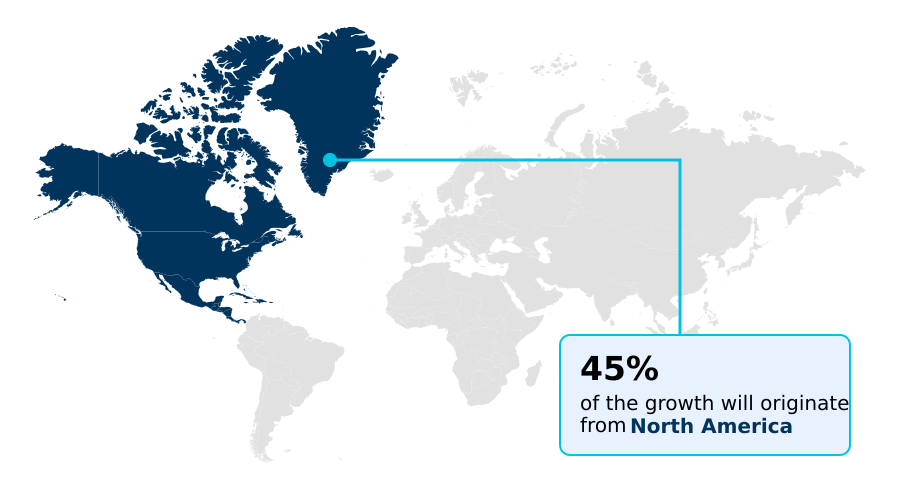
See How Event Management As A Service Market Demand is Rising in North America Get Free Sample

The geographic landscape of the Event Management As A Service Market highlights distinct operational priorities between North America and Europe.

North America leads in deploying expansive experiential marketing automation and lead retrieval hardware to maximize commercial attribution, achieving a 22% higher post-session sales attribution rate than other regions.

Utilizing attendee behavioral analytics and real-time spatial analytics, North American organizers aggressively optimize floor plans and sponsorships. Conversely, Europe dictates the market's security and sustainability baseline.

European organizations utilize carbon calculation tools and sustainable event governance frameworks at a 30% higher frequency to meet stringent reporting standards. In both territories, the transition to a digital first strategy reduces administrative overhead by nearly 18%.

Planners dynamically adapt by leveraging predictive scheduling algorithms and secure payment processing gateways to accommodate complex consumer demands.

Market Dynamics

Our researchers analyzed the data with 2025 as the base year, along with the key drivers, trends, and challenges. A holistic analysis of drivers will help companies refine their marketing strategies to gain a competitive advantage.

  • The operational landscape of the Event Management As A Service Market is continuously refined by the integration of sophisticated automation and specialized digital planning frameworks. Large-scale corporate organizers face significant logistical hurdles when coordinating international attendees and multifaceted event schedules.
  • To mitigate these bottlenecks, platforms now incorporate cross border convention management tools that seamlessly process multiple currencies and align with regional compliance standards. A major component of this evolution is the deployment of algorithm based session schedule optimization, which resolves room conflicts and balances delegate traffic much faster than manual plotting.
  • By streamlining attendee flow, organizers report a 28% improvement in overall scheduling efficiency. Simultaneously, the physical design of venues is being reimagined through virtual exhibition hall spatial design, allowing planners to simulate booth placements and maximize sponsor visibility long before physical load-in begins.
  • When event demand exceeds venue capacity, the activation of an automated waitlist procedure integration ensures that canceled reservations are instantly reallocated without administrative intervention, safeguarding attendance targets. Furthermore, enterprise governance mandates increasingly require strict environmental accountability.
  • The implementation of carbon footprint tracking reporting features enables organizations to measure travel emissions and venue energy consumption precisely, ensuring modern gatherings remain commercially impactful and environmentally responsible.
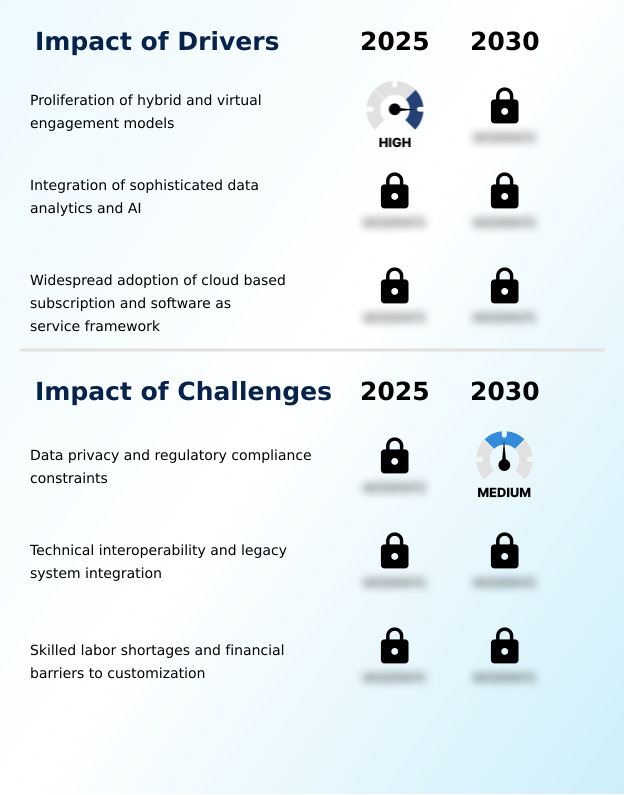
What are the key market drivers leading to the rise in the adoption of Event Management As A Service Industry?

  • The proliferation of hybrid and virtual engagement models serves as the primary catalyst accelerating market expansion by enabling highly inclusive, boundaryless audience participation.

  • The proliferation of sophisticated hybrid event infrastructure acts as a principal driver propelling the Event Management As A Service Market. Organizations increasingly demand platforms that seamlessly unify physical attendance with remote access.
  • The implementation of hybrid broadcast latency reduction ensures that virtual participants experience real-time synchronization, expanding audience reach by an average of 35%. Integrating enterprise resource planning integration and dynamic agenda publishing empowers administrative teams to synchronize operational milestones automatically.
  • The deployment of on-demand badge printing, digital wallet passes, and optical barcode scanning eliminates lobby bottlenecks, cutting credentialing wait times by 40%. These technological upgrades, combined with decentralized team coordination and offline operational resilience, drastically lower logistical barriers.
  • Advanced automated request-for-proposal workflows further streamline supplier sourcing, driving immense efficiency across corporate event planning.

What are the market trends shaping the Event Management As A Service Industry?

  • The emergence of hyper-personalization through AI and predictive analytics represents a defining shift in modern engagement strategies. This technological advancement empowers organizers to anticipate audience preferences and deliver highly customized attendee experiences.

  • The Event Management As A Service Market is witnessing a profound shift toward intelligent automation and hyper-personalized delegate experiences. Modern organizers are rapidly adopting predictive catering tools and intelligent peer matchmaking algorithms to align exact attendee preferences with onsite provisions. This behavioral shift addresses the demand for curated professional networking.
  • By deploying dynamic three-dimensional virtualization, venue planners evaluate spatial configurations remotely, reducing onsite inspection costs by 24%. Additionally, the incorporation of gamified engagement modules alongside virtual audience networking lounges elevates digital participation, improving session retention rates by 18%. Planners utilizing immersive virtual reality elements and real-time audience polling report a substantial increase in engagement metrics.
  • The adoption of a digital twin venue mapping strategy paired with user centric networking interfaces and automated registration recovery enables organizers to construct precise, resilient operational frameworks.

What challenges does the Event Management As A Service Industry face during its growth?

  • Strict data privacy requirements and complex regulatory compliance constraints present significant operational hurdles for the global deployment of centralized digital platforms.

  • Strict data privacy constraints and the complexity of legacy system interoperability impose significant hurdles on the Event Management As A Service Market. Integrating modern event software with outdated corporate mainframes often limits return on engagement measurement capabilities. Securing physical perimeters with facial recognition access control and biometric participant identification demands intensive auditing, increasing initial setup costs by nearly 15%.
  • Furthermore, executing localized digital payment processing and cross-border transaction engines requires rigorous adherence to diverse international financial regulations. Achieving strict regional data laws often delays platform deployment by up to 25%. Without robust end-to-end encryption protocols, single sign-on authentication, and strict enterprise grade access control, organizations remain vulnerable to data breaches, making risk-averse enterprises hesitant to adopt centralized digital architectures.

Exclusive Technavio Analysis on Customer Landscape

The event management as a service market forecasting report includes the adoption lifecycle of the market, covering from the innovator’s stage to the laggard’s stage. It focuses on adoption rates in different regions based on penetration. Furthermore, the event management as a service market report also includes key purchase criteria and drivers of price sensitivity to help companies evaluate and develop their market growth analysis strategies.
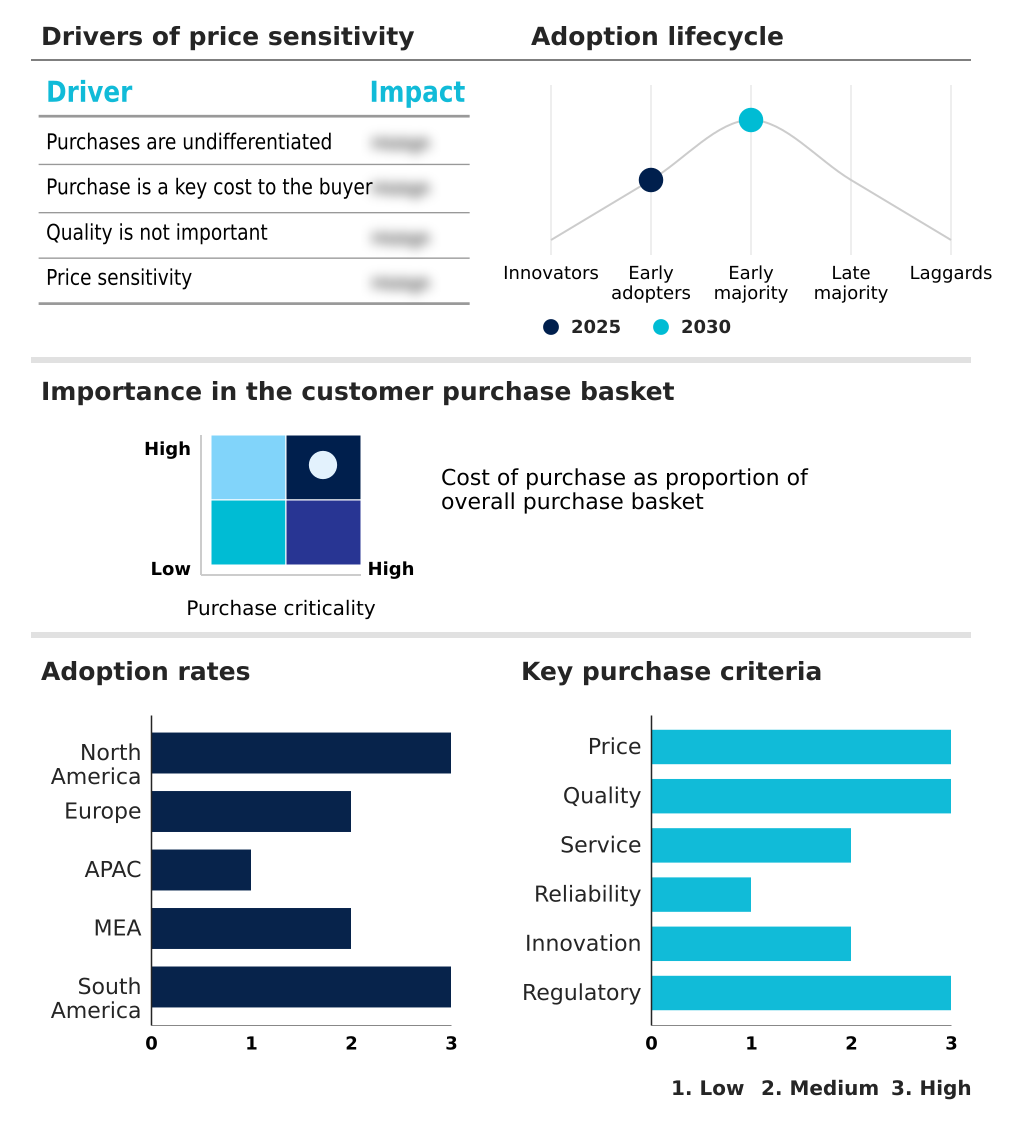
Customer Landscape of Event Management As A Service Industry

Competitive Landscape

Companies are implementing various strategies, such as strategic alliances, event management as a service market forecast, partnerships, mergers and acquisitions, geographical expansion, and product/service launches, to enhance their presence in the industry.

5Touch Solution Inc. - The company delivers an integrated event management as a service platform, featuring customizable virtual spaces, live streaming capabilities, and robust attendee engagement tools designed for large-scale professional conferences.

The industry research and growth report includes detailed analyses of the competitive landscape of the market and information about key companies, including:

  • 5Touch Solution Inc.
  • Accelevents Inc.
  • Airmeet Inc.
  • BigMarker Inc.
  • Bizzabo Inc.
  • Brella Ltd.
  • Canapii Ltd
  • Certain Inc.
  • Cvent Inc
  • EventsAIR Pty Ltd
  • InEvent Inc.
  • RainFocus LLC
  • RingCentral Inc.
  • SplashThat.com Inc.
  • SpotMe SA
  • Stova Group
  • Swapcard SAS
  • vFairs LLC
  • Webconnex LLC
  • Whova Inc.

Qualitative and quantitative analysis of companies has been conducted to help clients understand the wider business environment as well as the strengths and weaknesses of key industry players. Data is qualitatively analyzed to categorize companies as pure play, category-focused, industry-focused, and diversified; it is quantitatively analyzed to categorize companies as dominant, leading, strong, tentative, and weak.

Recent Development and News in Event management as a service market

  • In the Systems Software industry, the transition toward decentralized team networks has established new baseline expectations for digital interactivity, increasing adoption of remote collaboration workflows in the Event Management As A Service market.
  • The enforcement of localized data governance standards across cloud infrastructure environments has compelled software providers to embed rigorous encryption protocols, directly shifting demand toward platforms offering strict data residency compliance.
  • The widespread integration of predictive analytics and automated workflows has streamlined resource allocation, directly impacting Event Management As A Service demand by enabling intelligent scheduling frameworks for large-scale gatherings.
  • The adoption of ESG tracking mechanisms within broad enterprise application suites has created a mandate for integrated emission calculation tools, forcing Event Management As A Service providers to supply eco-friendly governance modules.

Dive into Technavio’s robust research methodology, blending expert interviews, extensive data synthesis, and validated models for unparalleled Event Management As A Service Market insights. See full methodology.

Market Scope
Page number 308
Base year 2025
Historic period 2020-2024
Forecast period 2026-2030
Growth momentum & CAGR Accelerate at a CAGR of 13%
Market growth 2026-2030 USD 780.1 million
Market structure Fragmented
YoY growth 2025-2026(%) 12.0%
Key countries US, Canada, Mexico, Germany, UK, France, Italy, Spain, The Netherlands, China, Japan, South Korea, Australia, Singapore, India, UAE, Saudi Arabia, South Africa, Israel, Turkey, Brazil, Argentina and Chile
Competitive landscape Leading Companies, Market Positioning of Companies, Competitive Strategies, and Industry Risks

Request Free Sample

Research Analyst Overview

  • The Event Management As A Service Market reflects a structural transition from fragmented logistical coordination to unified, data-driven engagement ecosystems. Enterprise leadership teams increasingly view event platforms as critical components of their commercial strategy, directly impacting customer acquisition and product positioning.
  • The deployment of automated segmentation features enables marketing divisions to deliver hyper-personalized session recommendations and target audience outreach with exceptional precision. Consequently, organizations utilizing these intelligent platforms report a 30% reduction in pre-event administrative processing time. To elevate the attendee experience, organizers actively utilize interactive floor signage and contactless check-in systems to eliminate physical friction at venue entry points.
  • The implementation of tiered ticketing structures allows for highly flexible pricing and access control tailored to distinct delegate profiles. Furthermore, the integration of session sentiment tracking and post-session sales tracking provides executives with definitive metrics to evaluate commercial success and sponsor return on investment.
  • By consolidating these advanced capabilities, platforms empower organizations to orchestrate seamless, secure, and commercially viable professional gatherings.

What are the Key Data Covered in this Event Management As A Service Market Research and Growth Report?

  • What is the expected growth of the Event Management As A Service Market between 2026 and 2030?

    • USD 780.1 million, at a CAGR of 13%

  • What segmentation does the market report cover?

    • The report is segmented by End-user (Corporate, PO and NGO, and Individuals), Type (Pre-event services, Onsite services, and Post-event services), Application (Venue and logistics, Event planning, Event marketing, Event technology, and Attendee registration) and Geography (North America, Europe, APAC, Middle East and Africa, South America)

  • Which regions are analyzed in the report?

    • North America, Europe, APAC, Middle East and Africa and South America

  • What are the key growth drivers and market challenges?

    • Proliferation of hybrid and virtual engagement models, Data privacy and regulatory compliance constraints

  • Who are the major players in the Event Management As A Service Market?

    • 5Touch Solution Inc., Accelevents Inc., Airmeet Inc., BigMarker Inc., Bizzabo Inc., Brella Ltd., Canapii Ltd, Certain Inc., Cvent Inc, EventsAIR Pty Ltd, InEvent Inc., RainFocus LLC, RingCentral Inc., SplashThat.com Inc., SpotMe SA, Stova Group, Swapcard SAS, vFairs LLC, Webconnex LLC and Whova Inc.

Market Research Insights

  • The Event Management As A Service Market represents a pivotal shift toward dynamic, data-driven attendee coordination. By utilizing advanced digital workflows, organizers streamline initial site selection and logistics. The integration of modern identification technologies reduces peak venue entry times by 40%, optimizing front-of-house operations.
  • Furthermore, sophisticated digital content storage allows enterprises to extend the lifespan of their recorded sessions, increasing overall content utilization by nearly 25%. Modern platforms also feature real-time spatial evaluation tools to analyze traffic flows and booth engagement, delivering measurable improvements in sponsor retention rates and operational efficiency across large-scale physical and digital exhibitions.
  • These systems establish a robust operational foundation for continuous audience engagement.

We can help! Our analysts can customize this event management as a service market research report to meet your requirements.

Get in touch

1. Executive Summary

1.1 Market overview

Executive Summary - Chart on Market Overview
Executive Summary - Data Table on Market Overview
Executive Summary - Chart on Global Market Characteristics
Executive Summary - Chart on Market by Geography
Executive Summary - Chart on Market Segmentation by End-user
Executive Summary - Chart on Market Segmentation by Type
Executive Summary - Chart on Market Segmentation by Application
Executive Summary - Chart on Incremental Growth
Executive Summary - Data Table on Incremental Growth
Executive Summary - Chart on Company Market Positioning

2. Technavio Analysis

2.1 Analysis of price sensitivity, lifecycle, customer purchase basket, adoption rates, and purchase criteria

2.2 Criticality of inputs and Factors of differentiation

Chart on Overview on criticality of inputs and factors of differentiation

2.3 Factors of disruption

Chart on Overview on factors of disruption

2.4 Impact of drivers and challenges

Chart on Impact of drivers and challenges in 2025 and 2030

3. Market Landscape

3.1 Market ecosystem

Chart on Parent Market
Data Table on - Parent Market

3.2 Market characteristics

Chart on Market characteristics analysis

3.3 Value chain analysis

Chart on Value chain analysis

4. Market Sizing

4.1 Market definition

Data Table on Offerings of companies included in the market definition

4.2 Market segment analysis

Market segments

4.3 Market size 2025

4.4 Market outlook: Forecast for 2025-2030

Chart on Global - Market size and forecast 2025-2030 ($ million)
Data Table on Global - Market size and forecast 2025-2030 ($ million)
Chart on Global Market: Year-over-year growth 2025-2030 (%)
Data Table on Global Market: Year-over-year growth 2025-2030 (%)

5. Historic Market Size

5.1 Global Event Management As A Service Market 2020 - 2024

Historic Market Size - Data Table on Global Event Management As A Service Market 2020 - 2024 ($ million)

5.2 End-user segment analysis 2020 - 2024

Historic Market Size - End-user Segment 2020 - 2024 ($ million)

5.3 Type segment analysis 2020 - 2024

Historic Market Size - Type Segment 2020 - 2024 ($ million)

5.4 Application segment analysis 2020 - 2024

Historic Market Size - Application Segment 2020 - 2024 ($ million)

5.5 Geography segment analysis 2020 - 2024

Historic Market Size - Geography Segment 2020 - 2024 ($ million)

5.6 Country segment analysis 2020 - 2024

Historic Market Size - Country Segment 2020 - 2024 ($ million)

6. Qualitative Analysis

6.1 Impact of AI on Global Event Management as a Service Market

6.2 Impact of Geopolitical Conflicts on Global Event Management as a Service Market

7. Five Forces Analysis

7.1 Five forces summary

Five forces analysis - Comparison between 2025 and 2030

7.2 Bargaining power of buyers

Bargaining power of buyers - Impact of key factors 2025 and 2030

7.3 Bargaining power of suppliers

Bargaining power of suppliers - Impact of key factors in 2025 and 2030

7.4 Threat of new entrants

Threat of new entrants - Impact of key factors in 2025 and 2030

7.5 Threat of substitutes

Threat of substitutes - Impact of key factors in 2025 and 2030

7.6 Threat of rivalry

Threat of rivalry - Impact of key factors in 2025 and 2030

7.7 Market condition

Chart on Market condition - Five forces 2025 and 2030

8. Market Segmentation by End-user

8.1 Market segments

Chart on End-user - Market share 2025-2030 (%)
Data Table on End-user - Market share 2025-2030 (%)

8.2 Comparison by End-user

Chart on Comparison by End-user
Data Table on Comparison by End-user

8.3 Corporate - Market size and forecast 2025-2030

Chart on Corporate - Market size and forecast 2025-2030 ($ million)
Data Table on Corporate - Market size and forecast 2025-2030 ($ million)
Chart on Corporate - Year-over-year growth 2025-2030 (%)
Data Table on Corporate - Year-over-year growth 2025-2030 (%)

8.4 PO and NGO - Market size and forecast 2025-2030

Chart on PO and NGO - Market size and forecast 2025-2030 ($ million)
Data Table on PO and NGO - Market size and forecast 2025-2030 ($ million)
Chart on PO and NGO - Year-over-year growth 2025-2030 (%)
Data Table on PO and NGO - Year-over-year growth 2025-2030 (%)

8.5 Individuals - Market size and forecast 2025-2030

Chart on Individuals - Market size and forecast 2025-2030 ($ million)
Data Table on Individuals - Market size and forecast 2025-2030 ($ million)
Chart on Individuals - Year-over-year growth 2025-2030 (%)
Data Table on Individuals - Year-over-year growth 2025-2030 (%)

8.6 Market opportunity by End-user

Market opportunity by End-user ($ million)
Data Table on Market opportunity by End-user ($ million)

9. Market Segmentation by Type

9.1 Market segments

Chart on Type - Market share 2025-2030 (%)
Data Table on Type - Market share 2025-2030 (%)

9.2 Comparison by Type

Chart on Comparison by Type
Data Table on Comparison by Type

9.3 Pre-event services - Market size and forecast 2025-2030

Chart on Pre-event services - Market size and forecast 2025-2030 ($ million)
Data Table on Pre-event services - Market size and forecast 2025-2030 ($ million)
Chart on Pre-event services - Year-over-year growth 2025-2030 (%)
Data Table on Pre-event services - Year-over-year growth 2025-2030 (%)

9.4 Onsite services - Market size and forecast 2025-2030

Chart on Onsite services - Market size and forecast 2025-2030 ($ million)
Data Table on Onsite services - Market size and forecast 2025-2030 ($ million)
Chart on Onsite services - Year-over-year growth 2025-2030 (%)
Data Table on Onsite services - Year-over-year growth 2025-2030 (%)

9.5 Post-event services - Market size and forecast 2025-2030

Chart on Post-event services - Market size and forecast 2025-2030 ($ million)
Data Table on Post-event services - Market size and forecast 2025-2030 ($ million)
Chart on Post-event services - Year-over-year growth 2025-2030 (%)
Data Table on Post-event services - Year-over-year growth 2025-2030 (%)

9.6 Market opportunity by Type

Market opportunity by Type ($ million)
Data Table on Market opportunity by Type ($ million)

10. Market Segmentation by Application

10.1 Market segments

Chart on Application - Market share 2025-2030 (%)
Data Table on Application - Market share 2025-2030 (%)

10.2 Comparison by Application

Chart on Comparison by Application
Data Table on Comparison by Application

10.3 Venue and logistics - Market size and forecast 2025-2030

Chart on Venue and logistics - Market size and forecast 2025-2030 ($ million)
Data Table on Venue and logistics - Market size and forecast 2025-2030 ($ million)
Chart on Venue and logistics - Year-over-year growth 2025-2030 (%)
Data Table on Venue and logistics - Year-over-year growth 2025-2030 (%)

10.4 Event planning - Market size and forecast 2025-2030

Chart on Event planning - Market size and forecast 2025-2030 ($ million)
Data Table on Event planning - Market size and forecast 2025-2030 ($ million)
Chart on Event planning - Year-over-year growth 2025-2030 (%)
Data Table on Event planning - Year-over-year growth 2025-2030 (%)

10.5 Event marketing - Market size and forecast 2025-2030

Chart on Event marketing - Market size and forecast 2025-2030 ($ million)
Data Table on Event marketing - Market size and forecast 2025-2030 ($ million)
Chart on Event marketing - Year-over-year growth 2025-2030 (%)
Data Table on Event marketing - Year-over-year growth 2025-2030 (%)

10.6 Event technology - Market size and forecast 2025-2030

Chart on Event technology - Market size and forecast 2025-2030 ($ million)
Data Table on Event technology - Market size and forecast 2025-2030 ($ million)
Chart on Event technology - Year-over-year growth 2025-2030 (%)
Data Table on Event technology - Year-over-year growth 2025-2030 (%)

10.7 Attendee registration - Market size and forecast 2025-2030

Chart on Attendee registration - Market size and forecast 2025-2030 ($ million)
Data Table on Attendee registration - Market size and forecast 2025-2030 ($ million)
Chart on Attendee registration - Year-over-year growth 2025-2030 (%)
Data Table on Attendee registration - Year-over-year growth 2025-2030 (%)

10.8 Market opportunity by Application

Market opportunity by Application ($ million)
Data Table on Market opportunity by Application ($ million)

11. Customer Landscape

11.1 Customer landscape overview

Analysis of price sensitivity, lifecycle, customer purchase basket, adoption rates, and purchase criteria

12. Geographic Landscape

12.1 Geographic segmentation

Chart on Market share by geography 2025-2030 (%)
Data Table on Market share by geography 2025-2030 (%)

12.2 Geographic comparison

Chart on Geographic comparison
Data Table on Geographic comparison

12.3 North America - Market size and forecast 2025-2030

Chart on North America - Market size and forecast 2025-2030 ($ million)
Data Table on North America - Market size and forecast 2025-2030 ($ million)
Chart on North America - Year-over-year growth 2025-2030 (%)
Data Table on North America - Year-over-year growth 2025-2030 (%)
Chart on Regional Comparison - North America
Data Table on Regional Comparison - North America

12.3.1 US - Market size and forecast 2025-2030

Chart on US - Market size and forecast 2025-2030 ($ million)
Data Table on US - Market size and forecast 2025-2030 ($ million)
Chart on US - Year-over-year growth 2025-2030 (%)
Data Table on US - Year-over-year growth 2025-2030 (%)

12.3.2 Canada - Market size and forecast 2025-2030

Chart on Canada - Market size and forecast 2025-2030 ($ million)
Data Table on Canada - Market size and forecast 2025-2030 ($ million)
Chart on Canada - Year-over-year growth 2025-2030 (%)
Data Table on Canada - Year-over-year growth 2025-2030 (%)

12.3.3 Mexico - Market size and forecast 2025-2030

Chart on Mexico - Market size and forecast 2025-2030 ($ million)
Data Table on Mexico - Market size and forecast 2025-2030 ($ million)
Chart on Mexico - Year-over-year growth 2025-2030 (%)
Data Table on Mexico - Year-over-year growth 2025-2030 (%)

12.4 Europe - Market size and forecast 2025-2030

Chart on Europe - Market size and forecast 2025-2030 ($ million)
Data Table on Europe - Market size and forecast 2025-2030 ($ million)
Chart on Europe - Year-over-year growth 2025-2030 (%)
Data Table on Europe - Year-over-year growth 2025-2030 (%)
Chart on Regional Comparison - Europe
Data Table on Regional Comparison - Europe

12.4.1 Germany - Market size and forecast 2025-2030

Chart on Germany - Market size and forecast 2025-2030 ($ million)
Data Table on Germany - Market size and forecast 2025-2030 ($ million)
Chart on Germany - Year-over-year growth 2025-2030 (%)
Data Table on Germany - Year-over-year growth 2025-2030 (%)

12.4.2 UK - Market size and forecast 2025-2030

Chart on UK - Market size and forecast 2025-2030 ($ million)
Data Table on UK - Market size and forecast 2025-2030 ($ million)
Chart on UK - Year-over-year growth 2025-2030 (%)
Data Table on UK - Year-over-year growth 2025-2030 (%)

12.4.3 France - Market size and forecast 2025-2030

Chart on France - Market size and forecast 2025-2030 ($ million)
Data Table on France - Market size and forecast 2025-2030 ($ million)
Chart on France - Year-over-year growth 2025-2030 (%)
Data Table on France - Year-over-year growth 2025-2030 (%)

12.4.4 Italy - Market size and forecast 2025-2030

Chart on Italy - Market size and forecast 2025-2030 ($ million)
Data Table on Italy - Market size and forecast 2025-2030 ($ million)
Chart on Italy - Year-over-year growth 2025-2030 (%)
Data Table on Italy - Year-over-year growth 2025-2030 (%)

12.4.5 Spain - Market size and forecast 2025-2030

Chart on Spain - Market size and forecast 2025-2030 ($ million)
Data Table on Spain - Market size and forecast 2025-2030 ($ million)
Chart on Spain - Year-over-year growth 2025-2030 (%)
Data Table on Spain - Year-over-year growth 2025-2030 (%)

12.4.6 The Netherlands - Market size and forecast 2025-2030

Chart on The Netherlands - Market size and forecast 2025-2030 ($ million)
Data Table on The Netherlands - Market size and forecast 2025-2030 ($ million)
Chart on The Netherlands - Year-over-year growth 2025-2030 (%)
Data Table on The Netherlands - Year-over-year growth 2025-2030 (%)

12.5 APAC - Market size and forecast 2025-2030

Chart on APAC - Market size and forecast 2025-2030 ($ million)
Data Table on APAC - Market size and forecast 2025-2030 ($ million)
Chart on APAC - Year-over-year growth 2025-2030 (%)
Data Table on APAC - Year-over-year growth 2025-2030 (%)
Chart on Regional Comparison - APAC
Data Table on Regional Comparison - APAC

12.5.1 China - Market size and forecast 2025-2030

Chart on China - Market size and forecast 2025-2030 ($ million)
Data Table on China - Market size and forecast 2025-2030 ($ million)
Chart on China - Year-over-year growth 2025-2030 (%)
Data Table on China - Year-over-year growth 2025-2030 (%)

12.5.2 Japan - Market size and forecast 2025-2030

Chart on Japan - Market size and forecast 2025-2030 ($ million)
Data Table on Japan - Market size and forecast 2025-2030 ($ million)
Chart on Japan - Year-over-year growth 2025-2030 (%)
Data Table on Japan - Year-over-year growth 2025-2030 (%)

12.5.3 South Korea - Market size and forecast 2025-2030

Chart on South Korea - Market size and forecast 2025-2030 ($ million)
Data Table on South Korea - Market size and forecast 2025-2030 ($ million)
Chart on South Korea - Year-over-year growth 2025-2030 (%)
Data Table on South Korea - Year-over-year growth 2025-2030 (%)

12.5.4 Australia - Market size and forecast 2025-2030

Chart on Australia - Market size and forecast 2025-2030 ($ million)
Data Table on Australia - Market size and forecast 2025-2030 ($ million)
Chart on Australia - Year-over-year growth 2025-2030 (%)
Data Table on Australia - Year-over-year growth 2025-2030 (%)

12.5.5 Singapore - Market size and forecast 2025-2030

Chart on Singapore - Market size and forecast 2025-2030 ($ million)
Data Table on Singapore - Market size and forecast 2025-2030 ($ million)
Chart on Singapore - Year-over-year growth 2025-2030 (%)
Data Table on Singapore - Year-over-year growth 2025-2030 (%)

12.5.6 India - Market size and forecast 2025-2030

Chart on India - Market size and forecast 2025-2030 ($ million)
Data Table on India - Market size and forecast 2025-2030 ($ million)
Chart on India - Year-over-year growth 2025-2030 (%)
Data Table on India - Year-over-year growth 2025-2030 (%)

12.6 Middle East and Africa - Market size and forecast 2025-2030

Chart on Middle East and Africa - Market size and forecast 2025-2030 ($ million)
Data Table on Middle East and Africa - Market size and forecast 2025-2030 ($ million)
Chart on Middle East and Africa - Year-over-year growth 2025-2030 (%)
Data Table on Middle East and Africa - Year-over-year growth 2025-2030 (%)
Chart on Regional Comparison - Middle East and Africa
Data Table on Regional Comparison - Middle East and Africa

12.6.1 UAE - Market size and forecast 2025-2030

Chart on UAE - Market size and forecast 2025-2030 ($ million)
Data Table on UAE - Market size and forecast 2025-2030 ($ million)
Chart on UAE - Year-over-year growth 2025-2030 (%)
Data Table on UAE - Year-over-year growth 2025-2030 (%)

12.6.2 Saudi Arabia - Market size and forecast 2025-2030

Chart on Saudi Arabia - Market size and forecast 2025-2030 ($ million)
Data Table on Saudi Arabia - Market size and forecast 2025-2030 ($ million)
Chart on Saudi Arabia - Year-over-year growth 2025-2030 (%)
Data Table on Saudi Arabia - Year-over-year growth 2025-2030 (%)

12.6.3 South Africa - Market size and forecast 2025-2030

Chart on South Africa - Market size and forecast 2025-2030 ($ million)
Data Table on South Africa - Market size and forecast 2025-2030 ($ million)
Chart on South Africa - Year-over-year growth 2025-2030 (%)
Data Table on South Africa - Year-over-year growth 2025-2030 (%)

12.6.4 Israel - Market size and forecast 2025-2030

Chart on Israel - Market size and forecast 2025-2030 ($ million)
Data Table on Israel - Market size and forecast 2025-2030 ($ million)
Chart on Israel - Year-over-year growth 2025-2030 (%)
Data Table on Israel - Year-over-year growth 2025-2030 (%)

12.6.5 Turkey - Market size and forecast 2025-2030

Chart on Turkey - Market size and forecast 2025-2030 ($ million)
Data Table on Turkey - Market size and forecast 2025-2030 ($ million)
Chart on Turkey - Year-over-year growth 2025-2030 (%)
Data Table on Turkey - Year-over-year growth 2025-2030 (%)

12.7 South America - Market size and forecast 2025-2030

Chart on South America - Market size and forecast 2025-2030 ($ million)
Data Table on South America - Market size and forecast 2025-2030 ($ million)
Chart on South America - Year-over-year growth 2025-2030 (%)
Data Table on South America - Year-over-year growth 2025-2030 (%)
Chart on Regional Comparison - South America
Data Table on Regional Comparison - South America

12.7.1 Brazil - Market size and forecast 2025-2030

Chart on Brazil - Market size and forecast 2025-2030 ($ million)
Data Table on Brazil - Market size and forecast 2025-2030 ($ million)
Chart on Brazil - Year-over-year growth 2025-2030 (%)
Data Table on Brazil - Year-over-year growth 2025-2030 (%)

12.7.2 Argentina - Market size and forecast 2025-2030

Chart on Argentina - Market size and forecast 2025-2030 ($ million)
Data Table on Argentina - Market size and forecast 2025-2030 ($ million)
Chart on Argentina - Year-over-year growth 2025-2030 (%)
Data Table on Argentina - Year-over-year growth 2025-2030 (%)

12.7.3 Chile - Market size and forecast 2025-2030

Chart on Chile - Market size and forecast 2025-2030 ($ million)
Data Table on Chile - Market size and forecast 2025-2030 ($ million)
Chart on Chile - Year-over-year growth 2025-2030 (%)
Data Table on Chile - Year-over-year growth 2025-2030 (%)

12.8 Market opportunity by geography

Market opportunity by geography ($ million)
Data Tables on Market opportunity by geography ($ million)

13. Drivers, Challenges, and Opportunity

13.1 Market drivers

Proliferation of hybrid and virtual engagement models
Integration of sophisticated data analytics and AI
Widespread adoption of cloud based subscription and software as service framework

13.2 Market challenges

Data privacy and regulatory compliance constraints
Technical interoperability and legacy system integration
Skilled labor shortages and financial barriers to customization

13.3 Impact of drivers and challenges

Impact of drivers and challenges in 2025 and 2030

13.4 Market opportunities

Emergence of hyper-personalization through AI and predictive analytics
Shift toward sustainability and quantifiable carbon footprint management
Integration of immersive technologies and gamified engagement strategies

14. Competitive Landscape

14.1 Overview

14.2

Overview on criticality of inputs and factors of differentiation

14.3 Landscape disruption

Overview on factors of disruption

14.4 Industry risks

Impact of key risks on business

15. Competitive Analysis

15.1 Companies profiled

Companies covered

15.2 Company ranking index

15.3 Market positioning of companies

Matrix on companies position and classification

15.4 5Touch Solution Inc.

5Touch Solution Inc. - Overview
5Touch Solution Inc. - Product / Service
5Touch Solution Inc. - Key offerings
SWOT

15.5 Accelevents Inc.

Accelevents Inc. - Overview
Accelevents Inc. - Product / Service
Accelevents Inc. - Key offerings
SWOT

15.6 BigMarker Inc.

BigMarker Inc. - Overview
BigMarker Inc. - Product / Service
BigMarker Inc. - Key offerings
SWOT

15.7 Bizzabo Inc.

Bizzabo Inc. - Overview
Bizzabo Inc. - Product / Service
Bizzabo Inc. - Key offerings
SWOT

15.8 Canapii Ltd

Canapii Ltd - Overview
Canapii Ltd - Product / Service
Canapii Ltd - Key offerings
SWOT

15.9 Cvent Inc

Cvent Inc - Overview
Cvent Inc - Product / Service
Cvent Inc - Key offerings
SWOT

15.10 EventsAIR Pty Ltd

EventsAIR Pty Ltd - Overview
EventsAIR Pty Ltd - Product / Service
EventsAIR Pty Ltd - Key offerings
SWOT

15.11 InEvent Inc.

InEvent Inc. - Overview
InEvent Inc. - Product / Service
InEvent Inc. - Key offerings
SWOT

15.12 RainFocus LLC

RainFocus LLC - Overview
RainFocus LLC - Product / Service
RainFocus LLC - Key offerings
SWOT

15.13 RingCentral Inc.

RingCentral Inc. - Overview
RingCentral Inc. - Product / Service
RingCentral Inc. - Key news
RingCentral Inc. - Key offerings
SWOT

15.14 SplashThat.com Inc.

SplashThat.com Inc. - Overview
SplashThat.com Inc. - Product / Service
SplashThat.com Inc. - Key offerings
SWOT

15.15 Stova Group

Stova Group - Overview
Stova Group - Product / Service
Stova Group - Key offerings
SWOT

15.16 vFairs LLC

vFairs LLC - Overview
vFairs LLC - Product / Service
vFairs LLC - Key offerings
SWOT

15.17 Webconnex LLC

Webconnex LLC - Overview
Webconnex LLC - Product / Service
Webconnex LLC - Key offerings
SWOT

15.18 Whova Inc.

Whova Inc. - Overview
Whova Inc. - Product / Service
Whova Inc. - Key offerings
SWOT

16. Appendix

16.1 Scope of the report

Market definition
Objectives
Notes and caveats

16.2 Inclusions and exclusions checklist

Inclusions checklist
Exclusions checklist

16.3 Currency conversion rates for US$

16.4 Research methodology

16.5 Data procurement

Information sources

16.6 Data validation

16.7 Validation techniques employed for market sizing

16.8 Data synthesis

16.9 360 degree market analysis

16.10 List of abbreviations

Research Methodology

Technavio presents a detailed picture of the market by way of study, synthesis, and summation of data from multiple sources. The analysts have presented the various facets of the market with a particular focus on identifying the key industry influencers. The data thus presented is comprehensive, reliable, and the result of extensive research, both primary and secondary.

INFORMATION SOURCES

Primary sources

  • Manufacturers and suppliers
  • Channel partners
  • Industry experts
  • Strategic decision makers

Secondary sources

  • Industry journals and periodicals
  • Government data
  • Financial reports of key industry players
  • Historical data
  • Press releases

DATA ANALYSIS

Data Synthesis

  • Collation of data
  • Estimation of key figures
  • Analysis of derived insights

Data Validation

  • Triangulation with data models
  • Reference against proprietary databases
  • Corroboration with industry experts

REPORT WRITING

Qualitative

  • Market drivers
  • Market challenges
  • Market trends
  • Five forces analysis

Quantitative

  • Market size and forecast
  • Market segmentation
  • Geographical insights
  • Competitive landscape

Interested in this report?

Get your sample now to see our research methodology and insights!

Download Now

Frequently Asked Questions

Event Management As A Service market growth will increase by USD 780.1 million during 2026-2030.

The Event Management As A Service market is expected to grow at a CAGR of 13% during 2026-2030.

Event Management As A Service market is segmented by End-user (Corporate, PO and NGO, Individuals) Type (Pre-event services, Onsite services, Post-event services) Application (Venue and logistics, Event planning, Event marketing, Event technology, Attendee registration)

5Touch Solution Inc., Accelevents Inc., Airmeet Inc., BigMarker Inc., Bizzabo Inc., Brella Ltd., Canapii Ltd, Certain Inc., Cvent Inc, EventsAIR Pty Ltd, InEvent Inc., RainFocus LLC, RingCentral Inc., SplashThat.com Inc., SpotMe SA, Stova Group, Swapcard SAS, vFairs LLC, Webconnex LLC, Whova Inc. are a few of the key vendors in the Event Management As A Service market.

North America will register the highest growth rate of 45.3% among the other regions. Therefore, the Event Management As A Service market in North America is expected to garner significant business opportunities for the vendors during the forecast period.

US, Canada, Mexico, Germany, UK, France, Italy, Spain, The Netherlands, China, Japan, South Korea, Australia, Singapore, India, UAE, Saudi Arabia, South Africa, Israel, Turkey, Brazil, Argentina, Chile

  • Proliferation of hybrid and virtual engagement models is the driving factor this market.

The Event Management As A Service market vendors should focus on grabbing business opportunities from the End-user segment as it accounted for the largest market share in the base year.
RIA - Research AI Assistant
Ask RIA
