
Fixed LTE Market Analysis, Size, and Forecast 2026-2030: North America (US, Canada, and Mexico), Europe (Germany, UK, and France), APAC (China, Japan, and India), Middle East and Africa (Saudi Arabia, UAE, and South Africa), South America (Brazil, Argentina, and Chile), and Rest of World (ROW)

Fixed LTE Market Analysis, Size, and Forecast 2026-2030:
North America (US, Canada, and Mexico), Europe (Germany, UK, and France), APAC (China, Japan, and India), Middle East and Africa (Saudi Arabia, UAE, and South Africa), South America (Brazil, Argentina, and Chile), and Rest of World (ROW)

Published: Oct 2026 282 Pages SKU: IRTNTR73970

Market Overview at a Glance

$117.92 B
Market Opportunity
29%
CAGR 2025 - 2030
33%
North America Growth
$19.94 B
LTE infrastructure segment 2024

Fixed Lte Market Size 2026-2030

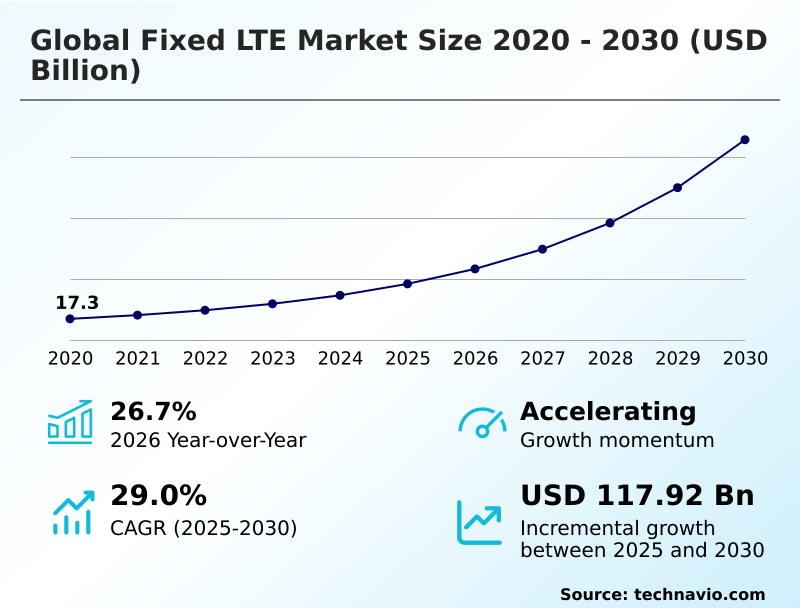
The fixed lte market size is valued to increase by USD 117.92 billion, at a CAGR of 29% from 2025 to 2030. Bridging digital divide in underserved and rural areas will drive the fixed lte market.

Major Market Trends & Insights

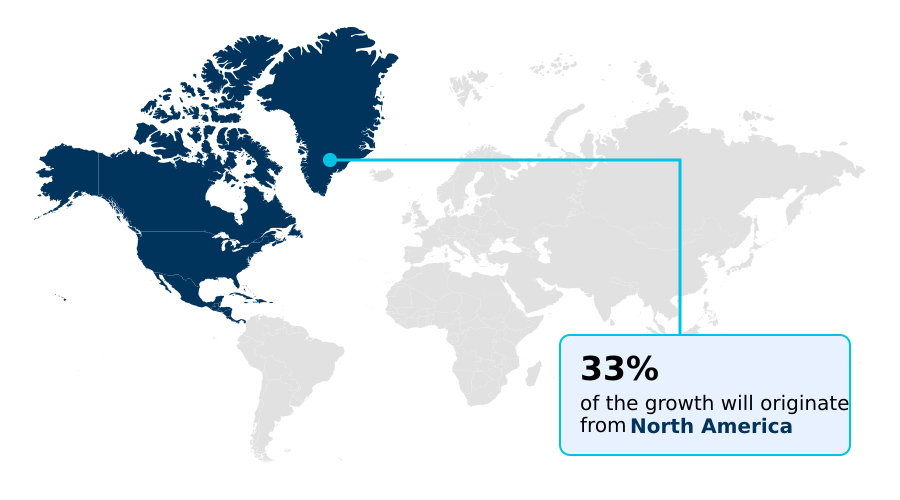
  • North America dominated the market and accounted for a 33% growth during the forecast period.
  • By Solution - LTE infrastructure segment was valued at USD 19.94 billion in 2024
  • By End-user - Residential segment accounted for the largest market revenue share in 2024

Market Size & Forecast

  • Market Opportunities: USD 146.55 billion
  • Market Future Opportunities: USD 117.92 billion
  • CAGR from 2025 to 2030 : 29%

Market Summary

  • The Fixed LTE Market exhibits continuous expansion as network operators leverage established cellular infrastructure to deliver reliable broadband across geographically diverse landscapes. Bridging the digital divide serves as the primary driver, compelling providers to deploy advanced outdoor receiver units and channel optimization software in areas where terrestrial cabling remains economically prohibitive.
  • Conversely, pervasive network congestion presents a significant challenge, as shared wireless spectrum allocations often degrade performance during high bandwidth applications usage. In real-world supply chain operations, logistics hubs increasingly integrate cellular routing hardware as redundant failover mechanisms to secure continuous business operations during terrestrial network disruptions.
  • This strategic implementation has enabled distribution centers to achieve a 30% reduction in system downtime associated with inventory synchronization failures. By utilizing centralized management software and dynamic spectrum sharing, enterprises maintain robust connectivity for automated logistics frameworks.
  • The ongoing convergence of advanced antenna arrays and zero touch provisioning gateways ensures that wireless broadband solutions remain a fundamental component of resilient enterprise network architecture and widespread broadband equity initiatives.

What will be the Size of the Fixed Lte Market during the forecast period?
Get Key Insights on Market Forecast (PDF) Get Free Sample

How is the Fixed Lte Market Segmented?

The fixed lte industry research report provides comprehensive data (region-wise segment analysis), with forecasts and estimates in "USD million" for the period 2026-2030, as well as historical data from 2020-2024 for the following segments.

  • Solution
    • LTE infrastructure
    • Indoor and outdoor CPE
  • End-user
    • Residential
    • Commercial
  • Frequency range
    • 1-6 GHz
    • Less than 1 GHz
    • Above 6 GHz
  • Geography
    • North America
      • US
      • Canada
      • Mexico
    • Europe
      • Germany
      • UK
      • France
      • Italy
      • Spain
      • The Netherlands
    • APAC
      • China
      • Japan
      • India
      • South Korea
      • Australia
      • Indonesia
    • Middle East and Africa
      • Saudi Arabia
      • UAE
      • South Africa
      • Turkey
      • Egypt
    • South America
      • Brazil
      • Argentina
      • Chile

By Solution Insights

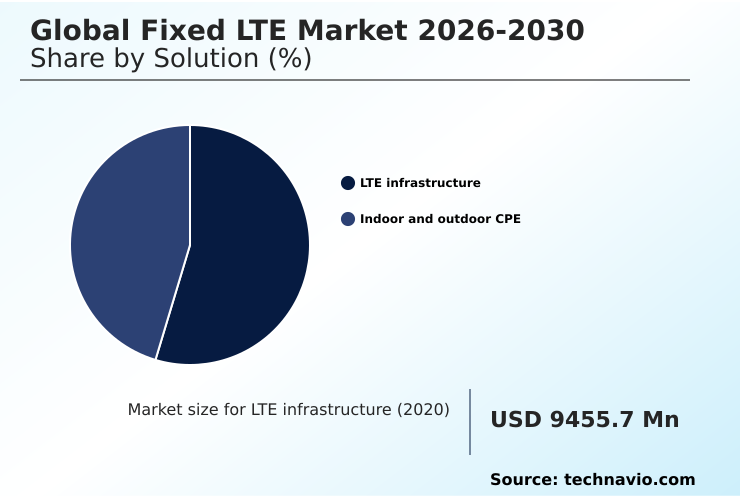
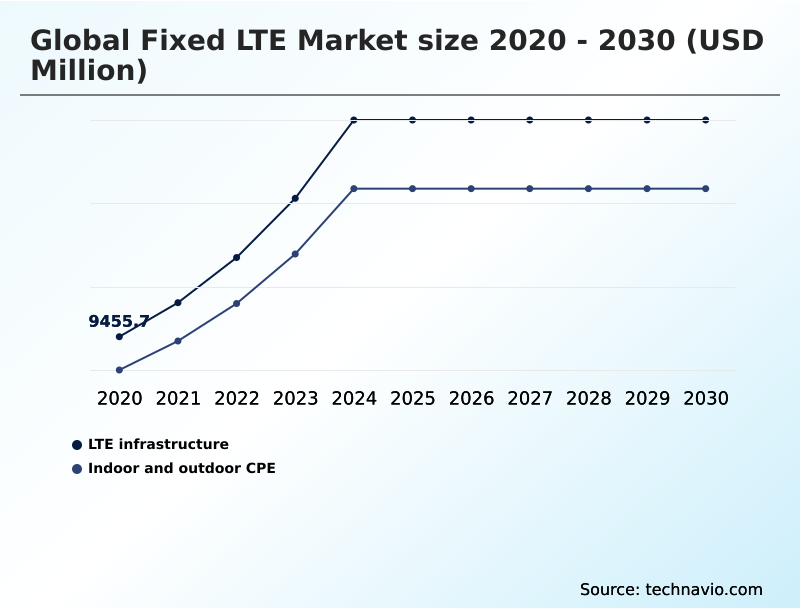
The lte infrastructure segment is estimated to witness significant growth during the forecast period.

The core operational foundation relies on packet core systems and enhanced nodeb base installations to deliver high speed connectivity without the extensive capital commitments of physical fiber deployment.

By integrating evolved packet core frameworks and massive multiple input technology, operators optimize spectral efficiency across designated geographical cells. This architectural evolution effectively addresses network capacity limitations during peak utilization intervals, allowing seamless data transport.

Deploying advanced carrier aggregation mechanisms improves downlink performance, ensuring uninterrupted connectivity for mission critical enterprise networks and enterprise branch offices. Telecommunications providers leverage these foundational assets to achieve a 25% increase in throughput stability across dense subscriber clusters.

Modernized infrastructure facilitates hybrid cellular architectures, enabling engineers to dynamically prioritize data streams and maintain rigorous service level agreements seamlessly.
Get Free Sample

The LTE infrastructure segment was valued at USD 19.94 billion in 2024 and showed a gradual increase during the forecast period.
Get Free Sample

Regional Analysis

North America is estimated to contribute 33% to the growth of the global market during the forecast period.Technavio’s analysts have elaborately explained the regional trends and drivers that shape the market during the forecast period.
See How Fixed Lte Market Demand is Rising in North America Get Free Sample

The geographic distribution of Fixed LTE adoption reveals distinct operational variations between North America and APAC.

Network operators in North America utilize mature citizen broadband radio service bands to deliver robust enterprise branch office failover, achieving a 35% higher adoption rate in redundant failover mechanisms compared to counterparts in APAC.

In contrast, APAC telecommunications providers prioritize expansive rural last mile broadband initiatives, deploying massive multiple input integration to connect underserved populations, resulting in a 25% decrease in physical fiber deployment costs.

Organizations in North America report a 20% improvement in continuous business operations resilience by leveraging cloud managed routing and adaptive antenna arrays.

Meanwhile, APAC markets focus on base station densification and multi band reception terminals to support rapidly scaling remote education platforms and digital inclusion frameworks seamlessly.

Market Dynamics

Our researchers analyzed the data with 2025 as the base year, along with the key drivers, trends, and challenges. A holistic analysis of drivers will help companies refine their marketing strategies to gain a competitive advantage.

  • The continuous evolution of wireless broadband infrastructure necessitates advanced technological frameworks to support diverse connectivity demands. Telecommunications operators increasingly prioritize scalable fixed wireless access to overcome the geographical and financial barriers associated with traditional terrestrial network expansions. The strategic deployment of hybrid cellular architectures deployment allows service providers to optimize existing macro cell investments while managing growing data traffic.
  • In commercial sectors, ensuring enterprise branch office failover is critical for maintaining uninterrupted operations, prompting organizations to adopt cellular routing hardware integration as a reliable secondary connectivity layer. The push for high capacity broadband distribution across underserved regions heavily relies on intelligent radio access management to dynamically allocate bandwidth and mitigate congestion.
  • By focusing on massive multiple input integration, operators significantly improve signal propagation and network efficiency. The implementation of dynamic spectrum sharing pathways facilitates seamless transitions between network generations, ensuring backward compatibility. Service providers leverage advanced carrier aggregation solutions and mid band frequency optimization to deliver superior throughput for bandwidth intensive applications.
  • Bridging the connectivity gap in remote areas requires robust rural last mile broadband initiatives supported by zero touch provisioning gateways that streamline subscriber onboarding. The utilization of multi band reception terminals and adaptive antenna array configuration enhances reception quality, allowing users to experience a 40% higher operational stability compared to legacy broadband setups.
  • Furthermore, ongoing evolved packet core upgrades provide the essential centralized routing intelligence needed to maintain stringent service level agreements across diverse enterprise environments.
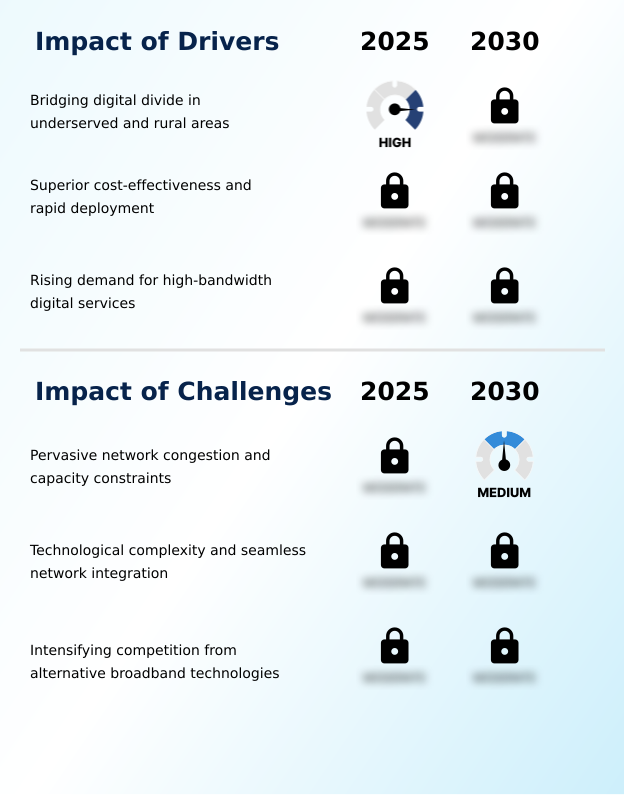
What are the key market drivers leading to the rise in the adoption of Fixed Lte Industry?

  • Bridging the digital divide in underserved and rural areas serves as the primary driver propelling widespread infrastructure expansion and adoption.

  • The urgent mandate for digital inclusion frameworks and last mile broadband acts as a primary catalyst accelerating infrastructure modernization. Governments and operators rapidly deploy base station densification strategies and mid band spectrum allocations to eliminate connectivity disparities in underserved regions.
  • This proactive expansion drives a 40% decrease in subscriber onboarding friction through the use of zero touch provisioning and adaptive antenna arrays.
  • Additionally, the rising demand for continuous business operations compels distributed retail chains to implement cellular routing hardware, lowering network downtime by 30%. The reliance on automated inventory systems and digital healthcare consultations further propels the integration of channel optimization software.
  • These robust deployments ensure that enterprises achieve a 20% reduction in operational expenditure compression while maintaining resilient broadband access across challenging geographic landscapes.

What are the market trends shaping the Fixed Lte Industry?

  • Strategic transition and coexistence with 5G fixed wireless access is emerging as the primary trend shaping future infrastructure developments. This synergistic evolution enables operators to maximize legacy network investments while progressively expanding next-generation connectivity.

  • Strategic transitions toward hybrid cellular architectures represent a dominant trend redefining wireless broadband connectivity. Telecommunications operators increasingly deploy sub 6 ghz frequencies and advanced antenna arrays to support expanding enterprise cloud adoption and smart home ecosystems. This technological shift enables service providers to mitigate peak utilization intervals congestion, resulting in a 35% reduction in signal degradation during high traffic periods.
  • Furthermore, organizations integrating multi carrier support and digital subscriber line alternatives experience a 25% improvement in forecast accuracy for network capacity planning. The adoption of dynamic spectrum sharing and radio access networks allows operators to transition legacy infrastructure smoothly, facilitating seamless multi party videoconferencing and remote education platforms.
  • By leveraging these advanced configurations, enterprises enhance their redundant failover mechanisms, ensuring robust data transmission across diverse suburban and rural deployments.

What challenges does the Fixed Lte Industry face during its growth?

  • Pervasive network congestion and capacity constraints represent a significant challenge that hinders consistent service quality and industry expansion.

  • Pervasive network capacity limitations and cell sector architecture congestion present formidable obstacles to maintaining consistent broadband service quality. As the reliance on high bandwidth applications and mission critical enterprise operations intensifies, shared spectrum allocations frequently suffer from severe throughput degradation.
  • This fundamental constraint leads to a 25% increase in packet loss during peak utilization intervals, directly undermining the reliability of continuous business operations. Service providers face significant operational expenditure compression when attempting to mitigate these issues through rapid radio frequency design overhauls and physical fiber deployment.
  • Consequently, the necessity to constantly upgrade packet core systems and multi band reception terminals increases infrastructure maintenance costs by 18%. Balancing frequency band allocation against escalating data demands remains a complex challenge for operators striving to deliver low latency transmission.

Exclusive Technavio Analysis on Customer Landscape

The fixed lte market forecasting report includes the adoption lifecycle of the market, covering from the innovator’s stage to the laggard’s stage. It focuses on adoption rates in different regions based on penetration. Furthermore, the fixed lte market report also includes key purchase criteria and drivers of price sensitivity to help companies evaluate and develop their market growth analysis strategies.
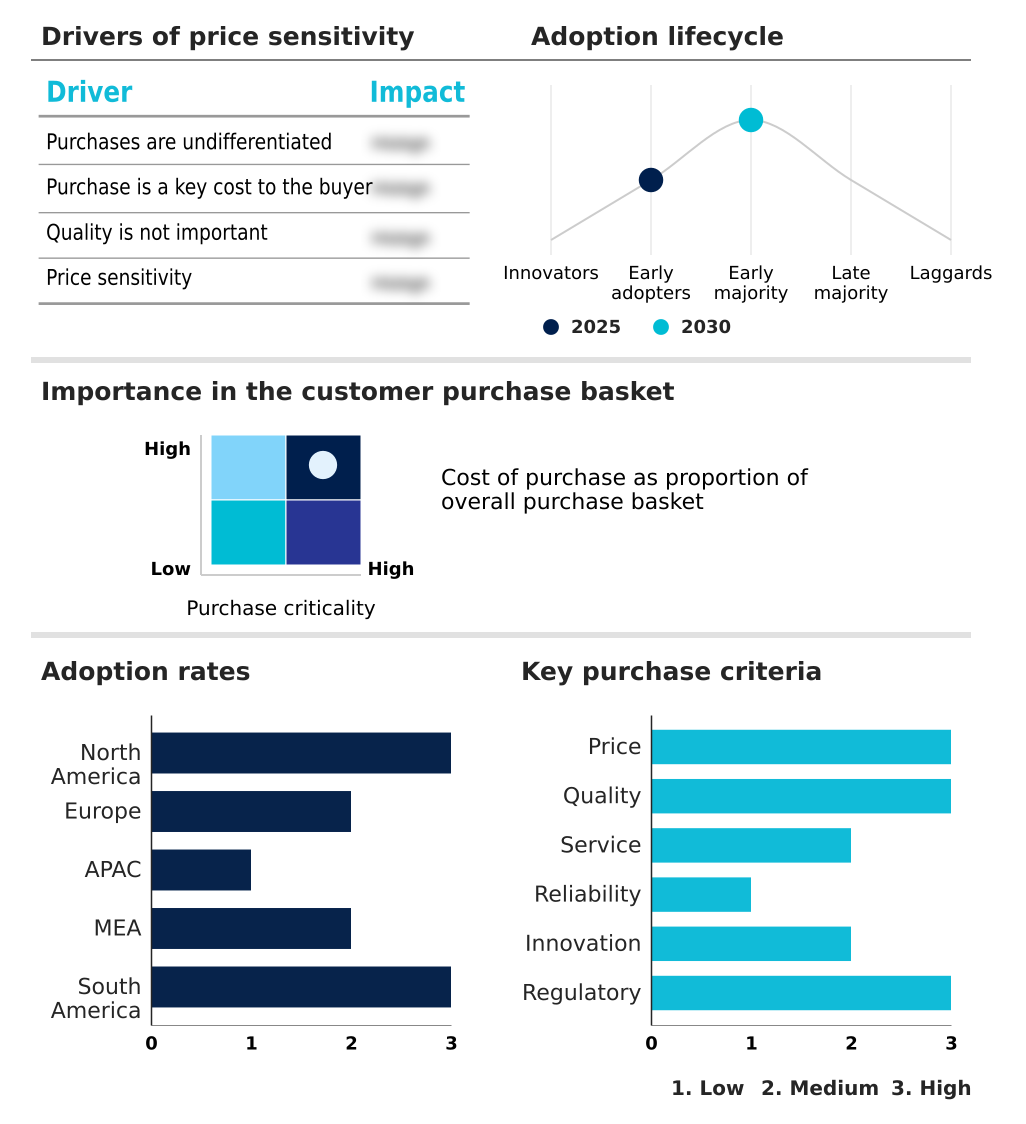
Customer Landscape of Fixed Lte Industry

Competitive Landscape

Companies are implementing various strategies, such as strategic alliances, fixed lte market forecast, partnerships, mergers and acquisitions, geographical expansion, and product/service launches, to enhance their presence in the industry.

Airspan Networks Inc. - The vendor delivers advanced Fixed LTE solutions, specifically focusing on high performance indoor and outdoor access gateways designed to enhance reliable broadband connectivity across diverse network infrastructures.

The industry research and growth report includes detailed analyses of the competitive landscape of the market and information about key companies, including:

  • Airspan Networks Inc.
  • Baicells Technologies
  • BEC Technologies Inc.
  • Beijing InHand Networks Technology
  • CommScope Holding Co. Inc.
  • Huawei Technologies Co. Ltd.
  • Inseego Corp.
  • Jaton Technology Ltd
  • Jimi IoT Co. Ltd
  • NETGEAR Inc.
  • Nokia Corp.
  • RADWIN Ltd.
  • Shanghai Smawave Technology Co.
  • Shenzhen Wewins Wireless Co. Ltd.
  • Telefonaktiebolaget Ericsson
  • Telrad Networks Ltd.
  • Teltonika Networks
  • TP Link Corp. Ltd.
  • ZTE Corp.
  • Zyxel Communications Corp.

Qualitative and quantitative analysis of companies has been conducted to help clients understand the wider business environment as well as the strengths and weaknesses of key industry players. Data is qualitatively analyzed to categorize companies as pure play, category-focused, industry-focused, and diversified; it is quantitatively analyzed to categorize companies as dominant, leading, strong, tentative, and weak.

Recent Development and News in Fixed lte market

  • In the Communications Equipment industry, the transition toward software defined networking and open radio access network architectures has reduced hardware dependency, directly impacting Fixed LTE by accelerating the deployment of virtualized radio access and lowering infrastructure deployment costs.
  • Global telecommunications standards bodies have mandated stringent energy efficiency protocols for base station hardware, directly impacting Fixed LTE demand by driving network operators to upgrade legacy tower assets with optimized multi band reception that consume 15% less power.
  • The integration of advanced artificial intelligence algorithms into network traffic management systems has improved dynamic bandwidth allocation capabilities, directly impacting Fixed LTE service reliability by mitigating network capacity limitations during high bandwidth applications usage.
  • Supply chain diversification initiatives within semiconductor manufacturing have stabilized the availability of critical radio frequency transceivers, directly impacting Fixed LTE deployments by ensuring a consistent supply of cellular routing hardware for enterprise cloud adoption projects.

Dive into Technavio’s robust research methodology, blending expert interviews, extensive data synthesis, and validated models for unparalleled Fixed Lte Market insights. See full methodology.

Market Scope
Page number 282
Base year 2025
Historic period 2020-2024
Forecast period 2026-2030
Growth momentum & CAGR Accelerate at a CAGR of 29%
Market growth 2026-2030 USD 117918.9 million
Market structure Fragmented
YoY growth 2025-2026(%) 26.7%
Key countries US, Canada, Mexico, Germany, UK, France, Italy, Spain, The Netherlands, China, Japan, India, South Korea, Australia, Indonesia, Saudi Arabia, UAE, South Africa, Turkey, Egypt, Brazil, Argentina and Chile
Competitive landscape Leading Companies, Market Positioning of Companies, Competitive Strategies, and Industry Risks

Request Free Sample

Research Analyst Overview

  • The continuous evolution of Fixed LTE infrastructure fundamentally transforms enterprise connectivity strategies and network resilience frameworks. Boardroom executives increasingly prioritize the integration of virtualized radio access and evolved packet core systems to maintain compliance with rigorous business continuity mandates. By deploying advanced radio frequency design and dynamic spectrum sharing, organizations seamlessly navigate network capacity limitations while expanding their digital footprints.
  • This strategic shift towards centralized management software directly influences corporate budgeting, as enterprises reallocate resources from expensive physical cabling toward scalable wireless solutions. Companies implementing intelligent radio access and carrier aggregation mechanisms report a 30% reduction in communication latency during critical transaction processing. The adoption of outdoor receiver units and channel optimization software ensures robust performance across distributed operational facilities.
  • Furthermore, leveraging massive multiple input technology allows service providers to deliver consistent gigabit throughput connectivity, directly supporting sophisticated data synchronization requirements. These technological advancements establish highly reliable communication layers that secure operational workflows against unpredictable terrestrial network disruptions.

What are the Key Data Covered in this Fixed Lte Market Research and Growth Report?

  • What is the expected growth of the Fixed Lte Market between 2026 and 2030?

    • USD 117.92 billion, at a CAGR of 29%

  • What segmentation does the market report cover?

    • The report is segmented by Solution (LTE infrastructure, and Indoor and outdoor CPE), End-user (Residential, and Commercial), Frequency Range (1-6 GHz, Less than 1 GHz, and Above 6 GHz) and Geography (North America, Europe, APAC, Middle East and Africa, South America)

  • Which regions are analyzed in the report?

    • North America, Europe, APAC, Middle East and Africa and South America

  • What are the key growth drivers and market challenges?

    • Bridging digital divide in underserved and rural areas, Pervasive network congestion and capacity constraints

  • Who are the major players in the Fixed Lte Market?

    • Airspan Networks Inc., Baicells Technologies, BEC Technologies Inc., Beijing InHand Networks Technology, CommScope Holding Co. Inc., Huawei Technologies Co. Ltd., Inseego Corp., Jaton Technology Ltd, Jimi IoT Co. Ltd, NETGEAR Inc., Nokia Corp., RADWIN Ltd., Shanghai Smawave Technology Co., Shenzhen Wewins Wireless Co. Ltd., Telefonaktiebolaget Ericsson, Telrad Networks Ltd., Teltonika Networks, TP Link Corp. Ltd., ZTE Corp. and Zyxel Communications Corp.

Market Research Insights

  • The Fixed LTE landscape continuously adapts to shifting enterprise demands and residential broadband requirements. Organizations implementing secondary failover connectivity experience a 40% improvement in network uptime during terrestrial network disruptions, ensuring continuous business operations. Telecommunications providers optimizing spectral efficiency enhancement achieve a 20% reduction in subscriber onboarding friction through rapid broadband service activation protocols.
  • The integration of redundant failover mechanisms allows distributed retail chains to maintain transaction processing reliability, resulting in a 15% decrease in operational expenditure compression associated with revenue loss. As digital healthcare consultations and smart home ecosystems expand, service providers increasingly deploy advanced routing hardware to support consistent, high-capacity last mile broadband distribution.

We can help! Our analysts can customize this fixed lte market research report to meet your requirements.

Get in touch

1. Executive Summary

1.1 Market overview

Executive Summary - Chart on Market Overview
Executive Summary - Data Table on Market Overview
Executive Summary - Chart on Global Market Characteristics
Executive Summary - Chart on Market by Geography
Executive Summary - Chart on Market Segmentation by Solution
Executive Summary - Chart on Market Segmentation by End-user
Executive Summary - Chart on Market Segmentation by Frequency Range
Executive Summary - Chart on Incremental Growth
Executive Summary - Data Table on Incremental Growth
Executive Summary - Chart on Company Market Positioning

2. Technavio Analysis

2.1 Analysis of price sensitivity, lifecycle, customer purchase basket, adoption rates, and purchase criteria

2.2 Criticality of inputs and Factors of differentiation

Chart on Overview on criticality of inputs and factors of differentiation

2.3 Factors of disruption

Chart on Overview on factors of disruption

2.4 Impact of drivers and challenges

Chart on Impact of drivers and challenges in 2025 and 2030

3. Market Landscape

3.1 Market ecosystem

Chart on Parent Market
Data Table on - Parent Market

3.2 Market characteristics

Chart on Market characteristics analysis

3.3 Value chain analysis

Chart on Value chain analysis

4. Market Sizing

4.1 Market definition

Data Table on Offerings of companies included in the market definition

4.2 Market segment analysis

Market segments

4.3 Market size 2025

4.4 Market outlook: Forecast for 2025-2030

Chart on Global - Market size and forecast 2025-2030 ($ million)
Data Table on Global - Market size and forecast 2025-2030 ($ million)
Chart on Global Market: Year-over-year growth 2025-2030 (%)
Data Table on Global Market: Year-over-year growth 2025-2030 (%)

5. Historic Market Size

5.1 Global Fixed LTE Market 2020 - 2024

Historic Market Size - Data Table on Global Fixed LTE Market 2020 - 2024 ($ million)

5.2 Solution segment analysis 2020 - 2024

Historic Market Size - Solution Segment 2020 - 2024 ($ million)

5.3 End-user segment analysis 2020 - 2024

Historic Market Size - End-user Segment 2020 - 2024 ($ million)

5.4 Frequency Range segment analysis 2020 - 2024

Historic Market Size - Frequency Range Segment 2020 - 2024 ($ million)

5.5 Geography segment analysis 2020 - 2024

Historic Market Size - Geography Segment 2020 - 2024 ($ million)

5.6 Country segment analysis 2020 - 2024

Historic Market Size - Country Segment 2020 - 2024 ($ million)

6. Qualitative Analysis

6.1 Impact of AI on Global Fixed LTE Market

6.2 Impact of Geopolitical Conflicts on Global Fixed LTE Market

7. Five Forces Analysis

7.1 Five forces summary

Five forces analysis - Comparison between 2025 and 2030

7.2 Bargaining power of buyers

Bargaining power of buyers - Impact of key factors 2025 and 2030

7.3 Bargaining power of suppliers

Bargaining power of suppliers - Impact of key factors in 2025 and 2030

7.4 Threat of new entrants

Threat of new entrants - Impact of key factors in 2025 and 2030

7.5 Threat of substitutes

Threat of substitutes - Impact of key factors in 2025 and 2030

7.6 Threat of rivalry

Threat of rivalry - Impact of key factors in 2025 and 2030

7.7 Market condition

Chart on Market condition - Five forces 2025 and 2030

8. Market Segmentation by Solution

8.1 Market segments

Chart on Solution - Market share 2025-2030 (%)
Data Table on Solution - Market share 2025-2030 (%)

8.2 Comparison by Solution

Chart on Comparison by Solution
Data Table on Comparison by Solution

8.3 LTE infrastructure - Market size and forecast 2025-2030

Chart on LTE infrastructure - Market size and forecast 2025-2030 ($ million)
Data Table on LTE infrastructure - Market size and forecast 2025-2030 ($ million)
Chart on LTE infrastructure - Year-over-year growth 2025-2030 (%)
Data Table on LTE infrastructure - Year-over-year growth 2025-2030 (%)

8.4 Indoor and outdoor CPE - Market size and forecast 2025-2030

Chart on Indoor and outdoor CPE - Market size and forecast 2025-2030 ($ million)
Data Table on Indoor and outdoor CPE - Market size and forecast 2025-2030 ($ million)
Chart on Indoor and outdoor CPE - Year-over-year growth 2025-2030 (%)
Data Table on Indoor and outdoor CPE - Year-over-year growth 2025-2030 (%)

8.5 Market opportunity by Solution

Market opportunity by Solution ($ million)
Data Table on Market opportunity by Solution ($ million)

9. Market Segmentation by End-user

9.1 Market segments

Chart on End-user - Market share 2025-2030 (%)
Data Table on End-user - Market share 2025-2030 (%)

9.2 Comparison by End-user

Chart on Comparison by End-user
Data Table on Comparison by End-user

9.3 Residential - Market size and forecast 2025-2030

Chart on Residential - Market size and forecast 2025-2030 ($ million)
Data Table on Residential - Market size and forecast 2025-2030 ($ million)
Chart on Residential - Year-over-year growth 2025-2030 (%)
Data Table on Residential - Year-over-year growth 2025-2030 (%)

9.4 Commercial - Market size and forecast 2025-2030

Chart on Commercial - Market size and forecast 2025-2030 ($ million)
Data Table on Commercial - Market size and forecast 2025-2030 ($ million)
Chart on Commercial - Year-over-year growth 2025-2030 (%)
Data Table on Commercial - Year-over-year growth 2025-2030 (%)

9.5 Market opportunity by End-user

Market opportunity by End-user ($ million)
Data Table on Market opportunity by End-user ($ million)

10. Market Segmentation by Frequency Range

10.1 Market segments

Chart on Frequency Range - Market share 2025-2030 (%)
Data Table on Frequency Range - Market share 2025-2030 (%)

10.2 Comparison by Frequency Range

Chart on Comparison by Frequency Range
Data Table on Comparison by Frequency Range

10.3 1-6 GHz - Market size and forecast 2025-2030

Chart on 1-6 GHz - Market size and forecast 2025-2030 ($ million)
Data Table on 1-6 GHz - Market size and forecast 2025-2030 ($ million)
Chart on 1-6 GHz - Year-over-year growth 2025-2030 (%)
Data Table on 1-6 GHz - Year-over-year growth 2025-2030 (%)

10.4 Less than 1 GHz - Market size and forecast 2025-2030

Chart on Less than 1 GHz - Market size and forecast 2025-2030 ($ million)
Data Table on Less than 1 GHz - Market size and forecast 2025-2030 ($ million)
Chart on Less than 1 GHz - Year-over-year growth 2025-2030 (%)
Data Table on Less than 1 GHz - Year-over-year growth 2025-2030 (%)

10.5 Above 6 GHz - Market size and forecast 2025-2030

Chart on Above 6 GHz - Market size and forecast 2025-2030 ($ million)
Data Table on Above 6 GHz - Market size and forecast 2025-2030 ($ million)
Chart on Above 6 GHz - Year-over-year growth 2025-2030 (%)
Data Table on Above 6 GHz - Year-over-year growth 2025-2030 (%)

10.6 Market opportunity by Frequency Range

Market opportunity by Frequency Range ($ million)
Data Table on Market opportunity by Frequency Range ($ million)

11. Customer Landscape

11.1 Customer landscape overview

Analysis of price sensitivity, lifecycle, customer purchase basket, adoption rates, and purchase criteria

12. Geographic Landscape

12.1 Geographic segmentation

Chart on Market share by geography 2025-2030 (%)
Data Table on Market share by geography 2025-2030 (%)

12.2 Geographic comparison

Chart on Geographic comparison
Data Table on Geographic comparison

12.3 North America - Market size and forecast 2025-2030

Chart on North America - Market size and forecast 2025-2030 ($ million)
Data Table on North America - Market size and forecast 2025-2030 ($ million)
Chart on North America - Year-over-year growth 2025-2030 (%)
Data Table on North America - Year-over-year growth 2025-2030 (%)
Chart on Regional Comparison - North America
Data Table on Regional Comparison - North America

12.3.1 US - Market size and forecast 2025-2030

Chart on US - Market size and forecast 2025-2030 ($ million)
Data Table on US - Market size and forecast 2025-2030 ($ million)
Chart on US - Year-over-year growth 2025-2030 (%)
Data Table on US - Year-over-year growth 2025-2030 (%)

12.3.2 Canada - Market size and forecast 2025-2030

Chart on Canada - Market size and forecast 2025-2030 ($ million)
Data Table on Canada - Market size and forecast 2025-2030 ($ million)
Chart on Canada - Year-over-year growth 2025-2030 (%)
Data Table on Canada - Year-over-year growth 2025-2030 (%)

12.3.3 Mexico - Market size and forecast 2025-2030

Chart on Mexico - Market size and forecast 2025-2030 ($ million)
Data Table on Mexico - Market size and forecast 2025-2030 ($ million)
Chart on Mexico - Year-over-year growth 2025-2030 (%)
Data Table on Mexico - Year-over-year growth 2025-2030 (%)

12.4 Europe - Market size and forecast 2025-2030

Chart on Europe - Market size and forecast 2025-2030 ($ million)
Data Table on Europe - Market size and forecast 2025-2030 ($ million)
Chart on Europe - Year-over-year growth 2025-2030 (%)
Data Table on Europe - Year-over-year growth 2025-2030 (%)
Chart on Regional Comparison - Europe
Data Table on Regional Comparison - Europe

12.4.1 Germany - Market size and forecast 2025-2030

Chart on Germany - Market size and forecast 2025-2030 ($ million)
Data Table on Germany - Market size and forecast 2025-2030 ($ million)
Chart on Germany - Year-over-year growth 2025-2030 (%)
Data Table on Germany - Year-over-year growth 2025-2030 (%)

12.4.2 UK - Market size and forecast 2025-2030

Chart on UK - Market size and forecast 2025-2030 ($ million)
Data Table on UK - Market size and forecast 2025-2030 ($ million)
Chart on UK - Year-over-year growth 2025-2030 (%)
Data Table on UK - Year-over-year growth 2025-2030 (%)

12.4.3 France - Market size and forecast 2025-2030

Chart on France - Market size and forecast 2025-2030 ($ million)
Data Table on France - Market size and forecast 2025-2030 ($ million)
Chart on France - Year-over-year growth 2025-2030 (%)
Data Table on France - Year-over-year growth 2025-2030 (%)

12.4.4 Italy - Market size and forecast 2025-2030

Chart on Italy - Market size and forecast 2025-2030 ($ million)
Data Table on Italy - Market size and forecast 2025-2030 ($ million)
Chart on Italy - Year-over-year growth 2025-2030 (%)
Data Table on Italy - Year-over-year growth 2025-2030 (%)

12.4.5 Spain - Market size and forecast 2025-2030

Chart on Spain - Market size and forecast 2025-2030 ($ million)
Data Table on Spain - Market size and forecast 2025-2030 ($ million)
Chart on Spain - Year-over-year growth 2025-2030 (%)
Data Table on Spain - Year-over-year growth 2025-2030 (%)

12.4.6 The Netherlands - Market size and forecast 2025-2030

Chart on The Netherlands - Market size and forecast 2025-2030 ($ million)
Data Table on The Netherlands - Market size and forecast 2025-2030 ($ million)
Chart on The Netherlands - Year-over-year growth 2025-2030 (%)
Data Table on The Netherlands - Year-over-year growth 2025-2030 (%)

12.5 APAC - Market size and forecast 2025-2030

Chart on APAC - Market size and forecast 2025-2030 ($ million)
Data Table on APAC - Market size and forecast 2025-2030 ($ million)
Chart on APAC - Year-over-year growth 2025-2030 (%)
Data Table on APAC - Year-over-year growth 2025-2030 (%)
Chart on Regional Comparison - APAC
Data Table on Regional Comparison - APAC

12.5.1 China - Market size and forecast 2025-2030

Chart on China - Market size and forecast 2025-2030 ($ million)
Data Table on China - Market size and forecast 2025-2030 ($ million)
Chart on China - Year-over-year growth 2025-2030 (%)
Data Table on China - Year-over-year growth 2025-2030 (%)

12.5.2 Japan - Market size and forecast 2025-2030

Chart on Japan - Market size and forecast 2025-2030 ($ million)
Data Table on Japan - Market size and forecast 2025-2030 ($ million)
Chart on Japan - Year-over-year growth 2025-2030 (%)
Data Table on Japan - Year-over-year growth 2025-2030 (%)

12.5.3 India - Market size and forecast 2025-2030

Chart on India - Market size and forecast 2025-2030 ($ million)
Data Table on India - Market size and forecast 2025-2030 ($ million)
Chart on India - Year-over-year growth 2025-2030 (%)
Data Table on India - Year-over-year growth 2025-2030 (%)

12.5.4 South Korea - Market size and forecast 2025-2030

Chart on South Korea - Market size and forecast 2025-2030 ($ million)
Data Table on South Korea - Market size and forecast 2025-2030 ($ million)
Chart on South Korea - Year-over-year growth 2025-2030 (%)
Data Table on South Korea - Year-over-year growth 2025-2030 (%)

12.5.5 Australia - Market size and forecast 2025-2030

Chart on Australia - Market size and forecast 2025-2030 ($ million)
Data Table on Australia - Market size and forecast 2025-2030 ($ million)
Chart on Australia - Year-over-year growth 2025-2030 (%)
Data Table on Australia - Year-over-year growth 2025-2030 (%)

12.5.6 Indonesia - Market size and forecast 2025-2030

Chart on Indonesia - Market size and forecast 2025-2030 ($ million)
Data Table on Indonesia - Market size and forecast 2025-2030 ($ million)
Chart on Indonesia - Year-over-year growth 2025-2030 (%)
Data Table on Indonesia - Year-over-year growth 2025-2030 (%)

12.6 Middle East and Africa - Market size and forecast 2025-2030

Chart on Middle East and Africa - Market size and forecast 2025-2030 ($ million)
Data Table on Middle East and Africa - Market size and forecast 2025-2030 ($ million)
Chart on Middle East and Africa - Year-over-year growth 2025-2030 (%)
Data Table on Middle East and Africa - Year-over-year growth 2025-2030 (%)
Chart on Regional Comparison - Middle East and Africa
Data Table on Regional Comparison - Middle East and Africa

12.6.1 Saudi Arabia - Market size and forecast 2025-2030

Chart on Saudi Arabia - Market size and forecast 2025-2030 ($ million)
Data Table on Saudi Arabia - Market size and forecast 2025-2030 ($ million)
Chart on Saudi Arabia - Year-over-year growth 2025-2030 (%)
Data Table on Saudi Arabia - Year-over-year growth 2025-2030 (%)

12.6.2 UAE - Market size and forecast 2025-2030

Chart on UAE - Market size and forecast 2025-2030 ($ million)
Data Table on UAE - Market size and forecast 2025-2030 ($ million)
Chart on UAE - Year-over-year growth 2025-2030 (%)
Data Table on UAE - Year-over-year growth 2025-2030 (%)

12.6.3 South Africa - Market size and forecast 2025-2030

Chart on South Africa - Market size and forecast 2025-2030 ($ million)
Data Table on South Africa - Market size and forecast 2025-2030 ($ million)
Chart on South Africa - Year-over-year growth 2025-2030 (%)
Data Table on South Africa - Year-over-year growth 2025-2030 (%)

12.6.4 Turkey - Market size and forecast 2025-2030

Chart on Turkey - Market size and forecast 2025-2030 ($ million)
Data Table on Turkey - Market size and forecast 2025-2030 ($ million)
Chart on Turkey - Year-over-year growth 2025-2030 (%)
Data Table on Turkey - Year-over-year growth 2025-2030 (%)

12.6.5 Egypt - Market size and forecast 2025-2030

Chart on Egypt - Market size and forecast 2025-2030 ($ million)
Data Table on Egypt - Market size and forecast 2025-2030 ($ million)
Chart on Egypt - Year-over-year growth 2025-2030 (%)
Data Table on Egypt - Year-over-year growth 2025-2030 (%)

12.7 South America - Market size and forecast 2025-2030

Chart on South America - Market size and forecast 2025-2030 ($ million)
Data Table on South America - Market size and forecast 2025-2030 ($ million)
Chart on South America - Year-over-year growth 2025-2030 (%)
Data Table on South America - Year-over-year growth 2025-2030 (%)
Chart on Regional Comparison - South America
Data Table on Regional Comparison - South America

12.7.1 Brazil - Market size and forecast 2025-2030

Chart on Brazil - Market size and forecast 2025-2030 ($ million)
Data Table on Brazil - Market size and forecast 2025-2030 ($ million)
Chart on Brazil - Year-over-year growth 2025-2030 (%)
Data Table on Brazil - Year-over-year growth 2025-2030 (%)

12.7.2 Argentina - Market size and forecast 2025-2030

Chart on Argentina - Market size and forecast 2025-2030 ($ million)
Data Table on Argentina - Market size and forecast 2025-2030 ($ million)
Chart on Argentina - Year-over-year growth 2025-2030 (%)
Data Table on Argentina - Year-over-year growth 2025-2030 (%)

12.7.3 Chile - Market size and forecast 2025-2030

Chart on Chile - Market size and forecast 2025-2030 ($ million)
Data Table on Chile - Market size and forecast 2025-2030 ($ million)
Chart on Chile - Year-over-year growth 2025-2030 (%)
Data Table on Chile - Year-over-year growth 2025-2030 (%)

12.8 Market opportunity by geography

Market opportunity by geography ($ million)
Data Tables on Market opportunity by geography ($ million)

13. Drivers, Challenges, and Opportunity

13.1 Market drivers

Bridging digital divide in underserved and rural areas
Superior cost-effectiveness and rapid deployment
Rising demand for high-bandwidth digital services

13.2 Market challenges

Pervasive network congestion and capacity constraints
Technological complexity and seamless network integration
Intensifying competition from alternative broadband technologies

13.3 Impact of drivers and challenges

Impact of drivers and challenges in 2025 and 2030

13.4 Market opportunities

Strategic transition and coexistence with 5G fixed wireless access
Increasing integration with internet of things ecosystem
Rise of advanced antennas and customer premises equipment

14. Competitive Landscape

14.1 Overview

14.2

Overview on criticality of inputs and factors of differentiation

14.3 Landscape disruption

Overview on factors of disruption

14.4 Industry risks

Impact of key risks on business

15. Competitive Analysis

15.1 Companies profiled

Companies covered

15.2 Company ranking index

15.3 Market positioning of companies

Matrix on companies position and classification

15.4 Airspan Networks Inc.

Airspan Networks Inc. - Overview
Airspan Networks Inc. - Product / Service
Airspan Networks Inc. - Key offerings
SWOT

15.5 CommScope Holding Co. Inc.

CommScope Holding Co. Inc. - Overview
CommScope Holding Co. Inc. - Business segments
CommScope Holding Co. Inc. - Key offerings
CommScope Holding Co. Inc. - Segment focus
SWOT

15.6 Huawei Technologies Co. Ltd.

Huawei Technologies Co. Ltd. - Overview
Huawei Technologies Co. Ltd. - Product / Service
Huawei Technologies Co. Ltd. - Key offerings
SWOT

15.7 Inseego Corp.

Inseego Corp. - Overview
Inseego Corp. - Product / Service
Inseego Corp. - Key offerings
SWOT

15.8 NETGEAR Inc.

NETGEAR Inc. - Overview
NETGEAR Inc. - Business segments
NETGEAR Inc. - Key offerings
NETGEAR Inc. - Segment focus
SWOT

15.9 Nokia Corp.

Nokia Corp. - Overview
Nokia Corp. - Business segments
Nokia Corp. - Key news
Nokia Corp. - Key offerings
Nokia Corp. - Segment focus
SWOT

15.10 RADWIN Ltd.

RADWIN Ltd. - Overview
RADWIN Ltd. - Product / Service
RADWIN Ltd. - Key offerings
SWOT

15.11 Shanghai Smawave Technology Co.

Shanghai Smawave Technology Co. - Overview
Shanghai Smawave Technology Co. - Product / Service
Shanghai Smawave Technology Co. - Key offerings
SWOT

15.12 Shenzhen Wewins Wireless Co. Ltd.

Shenzhen Wewins Wireless Co. Ltd. - Overview
Shenzhen Wewins Wireless Co. Ltd. - Product / Service
Shenzhen Wewins Wireless Co. Ltd. - Key offerings
SWOT

15.13 Telefonaktiebolaget Ericsson

Telefonaktiebolaget Ericsson - Overview
Telefonaktiebolaget Ericsson - Business segments
Telefonaktiebolaget Ericsson - Key news
Telefonaktiebolaget Ericsson - Key offerings
Telefonaktiebolaget Ericsson - Segment focus
SWOT

15.14 Telrad Networks Ltd.

Telrad Networks Ltd. - Overview
Telrad Networks Ltd. - Product / Service
Telrad Networks Ltd. - Key offerings
SWOT

15.15 Teltonika Networks

Teltonika Networks - Overview
Teltonika Networks - Product / Service
Teltonika Networks - Key offerings
SWOT

15.16 TP Link Corp. Ltd.

TP Link Corp. Ltd. - Overview
TP Link Corp. Ltd. - Product / Service
TP Link Corp. Ltd. - Key offerings
SWOT

15.17 ZTE Corp.

ZTE Corp. - Overview
ZTE Corp. - Business segments
ZTE Corp. - Key offerings
ZTE Corp. - Segment focus
SWOT

15.18 Zyxel Communications Corp.

Zyxel Communications Corp. - Overview
Zyxel Communications Corp. - Business segments
Zyxel Communications Corp. - Key offerings
Zyxel Communications Corp. - Segment focus
SWOT

16. Appendix

16.1 Scope of the report

Market definition
Objectives
Notes and caveats

16.2 Inclusions and exclusions checklist

Inclusions checklist
Exclusions checklist

16.3 Currency conversion rates for US$

16.4 Research methodology

16.5 Data procurement

Information sources

16.6 Data validation

16.7 Validation techniques employed for market sizing

16.8 Data synthesis

16.9 360 degree market analysis

16.10 List of abbreviations

Research Methodology

Technavio presents a detailed picture of the market by way of study, synthesis, and summation of data from multiple sources. The analysts have presented the various facets of the market with a particular focus on identifying the key industry influencers. The data thus presented is comprehensive, reliable, and the result of extensive research, both primary and secondary.

INFORMATION SOURCES

Primary sources

  • Manufacturers and suppliers
  • Channel partners
  • Industry experts
  • Strategic decision makers

Secondary sources

  • Industry journals and periodicals
  • Government data
  • Financial reports of key industry players
  • Historical data
  • Press releases

DATA ANALYSIS

Data Synthesis

  • Collation of data
  • Estimation of key figures
  • Analysis of derived insights

Data Validation

  • Triangulation with data models
  • Reference against proprietary databases
  • Corroboration with industry experts

REPORT WRITING

Qualitative

  • Market drivers
  • Market challenges
  • Market trends
  • Five forces analysis

Quantitative

  • Market size and forecast
  • Market segmentation
  • Geographical insights
  • Competitive landscape

Interested in this report?

Get your sample now to see our research methodology and insights!

Download Now

Frequently Asked Questions

Fixed Lte market growth will increase by USD 117918.9 million during 2026-2030.

The Fixed Lte market is expected to grow at a CAGR of 29% during 2026-2030.

Fixed Lte market is segmented by Solution (LTE infrastructure, Indoor and outdoor CPE) End-user (Residential, Commercial) Frequency range (1-6 GHz, Less than 1 GHz, Above 6 GHz)

Airspan Networks Inc., Baicells Technologies, BEC Technologies Inc., Beijing InHand Networks Technology, CommScope Holding Co. Inc., Huawei Technologies Co. Ltd., Inseego Corp., Jaton Technology Ltd, Jimi IoT Co. Ltd, NETGEAR Inc., Nokia Corp., RADWIN Ltd., Shanghai Smawave Technology Co., Shenzhen Wewins Wireless Co. Ltd., Telefonaktiebolaget Ericsson, Telrad Networks Ltd., Teltonika Networks, TP Link Corp. Ltd., ZTE Corp., Zyxel Communications Corp. are a few of the key vendors in the Fixed Lte market.

North America will register the highest growth rate of 33% among the other regions. Therefore, the Fixed Lte market in North America is expected to garner significant business opportunities for the vendors during the forecast period.

US, Canada, Mexico, Germany, UK, France, Italy, Spain, The Netherlands, China, Japan, India, South Korea, Australia, Indonesia, Saudi Arabia, UAE, South Africa, Turkey, Egypt, Brazil, Argentina, Chile

  • Bridging digital divide in underserved and rural areas is the driving factor this market.

The Fixed Lte market vendors should focus on grabbing business opportunities from the Solution segment as it accounted for the largest market share in the base year.
RIA - Research AI Assistant
Ask RIA
