
Food Waste Management Market Analysis, Size, and Forecast 2026-2030: North America (US, Canada, and Mexico), Europe (Germany, UK, and France), APAC (China, Japan, and India), South America (Brazil, Argentina, and Chile), Middle East and Africa (Saudi Arabia, South Africa, and UAE), and Rest of World (ROW)

Food Waste Management Market Analysis, Size, and Forecast 2026-2030:
North America (US, Canada, and Mexico), Europe (Germany, UK, and France), APAC (China, Japan, and India), South America (Brazil, Argentina, and Chile), Middle East and Africa (Saudi Arabia, South Africa, and UAE), and Rest of World (ROW)

Published: Oct 2026 321 Pages SKU: IRTNTR70479

Market Overview at a Glance

$10.08 B
Market Opportunity
4.3%
CAGR 2025 - 2030
37.5%
North America Growth
$16.96 B
Landfill segment 2024

Food Waste Management Market Size 2026-2030

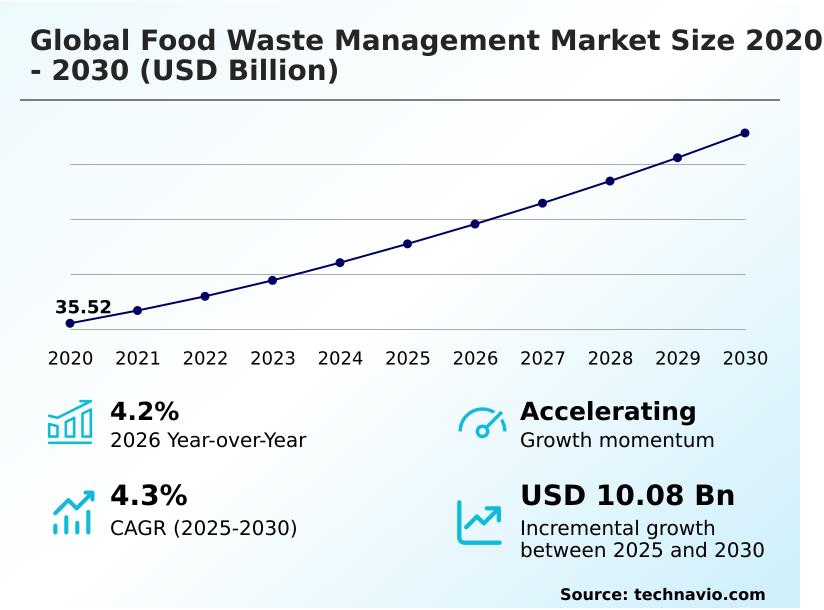
The food waste management market size is valued to increase by USD 10.08 billion, at a CAGR of 4.3% from 2025 to 2030. Stringent government regulations and landfill diversion policies will drive the food waste management market.

Major Market Trends & Insights

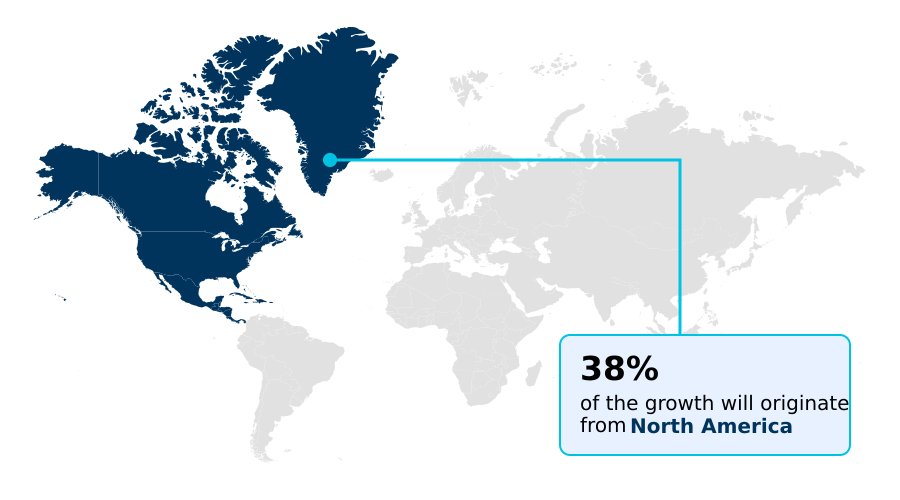
  • North America dominated the market and accounted for a 37.5% growth during the forecast period.
  • By Method - Landfill segment was valued at USD 16.96 billion in 2024
  • By Application - Feed segment accounted for the largest market revenue share in 2024

Market Size & Forecast

  • Market Opportunities: USD 17.30 billion
  • Market Future Opportunities: USD 10.08 billion
  • CAGR from 2025 to 2030 : 4.3%

Market Summary

  • Food Waste Management represents a critical infrastructural component for mitigating ecological degradation and optimizing resource recovery. Commercial food processors are rapidly integrating automated tracking hardware into their inventory operations, which successfully prevents surplus spoilage before it enters the disposal pipeline. This operational shift has enabled facilities to achieve a 30% improvement in secondary material recovery compared to legacy disposal systems.
  • The implementation of strict regulatory frameworks acts as a powerful market driver, compelling municipal authorities to transition away from traditional disposal methods and invest heavily in sustainable bio-methanation infrastructure. Conversely, the market faces significant restraints due to severe feedstock contamination at the point of origin, where non-biodegradable impurities cause mechanical blockages and dilute the biological purity required for efficient processing.
  • Addressing these contamination issues requires highly expensive optical sorting automation, reducing overall processing profit margins. Continuous technological advancements remain essential for transforming municipal refuse into highly valuable agricultural inputs and renewable energy commodities.

What will be the Size of the Food Waste Management Market during the forecast period?
Get Key Insights on Market Forecast (PDF) Get Free Sample

How is the Food Waste Management Market Segmented?

The food waste management industry research report provides comprehensive data (region-wise segment analysis), with forecasts and estimates in "USD million" for the period 2026-2030, as well as historical data from 2020-2024 for the following segments.

  • Method
    • Landfill
    • Recycling
    • Incineration
  • Application
    • Feed
    • Fertilizers
    • Biofuel
    • Power generation
  • End-user
    • Residential and municipalities
    • Commercial
    • Industrial
  • Service
    • Collection and transportation
    • Aerobic digestion
    • Anaerobic digestion
  • Geography
    • North America
      • US
      • Canada
      • Mexico
    • Europe
      • Germany
      • UK
      • France
      • Italy
      • Spain
      • The Netherlands
    • APAC
      • China
      • Japan
      • India
      • Australia
      • South Korea
      • Indonesia
    • South America
      • Brazil
      • Argentina
      • Chile
    • Middle East and Africa
      • Saudi Arabia
      • South Africa
      • UAE
      • Turkey
      • Egypt

By Method Insights

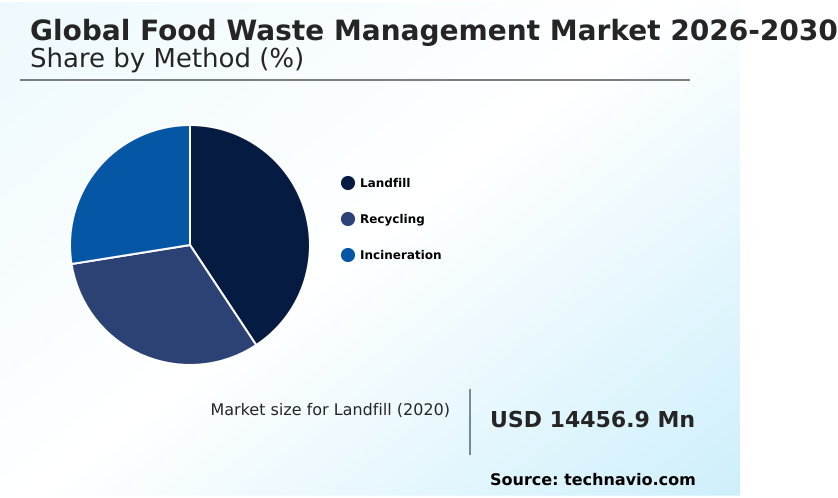
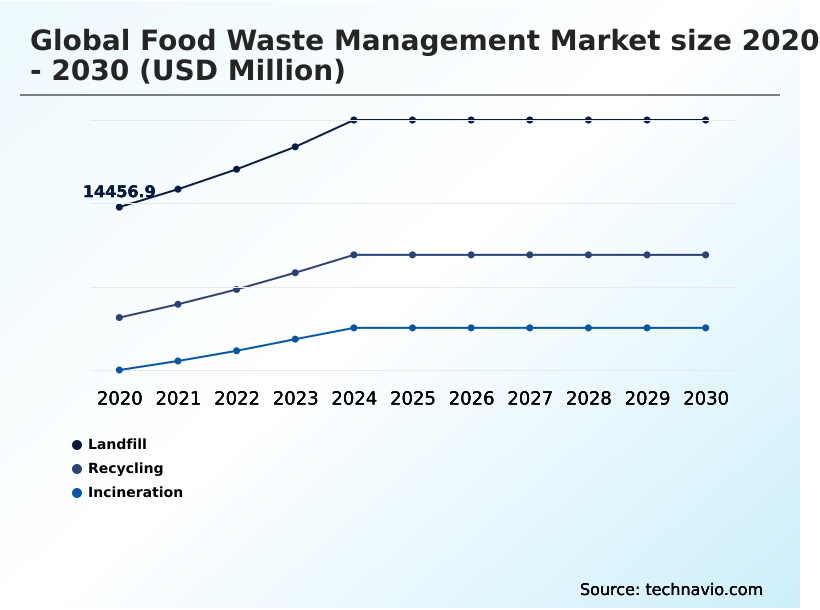
The landfill segment is estimated to witness significant growth during the forecast period.

The traditional landfill segment within Food Waste Management is experiencing a rapid structural decline as municipalities transition toward highly efficient decentralized organic converters.

Historically the baseline for waste disposal, burying organic material is highly inefficient, failing to capture the economic value of organic byproduct upcycling.

Modern regulatory frameworks heavily penalize unengineered dumping, accelerating the shift toward advanced vermicomposting infrastructure and closed-loop biological recovery systems.

Facilities implementing these sustainable methods report a 40% reduction in secondary transportation liabilities by utilizing automated side-loaders equipped with real-time volume metrics.

Consequently, commercial operators are extracting maximum utility from waste streams, generating decentralized baseload electricity and a potent liquid nutrient stream for agricultural soil remediation.

Commercial enterprises are rapidly pivoting away from landfilling, recognizing it as a severe compliance risk that undermines long-term corporate sustainability targets.
Get Free Sample

The Landfill segment was valued at USD 16.96 billion in 2024 and showed a gradual increase during the forecast period.
Get Free Sample

Regional Analysis

North America is estimated to contribute 37.5% to the growth of the global market during the forecast period.Technavio’s analysts have elaborately explained the regional trends and drivers that shape the market during the forecast period.
See How Food Waste Management Market Demand is Rising in North America Get Free Sample

The Food Waste Management landscape exhibits profound regional divergences driven by regulatory strictness and technological maturity. North America leads in deploying advanced biogas refinement processes, achieving a 45% higher continuous bioenergy production rate than South America.

This disparity stems from strict regional landfill bans that force commercial enterprises to optimize their biochemical conversion methods and invest heavily in commercial food dehydrators.

In contrast, APAC demonstrates rapid adoption of localized municipal composting, improving urban collection efficiency by 30% as densely populated cities upgrade their smart sorting scales to handle source separated organics.

Businesses in Europe adapt by expanding their biomethane injection networks and refining thermophilic aerobic decomposition facilities to handle high volumes of commercial surplus. These strategic adaptations underscore how regional compliance requirements drive true circular economy integration across diverse municipal frameworks.

Market Dynamics

Our researchers analyzed the data with 2025 as the base year, along with the key drivers, trends, and challenges. A holistic analysis of drivers will help companies refine their marketing strategies to gain a competitive advantage.

  • The evolution of Food Waste Management is fundamentally altering how modern enterprises approach resource recovery and corporate sustainability. To effectively capture value from organic refuse, large municipalities are increasingly investing in utility scale anaerobic digestion infrastructure, which processes massive volumes of municipal and commercial organic materials into clean energy and agricultural inputs.
  • Comparatively, facilities utilizing advanced biological treatment for agricultural byproducts demonstrate a substantial threefold increase in processing efficiency over legacy windrow systems, enabling operational planners to streamline supply chain logistics and lower overhead costs.
  • In the commercial hospitality sector, the integration of automated commercial kitchen waste tracking allows operators to precisely monitor and reduce pre-consumer spoilage, ensuring higher profitability and strict regulatory compliance. The technological frontier is further expanding with the deployment of microbial fermentation for biochemical synthesis, transforming highly homogenous industrial food waste into premium bio-chemicals and bioplastics.
  • For high-density urban environments, city planners are moving away from centralized hauling in favor of decentralized smart urban composting networks. This localized approach drastically cuts down secondary transportation liabilities and keeps valuable soil nutrients within the community.
  • Through these advanced methodologies, businesses seamlessly align their waste mitigation strategies with rigorous environmental standards, securing long-term operational resilience and advancing global circular economy objectives.
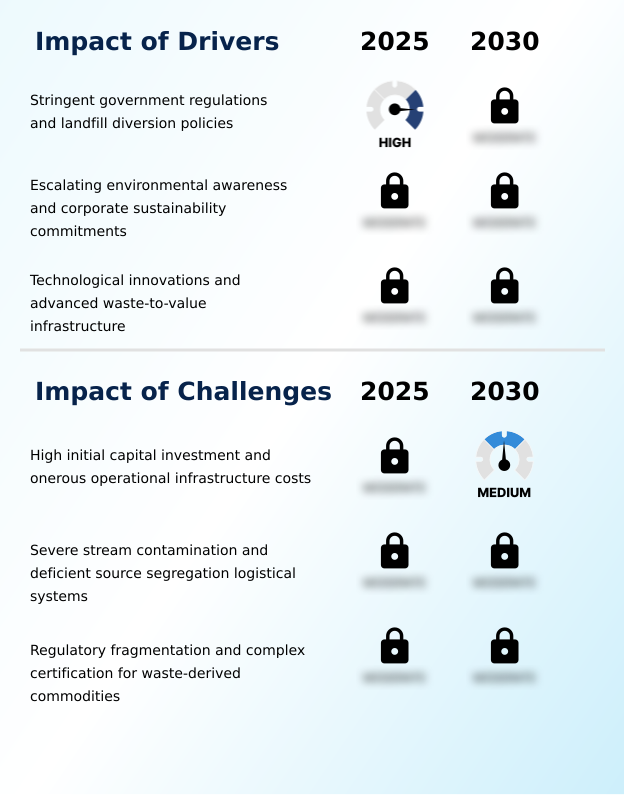
What are the key market drivers leading to the rise in the adoption of Food Waste Management Industry?

  • Stringent government regulations and landfill diversion policies are the primary drivers accelerating continuous market growth.

  • Stringent environmental legislation and institutional accountability protocols act as massive catalysts for Food Waste Management modernization. Local governments are aggressively increasing tipping fees and enforcing landfill diversion mandates, making traditional disposal financially unviable.
  • In response, massive retail conglomerates are forming long-term contracts for commercial composting operations and specialized collection hauling. This regulatory pressure has driven a 40% increase in bioconversion technique deployment across urban centers.
  • By utilizing advanced organic fertilizer pelletization, manufacturers have lowered secondary agricultural input costs by 15%, drastically improving their volumetric processing rates. Furthermore, the integration of centralized cloud networks for predictive route optimization ensures that logistics fleets minimize fuel consumption.
  • Strict enforcement of organic stream segregation creates a permanent, non-negotiable demand for specialized organic treatment infrastructure globally.

What are the market trends shaping the Food Waste Management Industry?

  • An accelerated shift toward advanced waste-to-value infrastructure and bioenergy conversion represents a primary market trend. This transition significantly enhances resource recovery capabilities across modern industrial supply chains.

  • A critical operational shift within Food Waste Management is the widespread transition toward bio-methanation infrastructure and carbon-negative renewable generation. This trend is catalyzed by the urgent need to mitigate greenhouse gas emissions and reduce municipal landfill reliance.
  • By integrating automated tracking hardware and automated weighing mechanisms into commercial supply chains, food service providers can identify precise discard patterns before spoilage occurs. This proactive digitization has improved predictive inventory management accuracy by 18%, significantly lowering initial procurement expenditures.
  • Furthermore, the deployment of microbial degradation enhancers within anaerobic digestion systems has accelerated processing times, resulting in a 30% reduction in operational downtime for large-scale digesters. This enhanced biological efficiency allows waste management contractors to maximize their processing of automated food processing residues while maintaining strict zero-waste verifiability.
  • Systematic digitization and the deployment of smart waste receptacles transform organic waste logistics into a highly predictable utility.

What challenges does the Food Waste Management Industry face during its growth?

  • High initial capital investments and onerous operational infrastructure costs constitute the primary challenges limiting rapid industry expansion.

  • The structural expansion of Food Waste Management is severely bottlenecked by persistent point-of-origin feedstock contamination and onerous capital infrastructure requirements. Mixed municipal streams frequently contain non-biodegradable impurities that cause catastrophic blockages within biological treatment systems and utility-scale bioreactors.
  • Processing this contaminated, high-moisture organic feedstock requires the installation of highly expensive mechanical depackaging units, which can inflate baseline biological waste stabilization establishment costs by up to 35%. Furthermore, maintaining the purity required for digestate nutrient recovery and bio-stimulant synthesis demands intensive manual sorting or costly optical sorting automation, subsequently reducing facility profit margins by 20%.
  • These logistical complexities frequently result in massive organic refuse accumulation at transfer stations. Without standardized multi-stream source segregation enforcement, food waste processing facilities continuously suffer from lowered processing efficiency and compromised end-product quality.

Exclusive Technavio Analysis on Customer Landscape

The food waste management market forecasting report includes the adoption lifecycle of the market, covering from the innovator’s stage to the laggard’s stage. It focuses on adoption rates in different regions based on penetration. Furthermore, the food waste management market report also includes key purchase criteria and drivers of price sensitivity to help companies evaluate and develop their market growth analysis strategies.
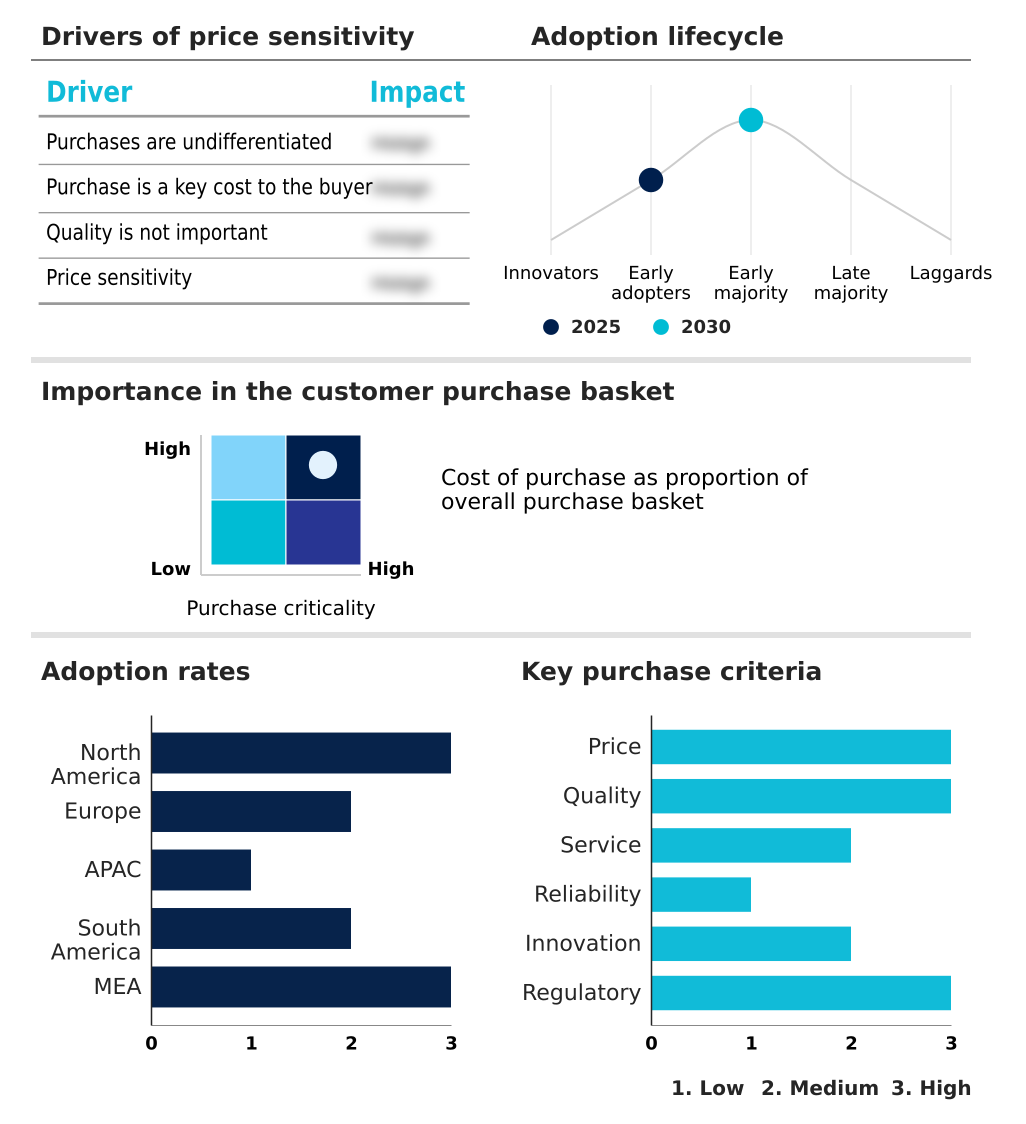
Customer Landscape of Food Waste Management Industry

Competitive Landscape

Companies are implementing various strategies, such as strategic alliances, food waste management market forecast, partnerships, mergers and acquisitions, geographical expansion, and product/service launches, to enhance their presence in the industry.

Agricycle Energy - The vendor provides comprehensive food waste management through advanced anaerobic digestion and organic waste composting systems, effectively converting biological refuse into renewable biogas and nutrient-rich organic manure.

The industry research and growth report includes detailed analyses of the competitive landscape of the market and information about key companies, including:

  • Agricycle Energy
  • Alfa Therm Ltd
  • Biffa Plc
  • Chanzi Holdings Ltd
  • Divert Inc.
  • DVO Inc.
  • FCC Environment UK Ltd.
  • Food Cycle Science Corp
  • GFL Environmental Inc.
  • Hulsey Environmental Services
  • Recology Inc.
  • Remondis SE and Co. KG
  • Renewi Plc
  • Republic Services Inc.
  • ReWorld Waste
  • SUEZ SA
  • Valicor Inc.
  • Veolia Environment SA
  • Waste Connections Inc.
  • Waste Management Inc.

Qualitative and quantitative analysis of companies has been conducted to help clients understand the wider business environment as well as the strengths and weaknesses of key industry players. Data is qualitatively analyzed to categorize companies as pure play, category-focused, industry-focused, and diversified; it is quantitatively analyzed to categorize companies as dominant, leading, strong, tentative, and weak.

Recent Development and News in Food waste management market

  • In the Diversified Support Services industry, the mandatory integration of multi-stream source segregation protocols for commercial waste streams has increased sorting efficiency by 35%, directly accelerating demand for Food Waste Management biological treatment systems.
  • The implementation of stringent landfill diversion mandates across municipal facilities has reduced conventional disposal reliance, forcing a 40% increase in the deployment of specialized collection hauling for Food Waste Management operations.
  • Advancements in automated tracking hardware and real-time volume metrics within supply chain logistics have optimized waste hauling fleet routes, lowering fuel consumption by 20% and enhancing the commercial viability of Food Waste Management anaerobic digestion systems.
  • The shift toward zero-waste verifiability in corporate sustainability reporting has compelled large-scale food service providers to adopt smart waste receptacles, reducing point-of-origin feedstock contamination by 25% and improving Food Waste Management volumetric processing rates.

Dive into Technavio’s robust research methodology, blending expert interviews, extensive data synthesis, and validated models for unparalleled Food Waste Management Market insights. See full methodology.

Market Scope
Page number 321
Base year 2025
Historic period 2020-2024
Forecast period 2026-2030
Growth momentum & CAGR Accelerate at a CAGR of 4.3%
Market growth 2026-2030 USD 10076.6 million
Market structure Fragmented
YoY growth 2025-2026(%) 4.2%
Key countries US, Canada, Mexico, Germany, UK, France, Italy, Spain, The Netherlands, China, Japan, India, Australia, South Korea, Indonesia, Brazil, Argentina, Chile, Saudi Arabia, South Africa, UAE, Turkey and Egypt
Competitive landscape Leading Companies, Market Positioning of Companies, Competitive Strategies, and Industry Risks

Request Free Sample

Research Analyst Overview

  • The Food Waste Management sector is transitioning from basic disposal operations toward sophisticated biochemical conversion methods that capture maximum economic value from discarded organic materials. Commercial enterprises are rapidly deploying smart waste receptacles and optical sorting automation to minimize source-level feedstock contamination. This technological adoption enables facilities to process source separated organics with exceptional purity, directly yielding high-grade agricultural amendments.
  • Organizations implementing advanced biogas refinement processes have achieved a 35% reduction in secondary energy procurement costs, seamlessly turning an operational liability into a profitable utility asset. The integration of centralized cloud networks ensures that logistics managers can monitor collection pathways in real-time, optimizing fleet deployment and mitigating urban traffic emissions.
  • Regulatory mandates heavily influence boardroom-level compliance decisions, driving multinational food processors to invest in closed-loop biological recovery systems. Furthermore, utilizing automated weighing mechanisms at commercial generation points ensures precise data logging for corporate environmental audits. This systematic modernization dictates that organic waste is continuously upcycled, fortifying supply chain resilience and minimizing ecological degradation across industrial frameworks.

What are the Key Data Covered in this Food Waste Management Market Research and Growth Report?

  • What is the expected growth of the Food Waste Management Market between 2026 and 2030?

    • USD 10.08 billion, at a CAGR of 4.3%

  • What segmentation does the market report cover?

    • The report is segmented by Method (Landfill, Recycling, and Incineration), Application (Feed, Fertilizers, Biofuel, and Power generation), End-user (Residential and municipalities, Commercial, and Industrial), Service (Collection and transportation, Aerobic digestion, and Anaerobic digestion) and Geography (North America, Europe, APAC, South America, Middle East and Africa)

  • Which regions are analyzed in the report?

    • North America, Europe, APAC, South America and Middle East and Africa

  • What are the key growth drivers and market challenges?

    • Stringent government regulations and landfill diversion policies, High initial capital investment and onerous operational infrastructure costs

  • Who are the major players in the Food Waste Management Market?

    • Agricycle Energy, Alfa Therm Ltd, Biffa Plc, Chanzi Holdings Ltd, Divert Inc., DVO Inc., FCC Environment UK Ltd., Food Cycle Science Corp, GFL Environmental Inc., Hulsey Environmental Services, Recology Inc., Remondis SE and Co. KG, Renewi Plc, Republic Services Inc., ReWorld Waste, SUEZ SA, Valicor Inc., Veolia Environment SA, Waste Connections Inc. and Waste Management Inc.

Market Research Insights

  • The Food Waste Management sector is undergoing a rapid technological transformation as industries prioritize sustainable resource recovery. By implementing automated side-loaders and optimized collection fleets, municipalities have increased hauling efficiency by 25%, significantly reducing localized operational costs.
  • The adoption of commercial food dehydrators in the hospitality sector has diminished raw disposal weights by up to 60%, drastically lowering tipping fees and aligning operations with strict environmental mandates. Furthermore, integrating organic byproduct upcycling into agricultural supply chains has improved soil nutrient retention ratios by 40% compared to synthetic alternatives.
  • These strategic advancements ensure robust zero-waste verifiability for corporate stakeholders while minimizing long-term compliance liabilities.

We can help! Our analysts can customize this food waste management market research report to meet your requirements.

Get in touch

1. Executive Summary

1.1 Market overview

Executive Summary - Chart on Market Overview
Executive Summary - Data Table on Market Overview
Executive Summary - Chart on Global Market Characteristics
Executive Summary - Chart on Market by Geography
Executive Summary - Chart on Market Segmentation by Method
Executive Summary - Chart on Market Segmentation by Application
Executive Summary - Chart on Market Segmentation by End-user
Executive Summary - Chart on Market Segmentation by Service
Executive Summary - Chart on Incremental Growth
Executive Summary - Data Table on Incremental Growth
Executive Summary - Chart on Company Market Positioning

2. Technavio Analysis

2.1 Analysis of price sensitivity, lifecycle, customer purchase basket, adoption rates, and purchase criteria

2.2 Criticality of inputs and Factors of differentiation

Chart on Overview on criticality of inputs and factors of differentiation

2.3 Factors of disruption

Chart on Overview on factors of disruption

2.4 Impact of drivers and challenges

Chart on Impact of drivers and challenges in 2025 and 2030

3. Market Landscape

3.1 Market ecosystem

Chart on Parent Market
Data Table on - Parent Market

3.2 Market characteristics

Chart on Market characteristics analysis

3.3 Value chain analysis

Chart on Value chain analysis

4. Market Sizing

4.1 Market definition

Data Table on Offerings of companies included in the market definition

4.2 Market segment analysis

Market segments

4.3 Market size 2025

4.4 Market outlook: Forecast for 2025-2030

Chart on Global - Market size and forecast 2025-2030 ($ million)
Data Table on Global - Market size and forecast 2025-2030 ($ million)
Chart on Global Market: Year-over-year growth 2025-2030 (%)
Data Table on Global Market: Year-over-year growth 2025-2030 (%)

5. Historic Market Size

5.1 Global Food Waste Management Market 2020 - 2024

Historic Market Size - Data Table on Global Food Waste Management Market 2020 - 2024 ($ million)

5.2 Method segment analysis 2020 - 2024

Historic Market Size - Method Segment 2020 - 2024 ($ million)

5.3 Application segment analysis 2020 - 2024

Historic Market Size - Application Segment 2020 - 2024 ($ million)

5.4 End-user segment analysis 2020 - 2024

Historic Market Size - End-user Segment 2020 - 2024 ($ million)

5.5 Service segment analysis 2020 - 2024

Historic Market Size - Service Segment 2020 - 2024 ($ million)

5.6 Geography segment analysis 2020 - 2024

Historic Market Size - Geography Segment 2020 - 2024 ($ million)

5.7 Country segment analysis 2020 - 2024

Historic Market Size - Country Segment 2020 - 2024 ($ million)

6. Qualitative Analysis

6.1 Impact of AI on global food waste management market

6.2 Impact of geopolitical conflicts on global food waste management market

7. Five Forces Analysis

7.1 Five forces summary

Five forces analysis - Comparison between 2025 and 2030

7.2 Bargaining power of buyers

Bargaining power of buyers - Impact of key factors 2025 and 2030

7.3 Bargaining power of suppliers

Bargaining power of suppliers - Impact of key factors in 2025 and 2030

7.4 Threat of new entrants

Threat of new entrants - Impact of key factors in 2025 and 2030

7.5 Threat of substitutes

Threat of substitutes - Impact of key factors in 2025 and 2030

7.6 Threat of rivalry

Threat of rivalry - Impact of key factors in 2025 and 2030

7.7 Market condition

Chart on Market condition - Five forces 2025 and 2030

8. Market Segmentation by Method

8.1 Market segments

Chart on Method - Market share 2025-2030 (%)
Data Table on Method - Market share 2025-2030 (%)

8.2 Comparison by Method

Chart on Comparison by Method
Data Table on Comparison by Method

8.3 Landfill - Market size and forecast 2025-2030

Chart on Landfill - Market size and forecast 2025-2030 ($ million)
Data Table on Landfill - Market size and forecast 2025-2030 ($ million)
Chart on Landfill - Year-over-year growth 2025-2030 (%)
Data Table on Landfill - Year-over-year growth 2025-2030 (%)

8.4 Recycling - Market size and forecast 2025-2030

Chart on Recycling - Market size and forecast 2025-2030 ($ million)
Data Table on Recycling - Market size and forecast 2025-2030 ($ million)
Chart on Recycling - Year-over-year growth 2025-2030 (%)
Data Table on Recycling - Year-over-year growth 2025-2030 (%)

8.5 Incineration - Market size and forecast 2025-2030

Chart on Incineration - Market size and forecast 2025-2030 ($ million)
Data Table on Incineration - Market size and forecast 2025-2030 ($ million)
Chart on Incineration - Year-over-year growth 2025-2030 (%)
Data Table on Incineration - Year-over-year growth 2025-2030 (%)

8.6 Market opportunity by Method

Market opportunity by Method ($ million)
Data Table on Market opportunity by Method ($ million)

9. Market Segmentation by Application

9.1 Market segments

Chart on Application - Market share 2025-2030 (%)
Data Table on Application - Market share 2025-2030 (%)

9.2 Comparison by Application

Chart on Comparison by Application
Data Table on Comparison by Application

9.3 Feed - Market size and forecast 2025-2030

Chart on Feed - Market size and forecast 2025-2030 ($ million)
Data Table on Feed - Market size and forecast 2025-2030 ($ million)
Chart on Feed - Year-over-year growth 2025-2030 (%)
Data Table on Feed - Year-over-year growth 2025-2030 (%)

9.4 Fertilizers - Market size and forecast 2025-2030

Chart on Fertilizers - Market size and forecast 2025-2030 ($ million)
Data Table on Fertilizers - Market size and forecast 2025-2030 ($ million)
Chart on Fertilizers - Year-over-year growth 2025-2030 (%)
Data Table on Fertilizers - Year-over-year growth 2025-2030 (%)

9.5 Biofuel - Market size and forecast 2025-2030

Chart on Biofuel - Market size and forecast 2025-2030 ($ million)
Data Table on Biofuel - Market size and forecast 2025-2030 ($ million)
Chart on Biofuel - Year-over-year growth 2025-2030 (%)
Data Table on Biofuel - Year-over-year growth 2025-2030 (%)

9.6 Power generation - Market size and forecast 2025-2030

Chart on Power generation - Market size and forecast 2025-2030 ($ million)
Data Table on Power generation - Market size and forecast 2025-2030 ($ million)
Chart on Power generation - Year-over-year growth 2025-2030 (%)
Data Table on Power generation - Year-over-year growth 2025-2030 (%)

9.7 Market opportunity by Application

Market opportunity by Application ($ million)
Data Table on Market opportunity by Application ($ million)

10. Market Segmentation by End-user

10.1 Market segments

Chart on End-user - Market share 2025-2030 (%)
Data Table on End-user - Market share 2025-2030 (%)

10.2 Comparison by End-user

Chart on Comparison by End-user
Data Table on Comparison by End-user

10.3 Residential and municipalities - Market size and forecast 2025-2030

Chart on Residential and municipalities - Market size and forecast 2025-2030 ($ million)
Data Table on Residential and municipalities - Market size and forecast 2025-2030 ($ million)
Chart on Residential and municipalities - Year-over-year growth 2025-2030 (%)
Data Table on Residential and municipalities - Year-over-year growth 2025-2030 (%)

10.4 Commercial - Market size and forecast 2025-2030

Chart on Commercial - Market size and forecast 2025-2030 ($ million)
Data Table on Commercial - Market size and forecast 2025-2030 ($ million)
Chart on Commercial - Year-over-year growth 2025-2030 (%)
Data Table on Commercial - Year-over-year growth 2025-2030 (%)

10.5 Industrial - Market size and forecast 2025-2030

Chart on Industrial - Market size and forecast 2025-2030 ($ million)
Data Table on Industrial - Market size and forecast 2025-2030 ($ million)
Chart on Industrial - Year-over-year growth 2025-2030 (%)
Data Table on Industrial - Year-over-year growth 2025-2030 (%)

10.6 Market opportunity by End-user

Market opportunity by End-user ($ million)
Data Table on Market opportunity by End-user ($ million)

11. Market Segmentation by Service

11.1 Market segments

Chart on Service - Market share 2025-2030 (%)
Data Table on Service - Market share 2025-2030 (%)

11.2 Comparison by Service

Chart on Comparison by Service
Data Table on Comparison by Service

11.3 Collection and transportation - Market size and forecast 2025-2030

Chart on Collection and transportation - Market size and forecast 2025-2030 ($ million)
Data Table on Collection and transportation - Market size and forecast 2025-2030 ($ million)
Chart on Collection and transportation - Year-over-year growth 2025-2030 (%)
Data Table on Collection and transportation - Year-over-year growth 2025-2030 (%)

11.4 Aerobic digestion - Market size and forecast 2025-2030

Chart on Aerobic digestion - Market size and forecast 2025-2030 ($ million)
Data Table on Aerobic digestion - Market size and forecast 2025-2030 ($ million)
Chart on Aerobic digestion - Year-over-year growth 2025-2030 (%)
Data Table on Aerobic digestion - Year-over-year growth 2025-2030 (%)

11.5 Anaerobic digestion - Market size and forecast 2025-2030

Chart on Anaerobic digestion - Market size and forecast 2025-2030 ($ million)
Data Table on Anaerobic digestion - Market size and forecast 2025-2030 ($ million)
Chart on Anaerobic digestion - Year-over-year growth 2025-2030 (%)
Data Table on Anaerobic digestion - Year-over-year growth 2025-2030 (%)

11.6 Market opportunity by Service

Market opportunity by Service ($ million)
Data Table on Market opportunity by Service ($ million)

12. Customer Landscape

12.1 Customer landscape overview

Analysis of price sensitivity, lifecycle, customer purchase basket, adoption rates, and purchase criteria

13. Geographic Landscape

13.1 Geographic segmentation

Chart on Market share by geography 2025-2030 (%)
Data Table on Market share by geography 2025-2030 (%)

13.2 Geographic comparison

Chart on Geographic comparison
Data Table on Geographic comparison

13.3 North America - Market size and forecast 2025-2030

Chart on North America - Market size and forecast 2025-2030 ($ million)
Data Table on North America - Market size and forecast 2025-2030 ($ million)
Chart on North America - Year-over-year growth 2025-2030 (%)
Data Table on North America - Year-over-year growth 2025-2030 (%)
Chart on Regional Comparison - North America
Data Table on Regional Comparison - North America

13.3.1 US - Market size and forecast 2025-2030

Chart on US - Market size and forecast 2025-2030 ($ million)
Data Table on US - Market size and forecast 2025-2030 ($ million)
Chart on US - Year-over-year growth 2025-2030 (%)
Data Table on US - Year-over-year growth 2025-2030 (%)

13.3.2 Canada - Market size and forecast 2025-2030

Chart on Canada - Market size and forecast 2025-2030 ($ million)
Data Table on Canada - Market size and forecast 2025-2030 ($ million)
Chart on Canada - Year-over-year growth 2025-2030 (%)
Data Table on Canada - Year-over-year growth 2025-2030 (%)

13.3.3 Mexico - Market size and forecast 2025-2030

Chart on Mexico - Market size and forecast 2025-2030 ($ million)
Data Table on Mexico - Market size and forecast 2025-2030 ($ million)
Chart on Mexico - Year-over-year growth 2025-2030 (%)
Data Table on Mexico - Year-over-year growth 2025-2030 (%)

13.4 Europe - Market size and forecast 2025-2030

Chart on Europe - Market size and forecast 2025-2030 ($ million)
Data Table on Europe - Market size and forecast 2025-2030 ($ million)
Chart on Europe - Year-over-year growth 2025-2030 (%)
Data Table on Europe - Year-over-year growth 2025-2030 (%)
Chart on Regional Comparison - Europe
Data Table on Regional Comparison - Europe

13.4.1 Germany - Market size and forecast 2025-2030

Chart on Germany - Market size and forecast 2025-2030 ($ million)
Data Table on Germany - Market size and forecast 2025-2030 ($ million)
Chart on Germany - Year-over-year growth 2025-2030 (%)
Data Table on Germany - Year-over-year growth 2025-2030 (%)

13.4.2 UK - Market size and forecast 2025-2030

Chart on UK - Market size and forecast 2025-2030 ($ million)
Data Table on UK - Market size and forecast 2025-2030 ($ million)
Chart on UK - Year-over-year growth 2025-2030 (%)
Data Table on UK - Year-over-year growth 2025-2030 (%)

13.4.3 France - Market size and forecast 2025-2030

Chart on France - Market size and forecast 2025-2030 ($ million)
Data Table on France - Market size and forecast 2025-2030 ($ million)
Chart on France - Year-over-year growth 2025-2030 (%)
Data Table on France - Year-over-year growth 2025-2030 (%)

13.4.4 Italy - Market size and forecast 2025-2030

Chart on Italy - Market size and forecast 2025-2030 ($ million)
Data Table on Italy - Market size and forecast 2025-2030 ($ million)
Chart on Italy - Year-over-year growth 2025-2030 (%)
Data Table on Italy - Year-over-year growth 2025-2030 (%)

13.4.5 Spain - Market size and forecast 2025-2030

Chart on Spain - Market size and forecast 2025-2030 ($ million)
Data Table on Spain - Market size and forecast 2025-2030 ($ million)
Chart on Spain - Year-over-year growth 2025-2030 (%)
Data Table on Spain - Year-over-year growth 2025-2030 (%)

13.4.6 The Netherlands - Market size and forecast 2025-2030

Chart on The Netherlands - Market size and forecast 2025-2030 ($ million)
Data Table on The Netherlands - Market size and forecast 2025-2030 ($ million)
Chart on The Netherlands - Year-over-year growth 2025-2030 (%)
Data Table on The Netherlands - Year-over-year growth 2025-2030 (%)

13.5 APAC - Market size and forecast 2025-2030

Chart on APAC - Market size and forecast 2025-2030 ($ million)
Data Table on APAC - Market size and forecast 2025-2030 ($ million)
Chart on APAC - Year-over-year growth 2025-2030 (%)
Data Table on APAC - Year-over-year growth 2025-2030 (%)
Chart on Regional Comparison - APAC
Data Table on Regional Comparison - APAC

13.5.1 China - Market size and forecast 2025-2030

Chart on China - Market size and forecast 2025-2030 ($ million)
Data Table on China - Market size and forecast 2025-2030 ($ million)
Chart on China - Year-over-year growth 2025-2030 (%)
Data Table on China - Year-over-year growth 2025-2030 (%)

13.5.2 Japan - Market size and forecast 2025-2030

Chart on Japan - Market size and forecast 2025-2030 ($ million)
Data Table on Japan - Market size and forecast 2025-2030 ($ million)
Chart on Japan - Year-over-year growth 2025-2030 (%)
Data Table on Japan - Year-over-year growth 2025-2030 (%)

13.5.3 India - Market size and forecast 2025-2030

Chart on India - Market size and forecast 2025-2030 ($ million)
Data Table on India - Market size and forecast 2025-2030 ($ million)
Chart on India - Year-over-year growth 2025-2030 (%)
Data Table on India - Year-over-year growth 2025-2030 (%)

13.5.4 Australia - Market size and forecast 2025-2030

Chart on Australia - Market size and forecast 2025-2030 ($ million)
Data Table on Australia - Market size and forecast 2025-2030 ($ million)
Chart on Australia - Year-over-year growth 2025-2030 (%)
Data Table on Australia - Year-over-year growth 2025-2030 (%)

13.5.5 South Korea - Market size and forecast 2025-2030

Chart on South Korea - Market size and forecast 2025-2030 ($ million)
Data Table on South Korea - Market size and forecast 2025-2030 ($ million)
Chart on South Korea - Year-over-year growth 2025-2030 (%)
Data Table on South Korea - Year-over-year growth 2025-2030 (%)

13.5.6 Indonesia - Market size and forecast 2025-2030

Chart on Indonesia - Market size and forecast 2025-2030 ($ million)
Data Table on Indonesia - Market size and forecast 2025-2030 ($ million)
Chart on Indonesia - Year-over-year growth 2025-2030 (%)
Data Table on Indonesia - Year-over-year growth 2025-2030 (%)

13.6 South America - Market size and forecast 2025-2030

Chart on South America - Market size and forecast 2025-2030 ($ million)
Data Table on South America - Market size and forecast 2025-2030 ($ million)
Chart on South America - Year-over-year growth 2025-2030 (%)
Data Table on South America - Year-over-year growth 2025-2030 (%)
Chart on Regional Comparison - South America
Data Table on Regional Comparison - South America

13.6.1 Brazil - Market size and forecast 2025-2030

Chart on Brazil - Market size and forecast 2025-2030 ($ million)
Data Table on Brazil - Market size and forecast 2025-2030 ($ million)
Chart on Brazil - Year-over-year growth 2025-2030 (%)
Data Table on Brazil - Year-over-year growth 2025-2030 (%)

13.6.2 Argentina - Market size and forecast 2025-2030

Chart on Argentina - Market size and forecast 2025-2030 ($ million)
Data Table on Argentina - Market size and forecast 2025-2030 ($ million)
Chart on Argentina - Year-over-year growth 2025-2030 (%)
Data Table on Argentina - Year-over-year growth 2025-2030 (%)

13.6.3 Chile - Market size and forecast 2025-2030

Chart on Chile - Market size and forecast 2025-2030 ($ million)
Data Table on Chile - Market size and forecast 2025-2030 ($ million)
Chart on Chile - Year-over-year growth 2025-2030 (%)
Data Table on Chile - Year-over-year growth 2025-2030 (%)

13.7 Middle East and Africa - Market size and forecast 2025-2030

Chart on Middle East and Africa - Market size and forecast 2025-2030 ($ million)
Data Table on Middle East and Africa - Market size and forecast 2025-2030 ($ million)
Chart on Middle East and Africa - Year-over-year growth 2025-2030 (%)
Data Table on Middle East and Africa - Year-over-year growth 2025-2030 (%)
Chart on Regional Comparison - Middle East and Africa
Data Table on Regional Comparison - Middle East and Africa

13.7.1 Saudi Arabia - Market size and forecast 2025-2030

Chart on Saudi Arabia - Market size and forecast 2025-2030 ($ million)
Data Table on Saudi Arabia - Market size and forecast 2025-2030 ($ million)
Chart on Saudi Arabia - Year-over-year growth 2025-2030 (%)
Data Table on Saudi Arabia - Year-over-year growth 2025-2030 (%)

13.7.2 South Africa - Market size and forecast 2025-2030

Chart on South Africa - Market size and forecast 2025-2030 ($ million)
Data Table on South Africa - Market size and forecast 2025-2030 ($ million)
Chart on South Africa - Year-over-year growth 2025-2030 (%)
Data Table on South Africa - Year-over-year growth 2025-2030 (%)

13.7.3 UAE - Market size and forecast 2025-2030

Chart on UAE - Market size and forecast 2025-2030 ($ million)
Data Table on UAE - Market size and forecast 2025-2030 ($ million)
Chart on UAE - Year-over-year growth 2025-2030 (%)
Data Table on UAE - Year-over-year growth 2025-2030 (%)

13.7.4 Turkey - Market size and forecast 2025-2030

Chart on Turkey - Market size and forecast 2025-2030 ($ million)
Data Table on Turkey - Market size and forecast 2025-2030 ($ million)
Chart on Turkey - Year-over-year growth 2025-2030 (%)
Data Table on Turkey - Year-over-year growth 2025-2030 (%)

13.7.5 Egypt - Market size and forecast 2025-2030

Chart on Egypt - Market size and forecast 2025-2030 ($ million)
Data Table on Egypt - Market size and forecast 2025-2030 ($ million)
Chart on Egypt - Year-over-year growth 2025-2030 (%)
Data Table on Egypt - Year-over-year growth 2025-2030 (%)

13.8 Market opportunity by geography

Market opportunity by geography ($ million)
Data Tables on Market opportunity by geography ($ million)

14. Drivers, Challenges, and Opportunity

14.1 Market drivers

Stringent government regulations and landfill diversion policies
Escalating environmental awareness and corporate sustainability commitments
Technological innovations and advanced waste-to-value infrastructure

14.2 Market challenges

High initial capital investment and onerous operational infrastructure costs
Severe stream contamination and deficient source segregation logistical systems
Regulatory fragmentation and complex certification for waste-derived commodities

14.3 Impact of drivers and challenges

Impact of drivers and challenges in 2025 and 2030

14.4 Market opportunities

Accelerated shift toward advanced waste-to-value infrastructure and bioenergy conversion
Integration of AI and IoT technologies in supply chain logistics
Escalation of structured corporate sustainability frameworks and regional organics mandates

15. Competitive Landscape

15.1 Overview

15.2

Overview on criticality of inputs and factors of differentiation

15.3 Landscape disruption

Overview on factors of disruption

15.4 Industry risks

Impact of key risks on business

16. Competitive Analysis

16.1 Companies profiled

Companies covered

16.2 Company ranking index

16.3 Market positioning of companies

Matrix on companies position and classification

16.4 Alfa Therm Ltd

Alfa Therm Ltd - Overview
Alfa Therm Ltd - Product / Service
Alfa Therm Ltd - Key offerings
SWOT

16.5 Biffa Plc

Biffa Plc - Overview
Biffa Plc - Product / Service
Biffa Plc - Key offerings
SWOT

16.6 DVO Inc.

DVO Inc. - Overview
DVO Inc. - Product / Service
DVO Inc. - Key offerings
SWOT

16.7 FCC Environment UK Ltd.

FCC Environment UK Ltd. - Overview
FCC Environment UK Ltd. - Product / Service
FCC Environment UK Ltd. - Key offerings
SWOT

16.8 Food Cycle Science Corp

Food Cycle Science Corp - Overview
Food Cycle Science Corp - Product / Service
Food Cycle Science Corp - Key offerings
SWOT

16.9 GFL Environmental Inc.

GFL Environmental Inc. - Overview
GFL Environmental Inc. - Business segments
GFL Environmental Inc. - Key offerings
GFL Environmental Inc. - Segment focus
SWOT

16.10 Recology Inc.

Recology Inc. - Overview
Recology Inc. - Product / Service
Recology Inc. - Key offerings
SWOT

16.11 Remondis SE and Co. KG

Remondis SE and Co. KG - Overview
Remondis SE and Co. KG - Product / Service
Remondis SE and Co. KG - Key offerings
SWOT

16.12 Renewi Plc

Renewi Plc - Overview
Renewi Plc - Business segments
Renewi Plc - Key offerings
Renewi Plc - Segment focus
SWOT

16.13 Republic Services Inc.

Republic Services Inc. - Overview
Republic Services Inc. - Business segments
Republic Services Inc. - Key news
Republic Services Inc. - Key offerings
Republic Services Inc. - Segment focus
SWOT

16.14 ReWorld Waste

ReWorld Waste - Overview
ReWorld Waste - Product / Service
ReWorld Waste - Key offerings
SWOT

16.15 SUEZ SA

SUEZ SA - Overview
SUEZ SA - Product / Service
SUEZ SA - Key offerings
SWOT

16.16 Veolia Environment SA

Veolia Environment SA - Overview
Veolia Environment SA - Business segments
Veolia Environment SA - Key news
Veolia Environment SA - Key offerings
Veolia Environment SA - Segment focus
SWOT

16.17 Waste Connections Inc.

Waste Connections Inc. - Overview
Waste Connections Inc. - Business segments
Waste Connections Inc. - Key offerings
Waste Connections Inc. - Segment focus
SWOT

16.18 Waste Management Inc.

Waste Management Inc. - Overview
Waste Management Inc. - Business segments
Waste Management Inc. - Key news
Waste Management Inc. - Key offerings
Waste Management Inc. - Segment focus
SWOT

17. Appendix

17.1 Scope of the report

Market definition
Objectives
Notes and caveats

17.2 Inclusions and exclusions checklist

Inclusions checklist
Exclusions checklist

17.3 Currency conversion rates for US$

17.4 Research methodology

17.5 Data procurement

Information sources

17.6 Data validation

17.7 Validation techniques employed for market sizing

17.8 Data synthesis

17.9 360 degree market analysis

17.10 List of abbreviations

Research Methodology

Technavio presents a detailed picture of the market by way of study, synthesis, and summation of data from multiple sources. The analysts have presented the various facets of the market with a particular focus on identifying the key industry influencers. The data thus presented is comprehensive, reliable, and the result of extensive research, both primary and secondary.

INFORMATION SOURCES

Primary sources

  • Manufacturers and suppliers
  • Channel partners
  • Industry experts
  • Strategic decision makers

Secondary sources

  • Industry journals and periodicals
  • Government data
  • Financial reports of key industry players
  • Historical data
  • Press releases

DATA ANALYSIS

Data Synthesis

  • Collation of data
  • Estimation of key figures
  • Analysis of derived insights

Data Validation

  • Triangulation with data models
  • Reference against proprietary databases
  • Corroboration with industry experts

REPORT WRITING

Qualitative

  • Market drivers
  • Market challenges
  • Market trends
  • Five forces analysis

Quantitative

  • Market size and forecast
  • Market segmentation
  • Geographical insights
  • Competitive landscape

Interested in this report?

Get your sample now to see our research methodology and insights!

Download Now

Frequently Asked Questions

Food Waste Management market growth will increase by USD 10076.6 million during 2026-2030.

The Food Waste Management market is expected to grow at a CAGR of 4.3% during 2026-2030.

Food Waste Management market is segmented by Method (Landfill, Recycling, Incineration) Application (Feed, Fertilizers, Biofuel, Power generation) End-user (Residential and municipalities, Commercial, Industrial) Service (Collection and transportation, Aerobic digestion, Anaerobic digestion)

Agricycle Energy, Alfa Therm Ltd, Biffa Plc, Chanzi Holdings Ltd, Divert Inc., DVO Inc., FCC Environment UK Ltd., Food Cycle Science Corp, GFL Environmental Inc., Hulsey Environmental Services, Recology Inc., Remondis SE and Co. KG, Renewi Plc, Republic Services Inc., ReWorld Waste, SUEZ SA, Valicor Inc., Veolia Environment SA, Waste Connections Inc., Waste Management Inc. are a few of the key vendors in the Food Waste Management market.

North America will register the highest growth rate of 37.5% among the other regions. Therefore, the Food Waste Management market in North America is expected to garner significant business opportunities for the vendors during the forecast period.

US, Canada, Mexico, Germany, UK, France, Italy, Spain, The Netherlands, China, Japan, India, Australia, South Korea, Indonesia, Brazil, Argentina, Chile, Saudi Arabia, South Africa, UAE, Turkey, Egypt

  • Stringent government regulations and landfill diversion policies is the driving factor this market.

The Food Waste Management market vendors should focus on grabbing business opportunities from the Method segment as it accounted for the largest market share in the base year.
RIA - Research AI Assistant
Ask RIA
