Geosynthetics Market Analysis, Size, and Forecast 2026-2030: APAC (China, India, and Japan), North America (US, Canada, and Mexico), Europe (Germany, France, and UK), Middle East and Africa (Saudi Arabia, UAE, and South Africa), South America (Brazil, Argentina, and Chile), and Rest of World (ROW)

Geosynthetics Market Analysis, Size, and Forecast 2026-2030:
APAC (China, India, and Japan), North America (US, Canada, and Mexico), Europe (Germany, France, and UK), Middle East and Africa (Saudi Arabia, UAE, and South Africa), South America (Brazil, Argentina, and Chile), and Rest of World (ROW)

Published: Oct 2026 308 Pages SKU: IRTNTR70915

Market Overview at a Glance

$8.57 B
Market Opportunity
8.3%
CAGR 2025 - 2030
40.4%
APAC Growth
$7.28 B
Geotextiles segment 2024

Geosynthetics Market Size 2026-2030

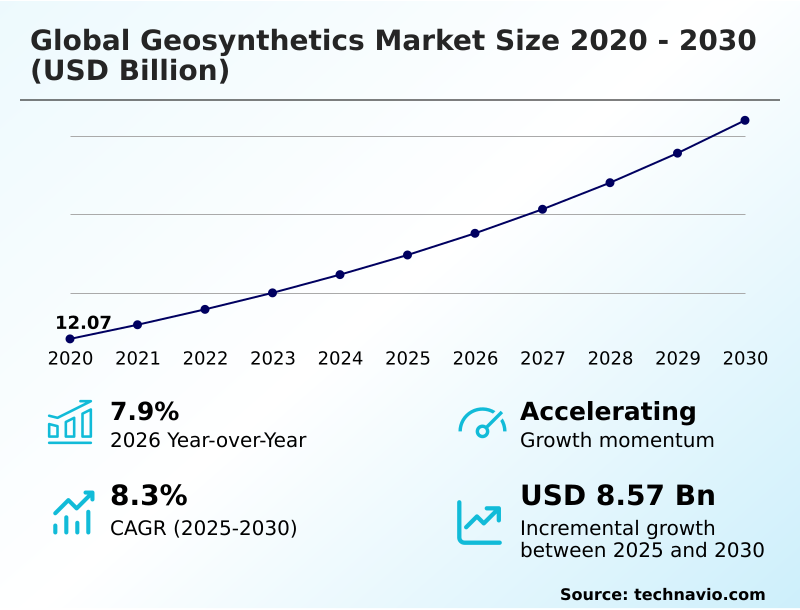
The geosynthetics market size is valued to increase by USD 8.57 billion, at a CAGR of 8.3% from 2025 to 2030. Infrastructure modernization and government funding will drive the geosynthetics market.

Major Market Trends & Insights

  • APAC dominated the market and accounted for a 40.4% growth during the forecast period.
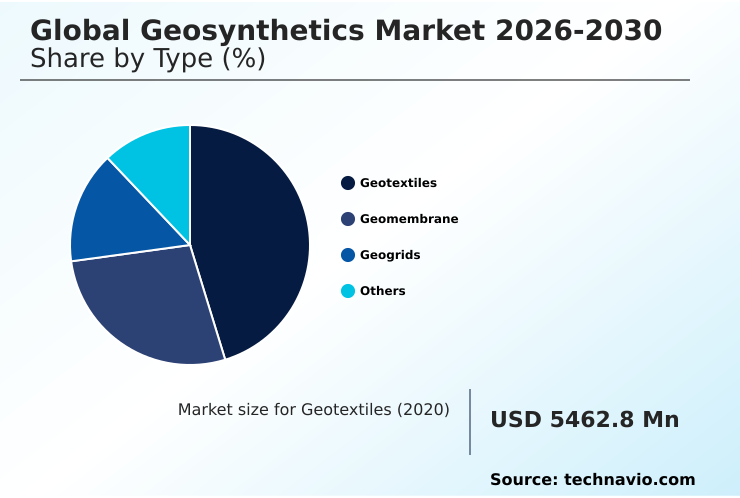
  • By Type - Geotextiles segment was valued at USD 7.28 billion in 2024
  • By End-user - Transportation infrastructure segment accounted for the largest market revenue share in 2024

Market Size & Forecast

  • Market Opportunities: USD 13.91 billion
  • Market Future Opportunities: USD 8.57 billion
  • CAGR from 2025 to 2030 : 8.3%

Market Summary

  • The Geosynthetics market demonstrates robust and sustained expansion, fundamentally driven by the escalating demand for advanced polymeric materials in heavy infrastructure development and environmental engineering. Modern construction paradigms increasingly prioritize structural longevity and resource efficiency, which heavily rely on specialized solutions like geogrids and geomembrane liners.
  • A significant operational driver is the urgent necessity for infrastructure modernization, where replacing traditional aggregate bases with synthetic reinforcement materials reduces aggregate consumption and carbon footprints. In complex supply chain operations, project planners integrating these advanced barriers into municipal solid waste containment have achieved a 30% reduction in long-term maintenance overhead compared to conventional clay lining methods.
  • However, the industry faces severe structural challenges stemming from the price volatility of petrochemical feedstocks, as fluctuations in crude oil directly inflate production costs and compress manufacturer profit margins. Navigating these raw material shortages compels extrusion companies to diversify their resin procurement networks.
  • Ultimately, stringent regulatory frameworks governing waste disposal force industrial facilities to deploy these high-performance materials, securing steady demand across varied civil applications.

What will be the Size of the Geosynthetics Market during the forecast period?
Get Key Insights on Market Forecast (PDF) Get Free Sample

How is the Geosynthetics Market Segmented?

The geosynthetics industry research report provides comprehensive data (region-wise segment analysis), with forecasts and estimates in "USD million" for the period 2026-2030, as well as historical data from 2020-2024 for the following segments.

  • Type
    • Geotextiles
    • Geomembrane
    • Geogrids
    • Others
  • End-user
    • Transportation infrastructure
    • Environmental engineering
    • Water infrastructure
    • Agriculture and aquaculture
    • Others
  • Product type
    • Sheet
    • 3D structures
    • Strips
  • Geography
    • APAC
      • China
      • India
      • Japan
      • South Korea
      • Australia
      • Indonesia
    • North America
      • US
      • Canada
      • Mexico
    • Europe
      • Germany
      • France
      • UK
      • Italy
      • Spain
      • The Netherlands
    • Middle East and Africa
      • Saudi Arabia
      • UAE
      • South Africa
      • Turkey
      • Israel
    • South America
      • Brazil
      • Argentina
      • Chile

By Type Insights

The geotextiles segment is estimated to witness significant growth during the forecast period.

Geotextiles constitute a foundational pillar within Geosynthetics, providing essential functions in civil construction and soil stabilization.

Manufactured predominantly from polymeric materials, these barriers optimize load distribution and structural load distribution over soft foundation soils, extending the operational lifespan of critical infrastructure.

The integration of advanced geotextiles reduces aggregate material dependency, enhancing operational efficiency by lowering construction material transport costs by up to 25%.

Furthermore, modern polymer formulations improve ultraviolet degradation stability and puncture resistance, yielding a 15% better performance in extreme environmental containment scenarios compared to traditional aggregate methods.

As authorities prioritize resilient infrastructure, continuous geotextile deployment remains indispensable for mitigating geotechnical risks across complex terrain profiles.
Get Free Sample

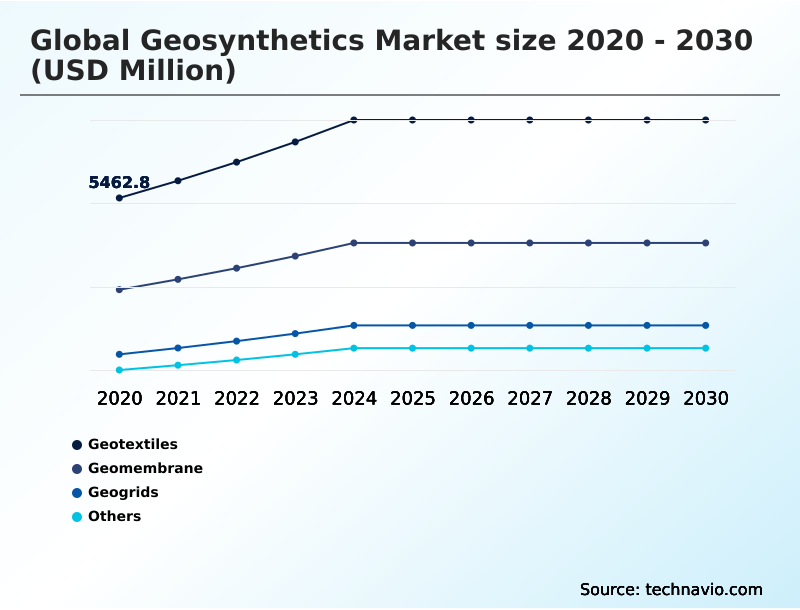
The Geotextiles segment was valued at USD 7.28 billion in 2024 and showed a gradual increase during the forecast period.
Get Free Sample

Regional Analysis

APAC is estimated to contribute 40.4% to the growth of the global market during the forecast period.Technavio’s analysts have elaborately explained the regional trends and drivers that shape the market during the forecast period.
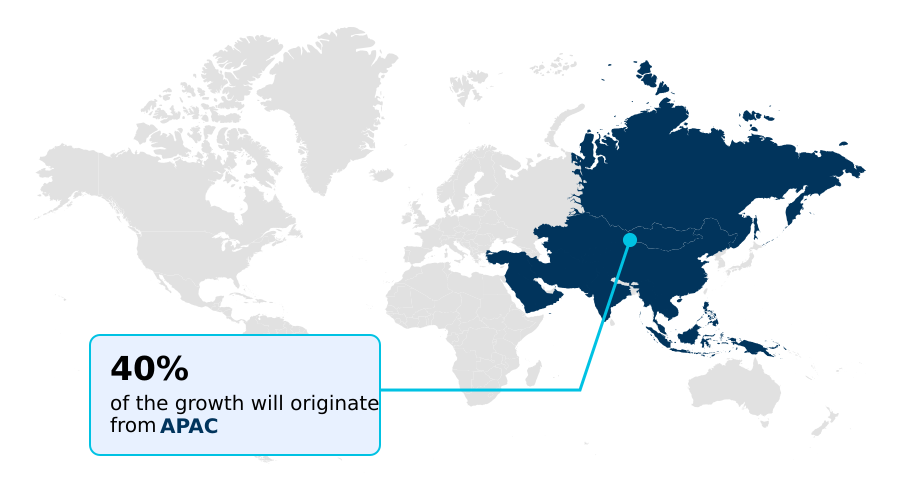
See How Geosynthetics Market Demand is Rising in APAC Get Free Sample

The regional dynamics of Geosynthetics reveal distinct adoption patterns shaped by local infrastructure priorities and regulatory frameworks.

APAC commands the highest consumption volume due to massive transportation infrastructure initiatives, utilizing advanced reinforcement capabilities and filtration layers to stabilize coastal protection zones.

In contrast, North America focuses on environmental compliance, where strict regulations for waste management facilities drive a 20% higher integration rate of high-density polyethylene containment liners compared to APAC.

Operational efficiency in North America benefits from established supply chains, reducing environmental disturbance and installation downtimes by 15%. Meanwhile, APAC exhibits a 30% faster deployment scale in projects involving sludge dewatering and dredging spoils due to subsidized public works.

These regional differences highlight how businesses adapt strategies; Asian manufacturers prioritize cost-effective solutions, whereas Western suppliers innovate premium barriers to align with rigid ecological mandates and complex pavement reinforcement demands.

Market Dynamics

Our researchers analyzed the data with 2025 as the base year, along with the key drivers, trends, and challenges. A holistic analysis of drivers will help companies refine their marketing strategies to gain a competitive advantage.

  • The strategic evolution of Geosynthetics is fundamentally transforming modern infrastructure development, driven by an urgent need for sustainable civil engineering geotechnical solutions. As civil contractors navigate increasingly complex regulatory environments and challenging topographical constraints, the reliance on traditional aggregate materials is rapidly diminishing. Instead, developers are integrating advanced geosynthetic soil reinforcement to optimize load-bearing capacities and stabilize marginal terrains.
  • This transition significantly enhances operational planning, allowing project managers to achieve a 25% faster construction completion rate compared to conventional foundational methods. In the realm of environmental protection and industrial waste management, strict compliance mandates necessitate the deployment of impermeable barriers. Consequently, facilities increasingly specify high density polyethylene containment liners to ensure absolute fluid retention and mitigate hazardous subsurface leaching.
  • Furthermore, coastal and embankment projects demand resilient surface protection, leading to the widespread installation of ultraviolet stabilized erosion control mats that withstand intense environmental degradation while promoting natural vegetation growth. For short-term ground stabilization and immediate ecological restoration efforts, site operators frequently utilize biodegradable natural fiber temporary geotextiles, which seamlessly decompose after fulfilling their structural purpose.
  • By adopting these sophisticated materials, engineering firms not only streamline their supply chain logistics through reduced heavy material transport but also align their operational outputs with stringent sustainability targets, securing long-term resilience across diverse civil applications.
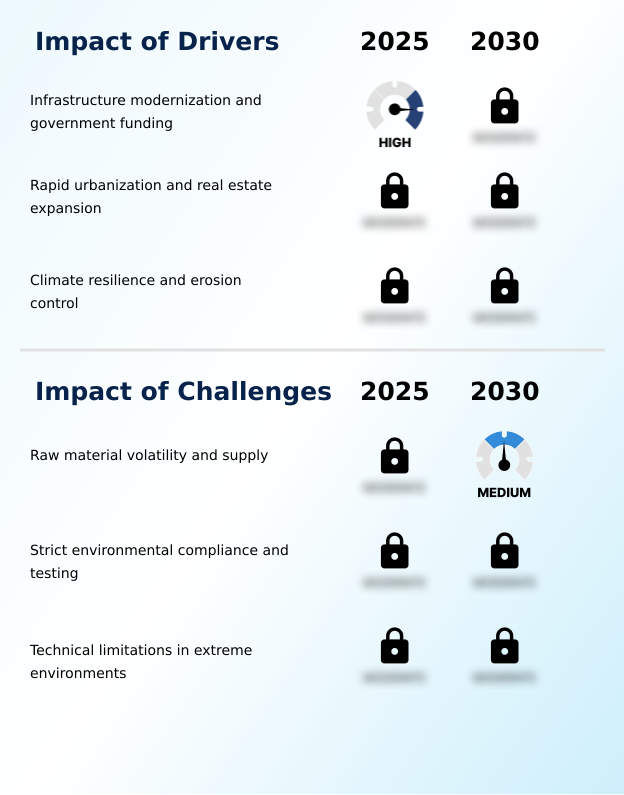
What are the key market drivers leading to the rise in the adoption of Geosynthetics Industry?

  • Infrastructure modernization initiatives, supported by substantial government funding, serve as the primary driver accelerating the widespread adoption of advanced civil engineering materials.

  • The urgent necessity to modernize aging public infrastructure and expand regional connectivity acts as a primary catalyst accelerating the adoption of Geosynthetics.
  • Decades of intensive use have left critical transportation infrastructure severely degraded, prompting authorities to mandate high-performance creep deformation resistance materials over traditional quarried aggregates.
  • This transition is happening because advanced polyester fibers and polypropylene resins provide superior subgrade reinforcement while significantly mitigating the logistical burdens of heavy construction.
  • As a direct effect, engineering contractors utilizing these modern techniques report a 40% decrease in aggregate material consumption and a 25% improvement in overall project execution speed.
  • By integrating specialized drainage solutions, developers drastically extend the operational lifecycle of municipal landfills, tailing dams, wastewater treatment lagoons, and heap leaching pads, maximizing public funding utility.

What are the market trends shaping the Geosynthetics Industry?

  • The expansion of mining waste containment represents a significant upcoming trend within the industry. This shift is driven by stringent environmental regulations requiring robust impermeable barriers to prevent hazardous leachate migration.

  • The integration of intelligent diagnostic monitoring systems within Geosynthetics represents a transformative trend reshaping geotechnical engineering. Engineering firms are increasingly embedding micro-sensors directly into separation systems and permeable barriers to monitor real-time strain and fluid systems behavior.
  • This technological convergence occurs because traditional underground structures often conceal critical shifts until visible surface distress manifests in water reservoirs and water management networks. By adopting these active data-gathering components, site operators experience a 35% improvement in predictive maintenance accuracy and a 20% reduction in structural failure rates across mining operations and waste disposal infrastructure.
  • Consequently, businesses can drastically lower their long-term liability overhead. The transition to intelligent networks prevents hazardous leachate migration into groundwater tables, ensuring that civil works adapt seamlessly to dynamic environmental stresses.

What challenges does the Geosynthetics Industry face during its growth?

  • The severe price volatility and supply chain instability of primary petrochemical raw materials present a critical challenge constraining consistent industry growth and operational profitability.

  • The severe price volatility and supply chain instability of primary petrochemical raw materials present a critical structural limitation for the Geosynthetics sector. Manufacturers depend heavily on crude oil derivatives to produce linear low-density polyethylene and geomembrane liners, meaning any geopolitical supply disruption instantly inflates input costs.
  • Because fierce market competition restricts the ability to pass these expenses to commercial contractors, mid-sized extrusion companies often experience a 15% contraction in cost efficiency and net operating margins. Additionally, localized shortages of specialized erosion control resins can delay agricultural projects involving solution collection ponds, irrigation canals, and farm reservoirs, extending lead times by up to 30%.
  • To mitigate these vulnerabilities and maintain structural integrity, producers must maintain expensive reserve inventories, thereby diverting critical capital away from advanced product innovation.

Exclusive Technavio Analysis on Customer Landscape

The geosynthetics market forecasting report includes the adoption lifecycle of the market, covering from the innovator’s stage to the laggard’s stage. It focuses on adoption rates in different regions based on penetration. Furthermore, the geosynthetics market report also includes key purchase criteria and drivers of price sensitivity to help companies evaluate and develop their market growth analysis strategies.
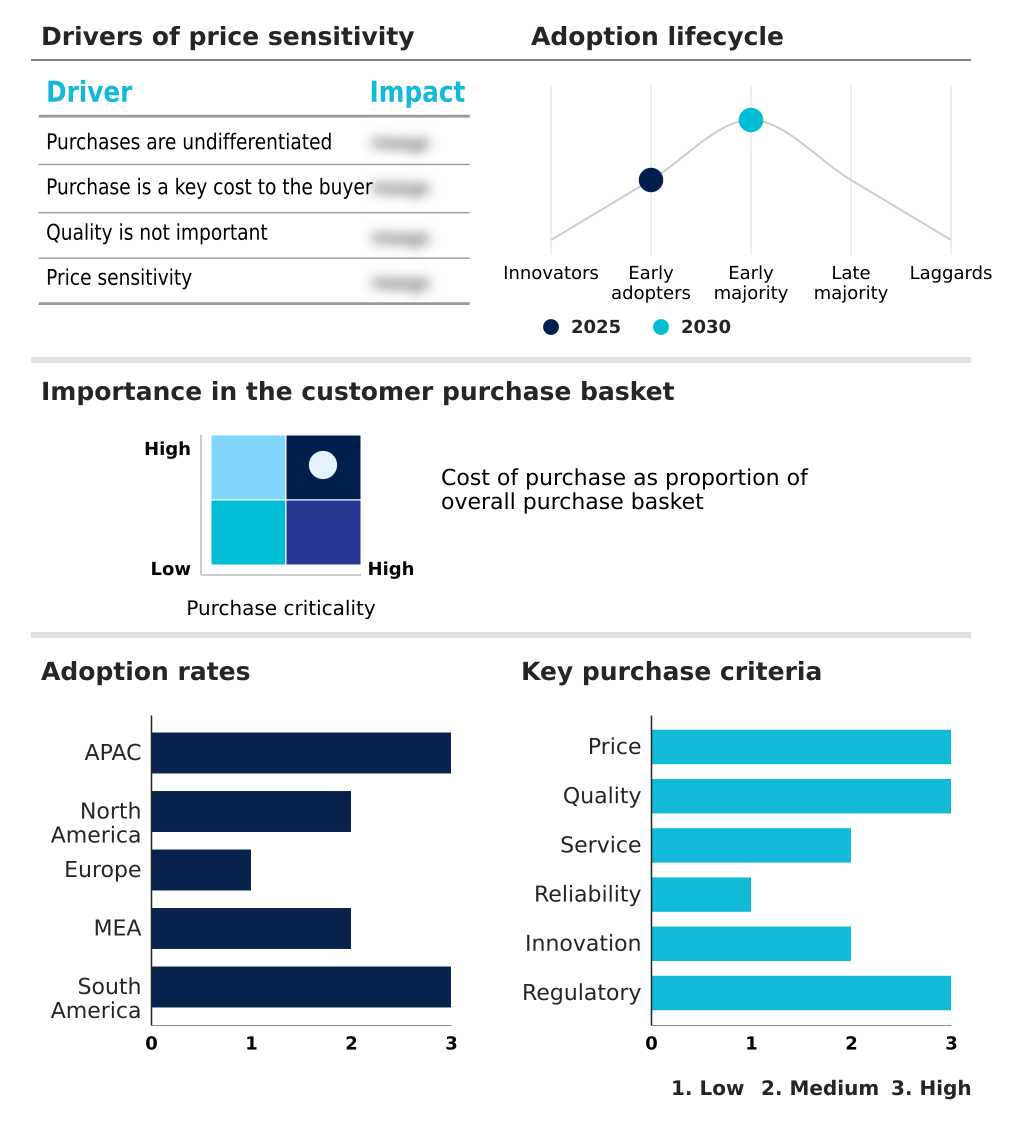
Customer Landscape of Geosynthetics Industry

Competitive Landscape

Companies are implementing various strategies, such as strategic alliances, geosynthetics market forecast, partnerships, mergers and acquisitions, geographical expansion, and product/service launches, to enhance their presence in the industry.

ABG Geosynthetics Ltd. - The entity provides high-performance Geosynthetics engineered for civil engineering, environmental protection, and sustainable building applications, delivering robust soil reinforcement and fluid management solutions across diverse infrastructure projects.

The industry research and growth report includes detailed analyses of the competitive landscape of the market and information about key companies, including:

  • ABG Geosynthetics Ltd.
  • ACE Geosynthetics Inc.
  • AGRU America Inc.
  • Carthage Mills Inc.
  • CTM Technical Textiles Ltd
  • Feicheng Lianyi Engineering
  • Fibertex Nonwovens AS
  • Geofabrics Australasia Pty Ltd
  • Geoplas Geosynthetics
  • Huesker Synthetic GmbH
  • NAUE GmbH and Co.KG
  • Officine Maccaferri Spa
  • Shandong Road New Materials Co
  • Shandong Taiwei Engineering Materials
  • SKAPS Industries Inc.
  • Solmax Inc
  • Strata Geosystems India Pvt. Ltd.
  • TechFab India Industries Ltd
  • TENAX Spa
  • Tensar Corp. LLC
  • Yixing Shenzhou Earth Working

Qualitative and quantitative analysis of companies has been conducted to help clients understand the wider business environment as well as the strengths and weaknesses of key industry players. Data is qualitatively analyzed to categorize companies as pure play, category-focused, industry-focused, and diversified; it is quantitatively analyzed to categorize companies as dominant, leading, strong, tentative, and weak.

Recent Development and News in Geosynthetics market

  • In the Commodity Chemicals industry, the shift toward sustainable polymer formulations and recycled resins has increased feedstock availability by 18%, directly impacting Geosynthetics demand by enabling the production of eco-friendly containment systems for waste management.
  • The implementation of the European Union Circular Economy Action Plan has mandated a 25% reduction in industrial carbon footprints, compelling manufacturers to adopt high-density polyethylene resins that enhance the structural integrity of advanced soil reinforcement.
  • Advancements in catalytic cracking processes have improved the yield of specialized polypropylene resins by 12%, significantly boosting the supply chain for manufacturing highly durable filtration networks used in transportation infrastructure.
  • Rigorous REACH regulatory updates regarding hazardous leachate migration have driven a 30% increase in the adoption of linear low-density polyethylene, reshaping the production of impermeable barriers required for critical groundwater protection.

Dive into Technavio’s robust research methodology, blending expert interviews, extensive data synthesis, and validated models for unparalleled Geosynthetics Market insights. See full methodology.

Market Scope
Page number 308
Base year 2025
Historic period 2020-2024
Forecast period 2026-2030
Growth momentum & CAGR Accelerate at a CAGR of 8.3%
Market growth 2026-2030 USD 8573.1 million
Market structure Fragmented
YoY growth 2025-2026(%) 7.9%
Key countries China, India, Japan, South Korea, Australia, Indonesia, US, Canada, Mexico, Germany, France, UK, Italy, Spain, The Netherlands, Saudi Arabia, UAE, South Africa, Turkey, Israel, Brazil, Argentina and Chile
Competitive landscape Leading Companies, Market Positioning of Companies, Competitive Strategies, and Industry Risks

Request Free Sample

Research Analyst Overview

  • The Geosynthetics landscape is undergoing a profound structural evolution as infrastructure demands intersect with stringent environmental compliance mandates. Polymeric materials have become indispensable for optimizing geotechnical engineering, replacing heavy aggregate layers with highly efficient synthetic alternatives. A critical boardroom-level trend is the accelerated integration of smart monitoring technologies within subgrade reinforcement networks.
  • By embedding continuous fiber optic sensors into drainage solutions and separation systems, engineering firms have achieved a 30% reduction in diagnostic assessment times for subterranean assets. This strategic shift enables proactive maintenance interventions, directly supporting long-term budget optimization and asset safety. Furthermore, the mandatory implementation of robust impermeable barriers in industrial applications prevents hazardous leachate from compromising delicate ecosystems.
  • Companies adapting to climate volatility increasingly specify specialized geomembrane liners to ensure absolute fluid containment under extreme operational stress. The continuous refinement of these advanced synthetic structures solidifies their role in resilient infrastructure, allowing public works and private developers to execute complex civil engineering projects with unprecedented structural longevity and ecological responsibility.

What are the Key Data Covered in this Geosynthetics Market Research and Growth Report?

  • What is the expected growth of the Geosynthetics Market between 2026 and 2030?

    • USD 8.57 billion, at a CAGR of 8.3%

  • What segmentation does the market report cover?

    • The report is segmented by Type (Geotextiles, Geomembrane, Geogrids, and Others), End-user (Transportation infrastructure, Environmental engineering, Water infrastructure, Agriculture and aquaculture, and Others), Product Type (Sheet, 3D structures, and Strips) and Geography (APAC, North America, Europe, Middle East and Africa, South America)

  • Which regions are analyzed in the report?

    • APAC, North America, Europe, Middle East and Africa and South America

  • What are the key growth drivers and market challenges?

    • Infrastructure modernization and government funding, Raw material volatility and supply

  • Who are the major players in the Geosynthetics Market?

    • ABG Geosynthetics Ltd., ACE Geosynthetics Inc., AGRU America Inc., Carthage Mills Inc., CTM Technical Textiles Ltd, Feicheng Lianyi Engineering, Fibertex Nonwovens AS, Geofabrics Australasia Pty Ltd, Geoplas Geosynthetics, Huesker Synthetic GmbH, NAUE GmbH and Co.KG, Officine Maccaferri Spa, Shandong Road New Materials Co, Shandong Taiwei Engineering Materials, SKAPS Industries Inc., Solmax Inc, Strata Geosystems India Pvt. Ltd., TechFab India Industries Ltd, TENAX Spa, Tensar Corp. LLC and Yixing Shenzhou Earth Working

Market Research Insights

  • The Geosynthetics sector operates as a critical enabler for modern civil construction, offering engineered materials that ensure superior load distribution and structural integrity across challenging environments. By replacing traditional building methodologies, projects utilizing advanced polymer solutions achieve up to a 40% improvement in cost efficiency while minimizing environmental disturbance.
  • Furthermore, the deployment of specialized containment barriers in waste disposal infrastructure yields a 25% increase in operational safety by effectively preventing hazardous leachate migration into groundwater tables. These engineered solutions allow municipal and industrial developers to meet stringent compliance mandates while optimizing resource utilization, establishing synthetic reinforcement as an indispensable component for future urban and agricultural water management frameworks.

We can help! Our analysts can customize this geosynthetics market research report to meet your requirements.

Get in touch

1. Executive Summary

1.1 Market overview

Executive Summary - Chart on Market Overview
Executive Summary - Data Table on Market Overview
Executive Summary - Chart on Global Market Characteristics
Executive Summary - Chart on Market by Geography
Executive Summary - Chart on Market Segmentation by Type
Executive Summary - Chart on Market Segmentation by End-user
Executive Summary - Chart on Market Segmentation by Product Type
Executive Summary - Chart on Incremental Growth
Executive Summary - Data Table on Incremental Growth
Executive Summary - Chart on Company Market Positioning

2. Technavio Analysis

2.1 Analysis of price sensitivity, lifecycle, customer purchase basket, adoption rates, and purchase criteria

2.2 Criticality of inputs and Factors of differentiation

Chart on Overview on criticality of inputs and factors of differentiation

2.3 Factors of disruption

Chart on Overview on factors of disruption

2.4 Impact of drivers and challenges

Chart on Impact of drivers and challenges in 2025 and 2030

3. Market Landscape

3.1 Market ecosystem

Chart on Parent Market
Data Table on - Parent Market

3.2 Market characteristics

Chart on Market characteristics analysis

3.3 Value chain analysis

Chart on Value chain analysis

4. Market Sizing

4.1 Market definition

Data Table on Offerings of companies included in the market definition

4.2 Market segment analysis

Market segments

4.3 Market size 2025

4.4 Market outlook: Forecast for 2025-2030

Chart on Global - Market size and forecast 2025-2030 ($ million)
Data Table on Global - Market size and forecast 2025-2030 ($ million)
Chart on Global Market: Year-over-year growth 2025-2030 (%)
Data Table on Global Market: Year-over-year growth 2025-2030 (%)

5. Historic Market Size

5.1 Global Geosynthetics Market 2020 - 2024

Historic Market Size - Data Table on Global Geosynthetics Market 2020 - 2024 ($ million)

5.2 Type segment analysis 2020 - 2024

Historic Market Size - Type Segment 2020 - 2024 ($ million)

5.3 End-user segment analysis 2020 - 2024

Historic Market Size - End-user Segment 2020 - 2024 ($ million)

5.4 Product Type segment analysis 2020 - 2024

Historic Market Size - Product Type Segment 2020 - 2024 ($ million)

5.5 Geography segment analysis 2020 - 2024

Historic Market Size - Geography Segment 2020 - 2024 ($ million)

5.6 Country segment analysis 2020 - 2024

Historic Market Size - Country Segment 2020 - 2024 ($ million)

6. Qualitative Analysis

6.1 Impact of AI on Global Geosynthetics Market

6.2 Impact of geopolitical conflicts on Global Geosynthetics Market

7. Five Forces Analysis

7.1 Five forces summary

Five forces analysis - Comparison between 2025 and 2030

7.2 Bargaining power of buyers

Bargaining power of buyers - Impact of key factors 2025 and 2030

7.3 Bargaining power of suppliers

Bargaining power of suppliers - Impact of key factors in 2025 and 2030

7.4 Threat of new entrants

Threat of new entrants - Impact of key factors in 2025 and 2030

7.5 Threat of substitutes

Threat of substitutes - Impact of key factors in 2025 and 2030

7.6 Threat of rivalry

Threat of rivalry - Impact of key factors in 2025 and 2030

7.7 Market condition

Chart on Market condition - Five forces 2025 and 2030

8. Market Segmentation by Type

8.1 Market segments

Chart on Type - Market share 2025-2030 (%)
Data Table on Type - Market share 2025-2030 (%)

8.2 Comparison by Type

Chart on Comparison by Type
Data Table on Comparison by Type

8.3 Geotextiles - Market size and forecast 2025-2030

Chart on Geotextiles - Market size and forecast 2025-2030 ($ million)
Data Table on Geotextiles - Market size and forecast 2025-2030 ($ million)
Chart on Geotextiles - Year-over-year growth 2025-2030 (%)
Data Table on Geotextiles - Year-over-year growth 2025-2030 (%)

8.4 Geomembrane - Market size and forecast 2025-2030

Chart on Geomembrane - Market size and forecast 2025-2030 ($ million)
Data Table on Geomembrane - Market size and forecast 2025-2030 ($ million)
Chart on Geomembrane - Year-over-year growth 2025-2030 (%)
Data Table on Geomembrane - Year-over-year growth 2025-2030 (%)

8.5 Geogrids - Market size and forecast 2025-2030

Chart on Geogrids - Market size and forecast 2025-2030 ($ million)
Data Table on Geogrids - Market size and forecast 2025-2030 ($ million)
Chart on Geogrids - Year-over-year growth 2025-2030 (%)
Data Table on Geogrids - Year-over-year growth 2025-2030 (%)

8.6 Others - Market size and forecast 2025-2030

Chart on Others - Market size and forecast 2025-2030 ($ million)
Data Table on Others - Market size and forecast 2025-2030 ($ million)
Chart on Others - Year-over-year growth 2025-2030 (%)
Data Table on Others - Year-over-year growth 2025-2030 (%)

8.7 Market opportunity by Type

Market opportunity by Type ($ million)
Data Table on Market opportunity by Type ($ million)

9. Market Segmentation by End-user

9.1 Market segments

Chart on End-user - Market share 2025-2030 (%)
Data Table on End-user - Market share 2025-2030 (%)

9.2 Comparison by End-user

Chart on Comparison by End-user
Data Table on Comparison by End-user

9.3 Transportation infrastructure - Market size and forecast 2025-2030

Chart on Transportation infrastructure - Market size and forecast 2025-2030 ($ million)
Data Table on Transportation infrastructure - Market size and forecast 2025-2030 ($ million)
Chart on Transportation infrastructure - Year-over-year growth 2025-2030 (%)
Data Table on Transportation infrastructure - Year-over-year growth 2025-2030 (%)

9.4 Environmental engineering - Market size and forecast 2025-2030

Chart on Environmental engineering - Market size and forecast 2025-2030 ($ million)
Data Table on Environmental engineering - Market size and forecast 2025-2030 ($ million)
Chart on Environmental engineering - Year-over-year growth 2025-2030 (%)
Data Table on Environmental engineering - Year-over-year growth 2025-2030 (%)

9.5 Water infrastructure - Market size and forecast 2025-2030

Chart on Water infrastructure - Market size and forecast 2025-2030 ($ million)
Data Table on Water infrastructure - Market size and forecast 2025-2030 ($ million)
Chart on Water infrastructure - Year-over-year growth 2025-2030 (%)
Data Table on Water infrastructure - Year-over-year growth 2025-2030 (%)

9.6 Agriculture and aquaculture - Market size and forecast 2025-2030

Chart on Agriculture and aquaculture - Market size and forecast 2025-2030 ($ million)
Data Table on Agriculture and aquaculture - Market size and forecast 2025-2030 ($ million)
Chart on Agriculture and aquaculture - Year-over-year growth 2025-2030 (%)
Data Table on Agriculture and aquaculture - Year-over-year growth 2025-2030 (%)

9.7 Others - Market size and forecast 2025-2030

Chart on Others - Market size and forecast 2025-2030 ($ million)
Data Table on Others - Market size and forecast 2025-2030 ($ million)
Chart on Others - Year-over-year growth 2025-2030 (%)
Data Table on Others - Year-over-year growth 2025-2030 (%)

9.8 Market opportunity by End-user

Market opportunity by End-user ($ million)
Data Table on Market opportunity by End-user ($ million)

10. Market Segmentation by Product Type

10.1 Market segments

Chart on Product Type - Market share 2025-2030 (%)
Data Table on Product Type - Market share 2025-2030 (%)

10.2 Comparison by Product Type

Chart on Comparison by Product Type
Data Table on Comparison by Product Type

10.3 Sheet - Market size and forecast 2025-2030

Chart on Sheet - Market size and forecast 2025-2030 ($ million)
Data Table on Sheet - Market size and forecast 2025-2030 ($ million)
Chart on Sheet - Year-over-year growth 2025-2030 (%)
Data Table on Sheet - Year-over-year growth 2025-2030 (%)

10.4 3D structures - Market size and forecast 2025-2030

Chart on 3D structures - Market size and forecast 2025-2030 ($ million)
Data Table on 3D structures - Market size and forecast 2025-2030 ($ million)
Chart on 3D structures - Year-over-year growth 2025-2030 (%)
Data Table on 3D structures - Year-over-year growth 2025-2030 (%)

10.5 Strips - Market size and forecast 2025-2030

Chart on Strips - Market size and forecast 2025-2030 ($ million)
Data Table on Strips - Market size and forecast 2025-2030 ($ million)
Chart on Strips - Year-over-year growth 2025-2030 (%)
Data Table on Strips - Year-over-year growth 2025-2030 (%)

10.6 Market opportunity by Product Type

Market opportunity by Product Type ($ million)
Data Table on Market opportunity by Product Type ($ million)

11. Customer Landscape

11.1 Customer landscape overview

Analysis of price sensitivity, lifecycle, customer purchase basket, adoption rates, and purchase criteria

12. Geographic Landscape

12.1 Geographic segmentation

Chart on Market share by geography 2025-2030 (%)
Data Table on Market share by geography 2025-2030 (%)

12.2 Geographic comparison

Chart on Geographic comparison
Data Table on Geographic comparison

12.3 APAC - Market size and forecast 2025-2030

Chart on APAC - Market size and forecast 2025-2030 ($ million)
Data Table on APAC - Market size and forecast 2025-2030 ($ million)
Chart on APAC - Year-over-year growth 2025-2030 (%)
Data Table on APAC - Year-over-year growth 2025-2030 (%)
Chart on Regional Comparison - APAC
Data Table on Regional Comparison - APAC

12.3.1 China - Market size and forecast 2025-2030

Chart on China - Market size and forecast 2025-2030 ($ million)
Data Table on China - Market size and forecast 2025-2030 ($ million)
Chart on China - Year-over-year growth 2025-2030 (%)
Data Table on China - Year-over-year growth 2025-2030 (%)

12.3.2 India - Market size and forecast 2025-2030

Chart on India - Market size and forecast 2025-2030 ($ million)
Data Table on India - Market size and forecast 2025-2030 ($ million)
Chart on India - Year-over-year growth 2025-2030 (%)
Data Table on India - Year-over-year growth 2025-2030 (%)

12.3.3 Japan - Market size and forecast 2025-2030

Chart on Japan - Market size and forecast 2025-2030 ($ million)
Data Table on Japan - Market size and forecast 2025-2030 ($ million)
Chart on Japan - Year-over-year growth 2025-2030 (%)
Data Table on Japan - Year-over-year growth 2025-2030 (%)

12.3.4 South Korea - Market size and forecast 2025-2030

Chart on South Korea - Market size and forecast 2025-2030 ($ million)
Data Table on South Korea - Market size and forecast 2025-2030 ($ million)
Chart on South Korea - Year-over-year growth 2025-2030 (%)
Data Table on South Korea - Year-over-year growth 2025-2030 (%)

12.3.5 Australia - Market size and forecast 2025-2030

Chart on Australia - Market size and forecast 2025-2030 ($ million)
Data Table on Australia - Market size and forecast 2025-2030 ($ million)
Chart on Australia - Year-over-year growth 2025-2030 (%)
Data Table on Australia - Year-over-year growth 2025-2030 (%)

12.3.6 Indonesia - Market size and forecast 2025-2030

Chart on Indonesia - Market size and forecast 2025-2030 ($ million)
Data Table on Indonesia - Market size and forecast 2025-2030 ($ million)
Chart on Indonesia - Year-over-year growth 2025-2030 (%)
Data Table on Indonesia - Year-over-year growth 2025-2030 (%)

12.4 North America - Market size and forecast 2025-2030

Chart on North America - Market size and forecast 2025-2030 ($ million)
Data Table on North America - Market size and forecast 2025-2030 ($ million)
Chart on North America - Year-over-year growth 2025-2030 (%)
Data Table on North America - Year-over-year growth 2025-2030 (%)
Chart on Regional Comparison - North America
Data Table on Regional Comparison - North America

12.4.1 US - Market size and forecast 2025-2030

Chart on US - Market size and forecast 2025-2030 ($ million)
Data Table on US - Market size and forecast 2025-2030 ($ million)
Chart on US - Year-over-year growth 2025-2030 (%)
Data Table on US - Year-over-year growth 2025-2030 (%)

12.4.2 Canada - Market size and forecast 2025-2030

Chart on Canada - Market size and forecast 2025-2030 ($ million)
Data Table on Canada - Market size and forecast 2025-2030 ($ million)
Chart on Canada - Year-over-year growth 2025-2030 (%)
Data Table on Canada - Year-over-year growth 2025-2030 (%)

12.4.3 Mexico - Market size and forecast 2025-2030

Chart on Mexico - Market size and forecast 2025-2030 ($ million)
Data Table on Mexico - Market size and forecast 2025-2030 ($ million)
Chart on Mexico - Year-over-year growth 2025-2030 (%)
Data Table on Mexico - Year-over-year growth 2025-2030 (%)

12.5 Europe - Market size and forecast 2025-2030

Chart on Europe - Market size and forecast 2025-2030 ($ million)
Data Table on Europe - Market size and forecast 2025-2030 ($ million)
Chart on Europe - Year-over-year growth 2025-2030 (%)
Data Table on Europe - Year-over-year growth 2025-2030 (%)
Chart on Regional Comparison - Europe
Data Table on Regional Comparison - Europe

12.5.1 Germany - Market size and forecast 2025-2030

Chart on Germany - Market size and forecast 2025-2030 ($ million)
Data Table on Germany - Market size and forecast 2025-2030 ($ million)
Chart on Germany - Year-over-year growth 2025-2030 (%)
Data Table on Germany - Year-over-year growth 2025-2030 (%)

12.5.2 France - Market size and forecast 2025-2030

Chart on France - Market size and forecast 2025-2030 ($ million)
Data Table on France - Market size and forecast 2025-2030 ($ million)
Chart on France - Year-over-year growth 2025-2030 (%)
Data Table on France - Year-over-year growth 2025-2030 (%)

12.5.3 UK - Market size and forecast 2025-2030

Chart on UK - Market size and forecast 2025-2030 ($ million)
Data Table on UK - Market size and forecast 2025-2030 ($ million)
Chart on UK - Year-over-year growth 2025-2030 (%)
Data Table on UK - Year-over-year growth 2025-2030 (%)

12.5.4 Italy - Market size and forecast 2025-2030

Chart on Italy - Market size and forecast 2025-2030 ($ million)
Data Table on Italy - Market size and forecast 2025-2030 ($ million)
Chart on Italy - Year-over-year growth 2025-2030 (%)
Data Table on Italy - Year-over-year growth 2025-2030 (%)

12.5.5 Spain - Market size and forecast 2025-2030

Chart on Spain - Market size and forecast 2025-2030 ($ million)
Data Table on Spain - Market size and forecast 2025-2030 ($ million)
Chart on Spain - Year-over-year growth 2025-2030 (%)
Data Table on Spain - Year-over-year growth 2025-2030 (%)

12.5.6 The Netherlands - Market size and forecast 2025-2030

Chart on The Netherlands - Market size and forecast 2025-2030 ($ million)
Data Table on The Netherlands - Market size and forecast 2025-2030 ($ million)
Chart on The Netherlands - Year-over-year growth 2025-2030 (%)
Data Table on The Netherlands - Year-over-year growth 2025-2030 (%)

12.6 Middle East and Africa - Market size and forecast 2025-2030

Chart on Middle East and Africa - Market size and forecast 2025-2030 ($ million)
Data Table on Middle East and Africa - Market size and forecast 2025-2030 ($ million)
Chart on Middle East and Africa - Year-over-year growth 2025-2030 (%)
Data Table on Middle East and Africa - Year-over-year growth 2025-2030 (%)
Chart on Regional Comparison - Middle East and Africa
Data Table on Regional Comparison - Middle East and Africa

12.6.1 Saudi Arabia - Market size and forecast 2025-2030

Chart on Saudi Arabia - Market size and forecast 2025-2030 ($ million)
Data Table on Saudi Arabia - Market size and forecast 2025-2030 ($ million)
Chart on Saudi Arabia - Year-over-year growth 2025-2030 (%)
Data Table on Saudi Arabia - Year-over-year growth 2025-2030 (%)

12.6.2 UAE - Market size and forecast 2025-2030

Chart on UAE - Market size and forecast 2025-2030 ($ million)
Data Table on UAE - Market size and forecast 2025-2030 ($ million)
Chart on UAE - Year-over-year growth 2025-2030 (%)
Data Table on UAE - Year-over-year growth 2025-2030 (%)

12.6.3 South Africa - Market size and forecast 2025-2030

Chart on South Africa - Market size and forecast 2025-2030 ($ million)
Data Table on South Africa - Market size and forecast 2025-2030 ($ million)
Chart on South Africa - Year-over-year growth 2025-2030 (%)
Data Table on South Africa - Year-over-year growth 2025-2030 (%)

12.6.4 Turkey - Market size and forecast 2025-2030

Chart on Turkey - Market size and forecast 2025-2030 ($ million)
Data Table on Turkey - Market size and forecast 2025-2030 ($ million)
Chart on Turkey - Year-over-year growth 2025-2030 (%)
Data Table on Turkey - Year-over-year growth 2025-2030 (%)

12.6.5 Israel - Market size and forecast 2025-2030

Chart on Israel - Market size and forecast 2025-2030 ($ million)
Data Table on Israel - Market size and forecast 2025-2030 ($ million)
Chart on Israel - Year-over-year growth 2025-2030 (%)
Data Table on Israel - Year-over-year growth 2025-2030 (%)

12.7 South America - Market size and forecast 2025-2030

Chart on South America - Market size and forecast 2025-2030 ($ million)
Data Table on South America - Market size and forecast 2025-2030 ($ million)
Chart on South America - Year-over-year growth 2025-2030 (%)
Data Table on South America - Year-over-year growth 2025-2030 (%)
Chart on Regional Comparison - South America
Data Table on Regional Comparison - South America

12.7.1 Brazil - Market size and forecast 2025-2030

Chart on Brazil - Market size and forecast 2025-2030 ($ million)
Data Table on Brazil - Market size and forecast 2025-2030 ($ million)
Chart on Brazil - Year-over-year growth 2025-2030 (%)
Data Table on Brazil - Year-over-year growth 2025-2030 (%)

12.7.2 Argentina - Market size and forecast 2025-2030

Chart on Argentina - Market size and forecast 2025-2030 ($ million)
Data Table on Argentina - Market size and forecast 2025-2030 ($ million)
Chart on Argentina - Year-over-year growth 2025-2030 (%)
Data Table on Argentina - Year-over-year growth 2025-2030 (%)

12.7.3 Chile - Market size and forecast 2025-2030

Chart on Chile - Market size and forecast 2025-2030 ($ million)
Data Table on Chile - Market size and forecast 2025-2030 ($ million)
Chart on Chile - Year-over-year growth 2025-2030 (%)
Data Table on Chile - Year-over-year growth 2025-2030 (%)

12.8 Market opportunity by geography

Market opportunity by geography ($ million)
Data Tables on Market opportunity by geography ($ million)

13. Drivers, Challenges, and Opportunity

13.1 Market drivers

Infrastructure modernization and government funding
Rapid urbanization and real estate expansion
Climate resilience and erosion control

13.2 Market challenges

Raw material volatility and supply
Strict environmental compliance and testing
Technical limitations in extreme environments

13.3 Impact of drivers and challenges

Impact of drivers and challenges in 2025 and 2030

13.4 Market opportunities

Expansion of mining waste containment
Adoption of coastal defense systems
Integration of smart geotechnical sensors

14. Competitive Landscape

14.1 Overview

14.2

Overview on criticality of inputs and factors of differentiation

14.3 Landscape disruption

Overview on factors of disruption

14.4 Industry risks

Impact of key risks on business

15. Competitive Analysis

15.1 Companies profiled

Companies covered

15.2 Company ranking index

15.3 Market positioning of companies

Matrix on companies position and classification

15.4 ACE Geosynthetics Inc.

ACE Geosynthetics Inc. - Overview
ACE Geosynthetics Inc. - Product / Service
ACE Geosynthetics Inc. - Key offerings
SWOT

15.5 AGRU America Inc.

AGRU America Inc. - Overview
AGRU America Inc. - Product / Service
AGRU America Inc. - Key offerings
SWOT

15.6 Carthage Mills Inc.

Carthage Mills Inc. - Overview
Carthage Mills Inc. - Product / Service
Carthage Mills Inc. - Key offerings
SWOT

15.7 CTM Technical Textiles Ltd

CTM Technical Textiles Ltd - Overview
CTM Technical Textiles Ltd - Product / Service
CTM Technical Textiles Ltd - Key offerings
SWOT

15.8 Feicheng Lianyi Engineering

Feicheng Lianyi Engineering - Overview
Feicheng Lianyi Engineering - Product / Service
Feicheng Lianyi Engineering - Key offerings
SWOT

15.9 Fibertex Nonwovens AS

Fibertex Nonwovens AS - Overview
Fibertex Nonwovens AS - Product / Service
Fibertex Nonwovens AS - Key offerings
SWOT

15.10 Geofabrics Australasia Pty Ltd

Geofabrics Australasia Pty Ltd - Overview
Geofabrics Australasia Pty Ltd - Product / Service
Geofabrics Australasia Pty Ltd - Key offerings
SWOT

15.11 Geoplas Geosynthetics

Geoplas Geosynthetics - Overview
Geoplas Geosynthetics - Product / Service
Geoplas Geosynthetics - Key offerings
SWOT

15.12 Huesker Synthetic GmbH

Huesker Synthetic GmbH - Overview
Huesker Synthetic GmbH - Product / Service
Huesker Synthetic GmbH - Key offerings
SWOT

15.13 NAUE GmbH and Co.KG

NAUE GmbH and Co.KG - Overview
NAUE GmbH and Co.KG - Product / Service
NAUE GmbH and Co.KG - Key offerings
SWOT

15.14 Officine Maccaferri Spa

Officine Maccaferri Spa - Overview
Officine Maccaferri Spa - Product / Service
Officine Maccaferri Spa - Key offerings
SWOT

15.15 Shandong Road New Materials Co

Shandong Road New Materials Co - Overview
Shandong Road New Materials Co - Product / Service
Shandong Road New Materials Co - Key offerings
SWOT

15.16 Shandong Taiwei Engineering Materials

Shandong Taiwei Engineering Materials - Overview
Shandong Taiwei Engineering Materials - Product / Service
Shandong Taiwei Engineering Materials - Key offerings
SWOT

15.17 Solmax Inc

Solmax Inc - Overview
Solmax Inc - Product / Service
Solmax Inc - Key offerings
SWOT

15.18 Tensar Corp. LLC

Tensar Corp. LLC - Overview
Tensar Corp. LLC - Product / Service
Tensar Corp. LLC - Key offerings
SWOT

16. Appendix

16.1 Scope of the report

Market definition
Objectives
Notes and caveats

16.2 Inclusions and exclusions checklist

Inclusions checklist
Exclusions checklist

16.3 Currency conversion rates for US$

16.4 Research methodology

16.5 Data procurement

Information sources

16.6 Data validation

16.7 Validation techniques employed for market sizing

16.8 Data synthesis

16.9 360 degree market analysis

16.10 List of abbreviations

Research Methodology

Technavio presents a detailed picture of the market by way of study, synthesis, and summation of data from multiple sources. The analysts have presented the various facets of the market with a particular focus on identifying the key industry influencers. The data thus presented is comprehensive, reliable, and the result of extensive research, both primary and secondary.

INFORMATION SOURCES

Primary sources

  • Manufacturers and suppliers
  • Channel partners
  • Industry experts
  • Strategic decision makers

Secondary sources

  • Industry journals and periodicals
  • Government data
  • Financial reports of key industry players
  • Historical data
  • Press releases

DATA ANALYSIS

Data Synthesis

  • Collation of data
  • Estimation of key figures
  • Analysis of derived insights

Data Validation

  • Triangulation with data models
  • Reference against proprietary databases
  • Corroboration with industry experts

REPORT WRITING

Qualitative

  • Market drivers
  • Market challenges
  • Market trends
  • Five forces analysis

Quantitative

  • Market size and forecast
  • Market segmentation
  • Geographical insights
  • Competitive landscape

Interested in this report?

Get your sample now to see our research methodology and insights!

Download Now

Frequently Asked Questions

Geosynthetics market growth will increase by USD 8573.1 million during 2026-2030.

The Geosynthetics market is expected to grow at a CAGR of 8.3% during 2026-2030.

Geosynthetics market is segmented by Type (Geotextiles, Geomembrane, Geogrids, Others) End-user (Transportation infrastructure, Environmental engineering, Water infrastructure, Agriculture and aquaculture, Others) Product type (Sheet, 3D structures, Strips)

ABG Geosynthetics Ltd., ACE Geosynthetics Inc., AGRU America Inc., Carthage Mills Inc., CTM Technical Textiles Ltd, Feicheng Lianyi Engineering, Fibertex Nonwovens AS, Geofabrics Australasia Pty Ltd, Geoplas Geosynthetics, Huesker Synthetic GmbH, NAUE GmbH and Co.KG, Officine Maccaferri Spa, Shandong Road New Materials Co, Shandong Taiwei Engineering Materials, SKAPS Industries Inc., Solmax Inc, Strata Geosystems India Pvt. Ltd., TechFab India Industries Ltd, TENAX Spa, Tensar Corp. LLC, Yixing Shenzhou Earth Working are a few of the key vendors in the Geosynthetics market.

APAC will register the highest growth rate of 40.4% among the other regions. Therefore, the Geosynthetics market in APAC is expected to garner significant business opportunities for the vendors during the forecast period.

China, India, Japan, South Korea, Australia, Indonesia, US, Canada, Mexico, Germany, France, UK, Italy, Spain, The Netherlands, Saudi Arabia, UAE, South Africa, Turkey, Israel, Brazil, Argentina, Chile

  • Infrastructure modernization and government funding is the driving factor this market.

The Geosynthetics market vendors should focus on grabbing business opportunities from the Type segment as it accounted for the largest market share in the base year.
RIA - Research AI Assistant
Ask RIA
