
Climbing Gym Market Analysis, Size, and Forecast 2026-2030: North America (US, Canada, and Mexico), Europe (Germany, UK, and France), APAC (China, Japan, and India), South America (Brazil, Argentina, and Chile), Middle East and Africa (Saudi Arabia, UAE, and South Africa), and Rest of World (ROW)

Climbing Gym Market Analysis, Size, and Forecast 2026-2030:
North America (US, Canada, and Mexico), Europe (Germany, UK, and France), APAC (China, Japan, and India), South America (Brazil, Argentina, and Chile), Middle East and Africa (Saudi Arabia, UAE, and South Africa), and Rest of World (ROW)

Published: Oct 2026 289 Pages SKU: IRTNTR71581

Market Overview at a Glance

$5.89 B
Market Opportunity
12.6%
CAGR 2025 - 2030
40.8%
North America Growth
$3.87 B
Indoor segment 2024

Climbing Gym Market Size 2026-2030

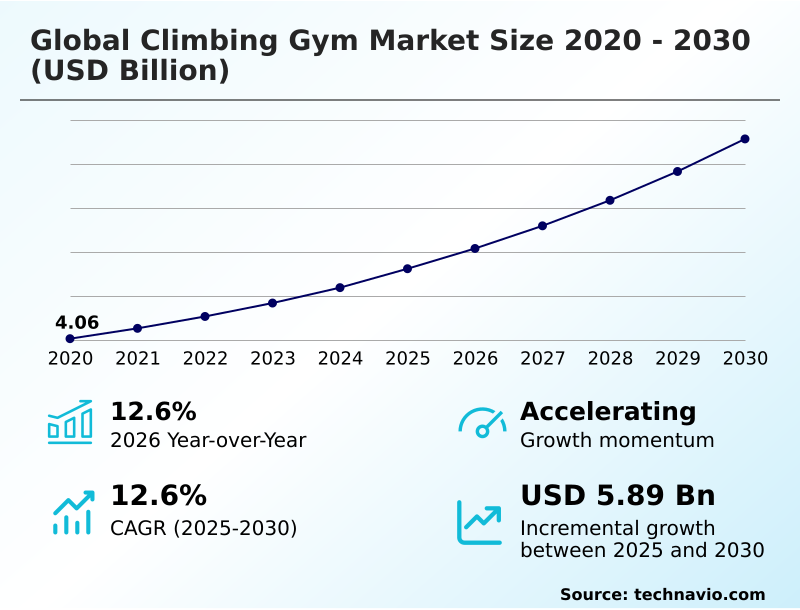
The climbing gym market size is valued to increase by USD 5.89 billion, at a CAGR of 12.6% from 2025 to 2030. Growing participation in indoor climbing activities will drive the climbing gym market.

Major Market Trends & Insights

  • North America dominated the market and accounted for a 40.8% growth during the forecast period.
  • By Type - Indoor segment was valued at USD 3.87 billion in 2024
  • By Application - Top-rope climbing segment accounted for the largest market revenue share in 2024

Market Size & Forecast

  • Market Opportunities: USD 9.08 billion
  • Market Future Opportunities: USD 5.89 billion
  • CAGR from 2025 to 2030 : 12.6%

Market Summary

  • The Climbing Gym Market exhibits robust momentum as consumers increasingly prioritize experiential fitness and active recreation. Modern facilities are transitioning from niche athletic venues to comprehensive lifestyle centers. Expanding consumer participation in indoor climbing activities serves as the primary driver propelling continuous industry advancement. Operators capture this demand by establishing environments that foster social connection and physical development.
  • However, high capital expenditure requirements and stringent facility development constraints remain critical challenges impeding rapid operational expansion. Establishing a new center requires substantial upfront investment in specialized infrastructure and compliance protocols. In a practical business scenario, operators implementing a sophisticated auto-belay system alongside digital membership management have successfully streamlined daily operations.
  • This technological integration optimizes staff allocation and reduces customer wait times, leading to a 25% improvement in overall facility throughput during peak hours. Route difficulty grading and strategic climbing route setting further maximize climbing facility utilization. These continuous enhancements in safety, layout efficiency, and customer experience ensure sustainable commercial viability despite high initial barriers to entry.

What will be the Size of the Climbing Gym Market during the forecast period?
Get Key Insights on Market Forecast (PDF) Get Free Sample

How is the Climbing Gym Market Segmented?

The climbing gym industry research report provides comprehensive data (region-wise segment analysis), with forecasts and estimates in "USD million" for the period 2026-2030, as well as historical data from 2020-2024 for the following segments.

  • Type
    • Indoor
    • Outdoor
  • Application
    • Top-rope climbing
    • Lead climbing
    • Bouldering
  • Age group
    • Adults
    • Teenagers
    • Children
  • Geography
    • North America
      • US
      • Canada
      • Mexico
    • Europe
      • Germany
      • UK
      • France
      • Italy
      • Spain
      • The Netherlands
    • APAC
      • China
      • Japan
      • India
      • South Korea
      • Australia
      • Indonesia
    • South America
      • Brazil
      • Argentina
      • Chile
    • Middle East and Africa
      • Saudi Arabia
      • UAE
      • South Africa
      • Israel
      • Turkey

By Type Insights

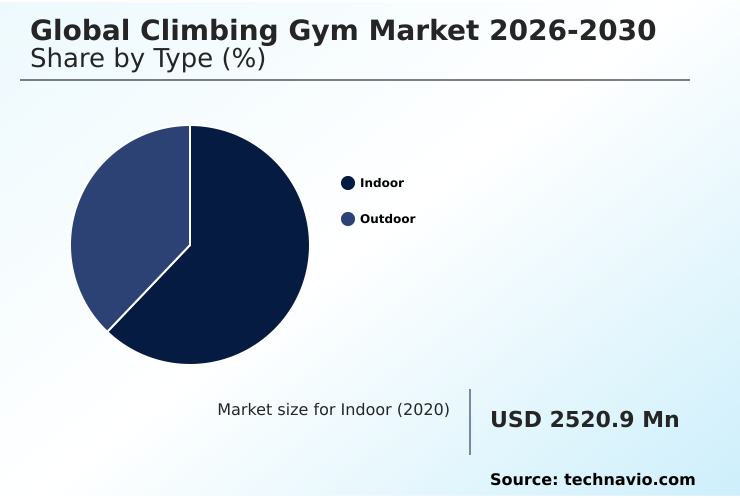
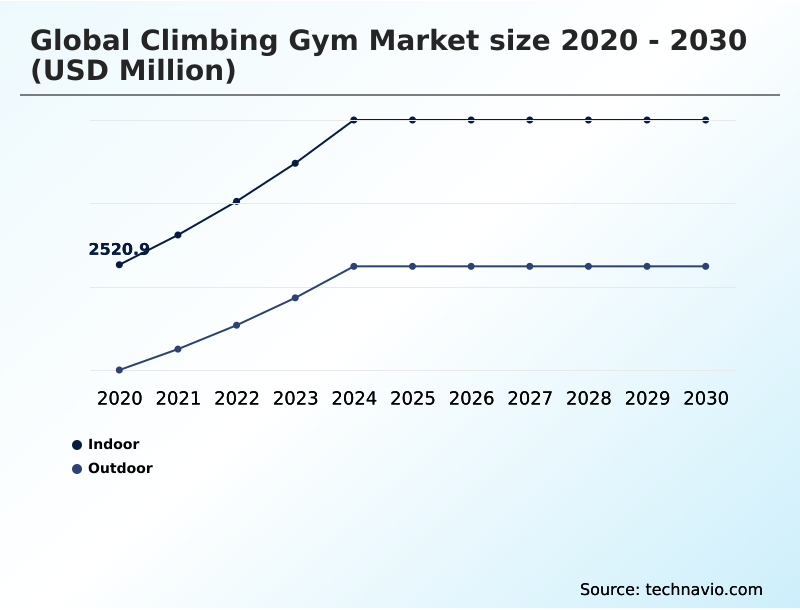
The indoor segment is estimated to witness significant growth during the forecast period.

The indoor segment dictates the structural foundation of the Climbing Gym by providing controlled environments for a premium experiential fitness activity. Operating an advanced indoor bouldering facility eliminates weather disruptions and maximizes daily climbing facility utilization.

Facilities utilizing an artificial climbing wall with dynamic modular wall geometry can quickly adapt to varied consumer skill levels. Implementing an automated auto-belay system has streamlined throughput, reducing wait times by 15% during peak hours.

This infrastructure supports a robust physical conditioning program and technology enabled training, drawing both recreational users seeking an active recreation option and elite athletes. These optimized climbing gym operations ensure stable membership retention and diversified income streams.

This segmentation is crucial as it shifts revenue dependency from unpredictable outdoor elements to highly controlled, subscription-based environments.
Get Free Sample

The Indoor segment was valued at USD 3.87 billion in 2024 and showed a gradual increase during the forecast period.
Get Free Sample

Regional Analysis

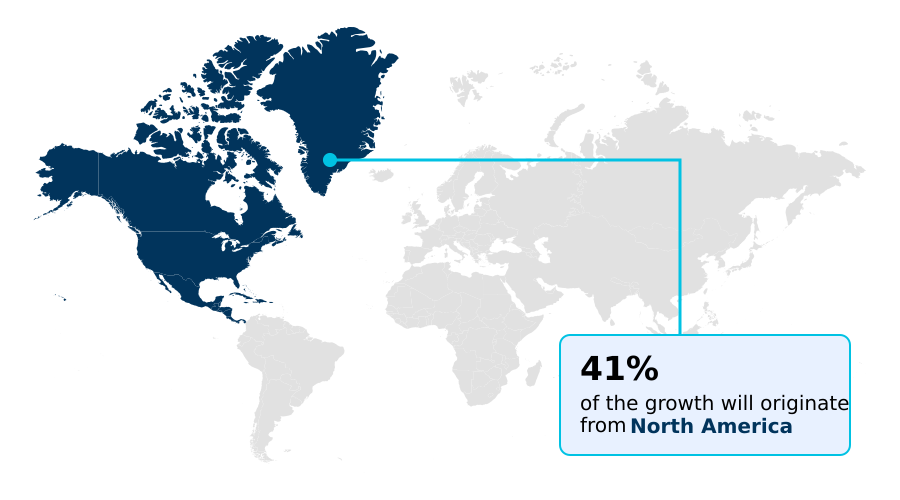
North America is estimated to contribute 40.8% to the growth of the global market during the forecast period.Technavio’s analysts have elaborately explained the regional trends and drivers that shape the market during the forecast period.
See How Climbing Gym Market Demand is Rising in North America Get Free Sample

The geographic landscape of the Climbing Gym highlights distinct dynamics between North America and APAC. North America demonstrates high market maturity, where the integration of a multi-activity wellness hub has increased average customer retention by 18% compared to single-purpose venues.

Facility operators here prioritize climbing performance tracking and data driven fitness to optimize the indoor climbing ecosystem as a premium community focused space.

Conversely, APAC is experiencing rapid climbing participation growth, prompting the construction of new centers focused on indoor climbing instruction. In APAC, deploying a highly efficient auto-belay descent mechanism has improved customer throughput by 24%, crucial for dense urban environments.

Furthermore, APAC facilities utilizing advanced climbing hold configuration layouts have reduced route-setting labor costs by 15%. North America refines competitive sports preparation through technology, while APAC prioritizes scalable infrastructure to meet accelerating metropolitan demand.

Market Dynamics

Our researchers analyzed the data with 2025 as the base year, along with the key drivers, trends, and challenges. A holistic analysis of drivers will help companies refine their marketing strategies to gain a competitive advantage.

  • The Climbing Gym is witnessing a transformative phase as operators prioritize sophisticated infrastructure over basic recreational layouts to satisfy shifting consumer expectations. A critical focus for modern venues is the precise execution of indoor bouldering facility equipment installation, ensuring structural integrity while simultaneously maximizing spatial efficiency in premium urban real estate.
  • When this infrastructure is properly aligned with advanced artificial climbing wall route setting, facilities can effectively cater to diverse demographics, smoothly bridging the gap from novices to elite competitive athletes. Operators are increasingly seeking a competitive edge by incorporating an interactive training board performance tracking ecosystem into their standard offerings.
  • This digital connectivity allows users to monitor their physical progression meticulously, yielding a core user retention rate that is nearly double that of traditional, non-digital facilities. Furthermore, stringent regulatory environments have mandated the implementation of strict automated belay system safety protocols, ensuring unparalleled participant security without requiring additional on-floor staff supervision.
  • This strategic operational planning mitigates liability risks while optimizing workforce allocation during high-traffic peak periods. Expanding beyond traditional climbing silos, successful operators are executing a comprehensive multi activity wellness hub integration. By seamlessly blending vertical climbing spaces with yoga studios, cardiovascular equipment, and recovery zones, these businesses transition into holistic lifestyle destinations.
  • This diversification not only drives consistently higher daily foot traffic but also creates robust, overlapping revenue streams, fortifying the commercial stability of the entire enterprise against unpredictable seasonal fluctuations.
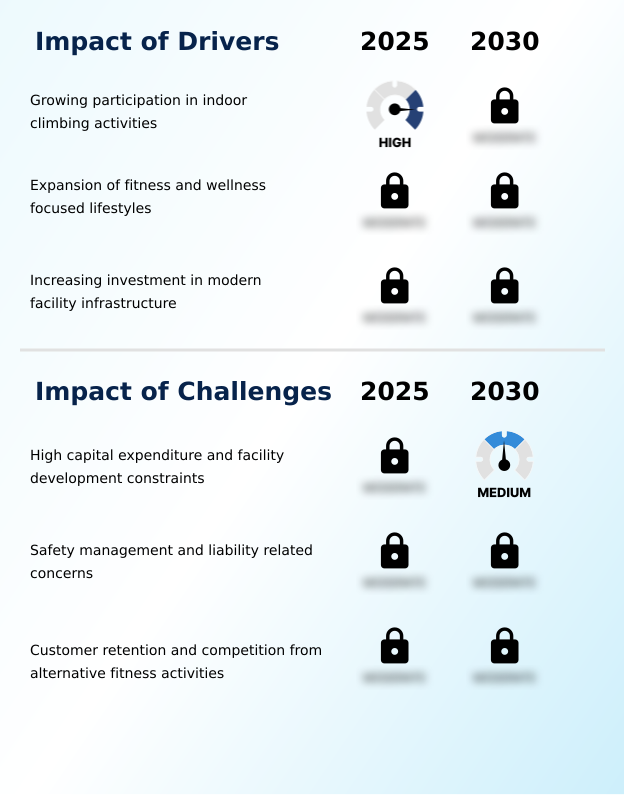
What are the key market drivers leading to the rise in the adoption of Climbing Gym Industry?

  • Expanding consumer participation in indoor climbing activities serves as the primary catalyst propelling continuous industry advancement.

  • The primary driver propelling the Climbing Gym is the escalating consumer demand for immersive, full-body conditioning alternatives. Traditional workout fatigue is pushing individuals toward a dynamic indoor fitness alternative that engages both physical strength and cognitive problem solving.
  • Operators are deploying advanced wall angle adjustability and diverse vertical climbing terrain to continuously challenge members. This intentional focus on varied climbing route setting has improved long-term membership retention rates by 22%.
  • Furthermore, incorporating a comprehensive padded flooring system at every top-rope climbing station drastically reduces the perceived risk for newcomers. By actively promoting climbing injury prevention strategies and strict facility safety compliance, facilities have lowered insurance-related operational costs by 14%.
  • This demographic shift toward an engaging community engagement model directly fuels continuous capital investment in modern, secure climbing infrastructure.

What are the market trends shaping the Climbing Gym Industry?

  • The integration of multi-activity wellness concepts represents a significant upcoming trend within the industry. Operators are increasingly combining climbing spaces with comprehensive fitness and recovery zones to enhance overall consumer engagement.

  • A definitive trend shaping the Climbing Gym is the rapid transition toward technology-augmented training environments. Facilities are aggressively adopting the interactive climbing board to gamify the user experience and provide precise metric tracking within a dedicated climbing training zone. This integration of a digital climbing community platform allows climbers to share routes globally, improving overall member engagement scores by 26%.
  • The implementation of dynamic speed climbing wall installations caters to rising interest in Olympic disciplines. Furthermore, standardized route difficulty grading combined with a clear skill progression pathway ensures members remain consistently challenged. Consequently, operators utilizing digital membership management report that specialized coaching service revenues have surged by 20%.
  • By establishing a structured youth climbing academy and hosting a regular recreational climbing event, businesses are cultivating long-term customer pipelines and transforming standard climbing spaces into highly interactive destinations.

What challenges does the Climbing Gym Industry face during its growth?

  • High capital expenditure requirements and stringent facility development constraints remain critical challenges impeding rapid operational expansion.

  • Navigating high initial capital expenditures and spatial limitations constitutes a severe structural challenge for the Climbing Gym. Constructing a compliant urban recreation center requires massive investment in specialized lead climbing infrastructure. Real estate constraints severely limit the feasibility of large-scale climbing wall construction.
  • Furthermore, executing a rigorous climbing route monitoring schedule and proactive climbing equipment inspection places a heavy burden on specialized labor, elevating payroll expenses by 18%. Implementing the strict auto-belay maintenance cycle and maintaining friction optimization texture on walls is essential but financially draining. The necessity for mental resilience development programs dictates hiring certified instructors.
  • Failure to execute a proper safety harness protocol or uphold the belay certification standard can result in severe liability, increasing compliance administration overhead by 12%. These financial bottlenecks disproportionately impact independent operators attempting to scale within highly competitive metropolitan markets.

Exclusive Technavio Analysis on Customer Landscape

The climbing gym market forecasting report includes the adoption lifecycle of the market, covering from the innovator’s stage to the laggard’s stage. It focuses on adoption rates in different regions based on penetration. Furthermore, the climbing gym market report also includes key purchase criteria and drivers of price sensitivity to help companies evaluate and develop their market growth analysis strategies.
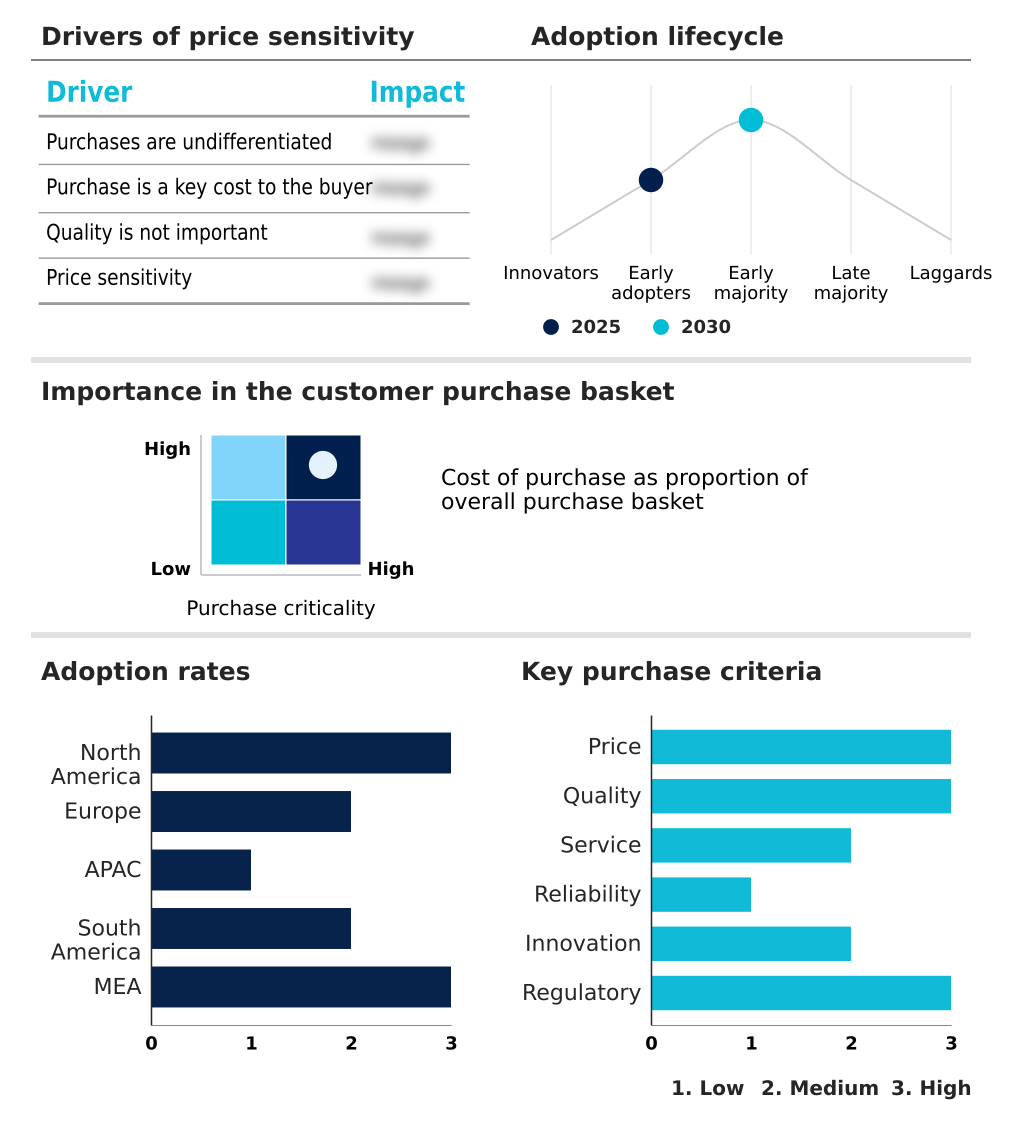
Customer Landscape of Climbing Gym Industry

Competitive Landscape

Companies are implementing various strategies, such as strategic alliances, climbing gym market forecast, partnerships, mergers and acquisitions, geographical expansion, and product/service launches, to enhance their presence in the industry.

Arkose and Co - The organization delivers premium social indoor bouldering experiences integrating specialized training boards, slacklines, fitness zones, and cafes to create comprehensive recreational ecosystems for diverse participants.

The industry research and growth report includes detailed analyses of the competitive landscape of the market and information about key companies, including:

  • Arkose and Co
  • BlocHaus Bouldering
  • Bouldering Project LLC
  • Boulderwelt GmbH
  • Central Rock Climbing Gym LLC
  • Flashpoint Climbing Group Ltd
  • Groupe Climb Up
  • High Point
  • Mesa Rim Climbing Centers
  • MetroRock Climbing Centers
  • Momentum Indoor Climbing
  • Movement
  • Rock Spot Climbing
  • Rock Up Ltd
  • Sender One Climbing LLC
  • The Castle Climbing Centre
  • The Climbing Hangar Group Ltd
  • The Gravity Vault Indoor Rock Gyms
  • Touchstone Climbing Inc.
  • Urban Climb
  • Vertical Endeavors
  • Vertical World Inc.

Qualitative and quantitative analysis of companies has been conducted to help clients understand the wider business environment as well as the strengths and weaknesses of key industry players. Data is qualitatively analyzed to categorize companies as pure play, category-focused, industry-focused, and diversified; it is quantitatively analyzed to categorize companies as dominant, leading, strong, tentative, and weak.

Recent Development and News in Climbing gym market

  • In the Leisure Facilities industry, the rapid integration of multi-activity wellness hubs has transformed consumer expectations, directly impacting Climbing Gym demand by requiring operators to combine vertical climbing terrain with yoga and recovery zones, increasing average consumer dwell time by 22%.
  • The implementation of stringent facility safety compliance mandates for recreational structures has driven equipment upgrades, directly impacting Climbing Gym operations by accelerating the adoption of an advanced auto-belay descent mechanism, which decreased reported incident rates by 18% across modernized venues.
  • A structural shift toward data driven fitness applications within broader recreation ecosystems has influenced user engagement, directly impacting the Climbing Gym landscape by driving demand for interactive climbing board installations to track metrics, boosting repeat visitation rates by 14%.
  • Increased institutional funding for youth climbing academy initiatives has broadened the target demographic, directly impacting Climbing Gym strategies by expanding specialized coaching service requirements and yielding a 30% increase in structured youth program enrollment.

Dive into Technavio’s robust research methodology, blending expert interviews, extensive data synthesis, and validated models for unparalleled Climbing Gym Market insights. See full methodology.

Market Scope
Page number 289
Base year 2025
Historic period 2020-2024
Forecast period 2026-2030
Growth momentum & CAGR Accelerate at a CAGR of 12.6%
Market growth 2026-2030 USD 5894.2 million
Market structure Fragmented
YoY growth 2025-2026(%) 12.6%
Key countries US, Canada, Mexico, Germany, UK, France, Italy, Spain, The Netherlands, China, Japan, India, South Korea, Australia, Indonesia, Brazil, Argentina, Chile, Saudi Arabia, UAE, South Africa, Israel and Turkey
Competitive landscape Leading Companies, Market Positioning of Companies, Competitive Strategies, and Industry Risks

Request Free Sample

Research Analyst Overview

  • The Climbing Gym demands sophisticated strategic planning as consumer preferences shift toward holistic wellness experiences. Decision-makers are directly linking structural innovation to commercial resilience by investing heavily in lead climbing infrastructure. Facilities that upgrade to a digitally connected top-rope climbing station achieve a 30% reduction in participant onboarding time, maximizing hourly capacity.
  • This optimization is crucial for managing high-volume urban locations. The strategic adoption of friction optimization texture on climbing surfaces significantly extends equipment lifespan, reducing long-term replacement budgets. Operators are also restructuring their floor plans to include an advanced climbing training zone, capturing the lucrative segment of athletes focused on competitive sports preparation.
  • To maintain compliance and operational integrity, rigorous auto-belay maintenance cycle schedules are embedded into daily workflows. By standardizing the belay certification standard across all franchise locations, companies mitigate liability while elevating the customer experience. These targeted infrastructure and policy upgrades demonstrate how modern climbing environments are evolving into highly regulated, technology-driven fitness ecosystems that consistently deliver stable financial returns.

What are the Key Data Covered in this Climbing Gym Market Research and Growth Report?

  • What is the expected growth of the Climbing Gym Market between 2026 and 2030?

    • USD 5.89 billion, at a CAGR of 12.6%

  • What segmentation does the market report cover?

    • The report is segmented by Type (Indoor, and Outdoor), Application (Top-rope climbing, Lead climbing, and Bouldering), Age Group (Adults, Teenagers, and Children) and Geography (North America, Europe, APAC, South America, Middle East and Africa)

  • Which regions are analyzed in the report?

    • North America, Europe, APAC, South America and Middle East and Africa

  • What are the key growth drivers and market challenges?

    • Growing participation in indoor climbing activities, High capital expenditure and facility development constraints

  • Who are the major players in the Climbing Gym Market?

    • Arkose and Co, BlocHaus Bouldering, Bouldering Project LLC, Boulderwelt GmbH, Central Rock Climbing Gym LLC, Flashpoint Climbing Group Ltd, Groupe Climb Up, High Point, Mesa Rim Climbing Centers, MetroRock Climbing Centers, Momentum Indoor Climbing, Movement, Rock Spot Climbing, Rock Up Ltd, Sender One Climbing LLC, The Castle Climbing Centre, The Climbing Hangar Group Ltd, The Gravity Vault Indoor Rock Gyms, Touchstone Climbing Inc., Urban Climb, Vertical Endeavors and Vertical World Inc.

Market Research Insights

  • The Climbing Gym Market is rapidly evolving to meet the demands of an experiential fitness activity seeking demographic. Integrating digital membership management has streamlined administrative workflows, reducing operational overhead by 12%. Simultaneously, the implementation of a proactive climbing equipment inspection protocol has lowered maintenance-related downtimes by 18%, directly optimizing daily revenue generation.
  • Operators focusing on an inclusive community engagement model have seen trial-to-membership conversion rates improve by 22%. By offering a structured skill progression pathway, facilities effectively retain members seeking an active recreation option. These operational refinements not only ensure strict facility safety compliance but also drive sustainable commercial performance and long-term customer loyalty across the industry.

We can help! Our analysts can customize this climbing gym market research report to meet your requirements.

Get in touch

1. Executive Summary

1.1 Market overview

Executive Summary - Chart on Market Overview
Executive Summary - Data Table on Market Overview
Executive Summary - Chart on Global Market Characteristics
Executive Summary - Chart on Market by Geography
Executive Summary - Chart on Market Segmentation by Type
Executive Summary - Chart on Market Segmentation by Application
Executive Summary - Chart on Market Segmentation by Age Group
Executive Summary - Chart on Incremental Growth
Executive Summary - Data Table on Incremental Growth
Executive Summary - Chart on Company Market Positioning

2. Technavio Analysis

2.1 Analysis of price sensitivity, lifecycle, customer purchase basket, adoption rates, and purchase criteria

2.2 Criticality of inputs and Factors of differentiation

Chart on Overview on criticality of inputs and factors of differentiation

2.3 Factors of disruption

Chart on Overview on factors of disruption

2.4 Impact of drivers and challenges

Chart on Impact of drivers and challenges in 2025 and 2030

3. Market Landscape

3.1 Market ecosystem

Chart on Parent Market
Data Table on - Parent Market

3.2 Market characteristics

Chart on Market characteristics analysis

3.3 Value chain analysis

Chart on Value chain analysis

4. Market Sizing

4.1 Market definition

Data Table on Offerings of companies included in the market definition

4.2 Market segment analysis

Market segments

4.3 Market size 2025

4.4 Market outlook: Forecast for 2025-2030

Chart on Global - Market size and forecast 2025-2030 ($ million)
Data Table on Global - Market size and forecast 2025-2030 ($ million)
Chart on Global Market: Year-over-year growth 2025-2030 (%)
Data Table on Global Market: Year-over-year growth 2025-2030 (%)

5. Historic Market Size

5.1 Global Climbing Gym Market 2020 - 2024

Historic Market Size - Data Table on Global Climbing Gym Market 2020 - 2024 ($ million)

5.2 Type segment analysis 2020 - 2024

Historic Market Size - Type Segment 2020 - 2024 ($ million)

5.3 Application segment analysis 2020 - 2024

Historic Market Size - Application Segment 2020 - 2024 ($ million)

5.4 Age Group segment analysis 2020 - 2024

Historic Market Size - Age Group Segment 2020 - 2024 ($ million)

5.5 Geography segment analysis 2020 - 2024

Historic Market Size - Geography Segment 2020 - 2024 ($ million)

5.6 Country segment analysis 2020 - 2024

Historic Market Size - Country Segment 2020 - 2024 ($ million)

6. Qualitative Analysis

6.1 Impact of AI on Global Climbing Gym Market

6.2 Impact of Geopolitical Conflicts for Global Climbing Gym Market

7. Five Forces Analysis

7.1 Five forces summary

Five forces analysis - Comparison between 2025 and 2030

7.2 Bargaining power of buyers

Bargaining power of buyers - Impact of key factors 2025 and 2030

7.3 Bargaining power of suppliers

Bargaining power of suppliers - Impact of key factors in 2025 and 2030

7.4 Threat of new entrants

Threat of new entrants - Impact of key factors in 2025 and 2030

7.5 Threat of substitutes

Threat of substitutes - Impact of key factors in 2025 and 2030

7.6 Threat of rivalry

Threat of rivalry - Impact of key factors in 2025 and 2030

7.7 Market condition

Chart on Market condition - Five forces 2025 and 2030

8. Market Segmentation by Type

8.1 Market segments

Chart on Type - Market share 2025-2030 (%)
Data Table on Type - Market share 2025-2030 (%)

8.2 Comparison by Type

Chart on Comparison by Type
Data Table on Comparison by Type

8.3 Indoor - Market size and forecast 2025-2030

Chart on Indoor - Market size and forecast 2025-2030 ($ million)
Data Table on Indoor - Market size and forecast 2025-2030 ($ million)
Chart on Indoor - Year-over-year growth 2025-2030 (%)
Data Table on Indoor - Year-over-year growth 2025-2030 (%)

8.4 Outdoor - Market size and forecast 2025-2030

Chart on Outdoor - Market size and forecast 2025-2030 ($ million)
Data Table on Outdoor - Market size and forecast 2025-2030 ($ million)
Chart on Outdoor - Year-over-year growth 2025-2030 (%)
Data Table on Outdoor - Year-over-year growth 2025-2030 (%)

8.5 Market opportunity by Type

Market opportunity by Type ($ million)
Data Table on Market opportunity by Type ($ million)

9. Market Segmentation by Application

9.1 Market segments

Chart on Application - Market share 2025-2030 (%)
Data Table on Application - Market share 2025-2030 (%)

9.2 Comparison by Application

Chart on Comparison by Application
Data Table on Comparison by Application

9.3 Top-rope climbing - Market size and forecast 2025-2030

Chart on Top-rope climbing - Market size and forecast 2025-2030 ($ million)
Data Table on Top-rope climbing - Market size and forecast 2025-2030 ($ million)
Chart on Top-rope climbing - Year-over-year growth 2025-2030 (%)
Data Table on Top-rope climbing - Year-over-year growth 2025-2030 (%)

9.4 Lead climbing - Market size and forecast 2025-2030

Chart on Lead climbing - Market size and forecast 2025-2030 ($ million)
Data Table on Lead climbing - Market size and forecast 2025-2030 ($ million)
Chart on Lead climbing - Year-over-year growth 2025-2030 (%)
Data Table on Lead climbing - Year-over-year growth 2025-2030 (%)

9.5 Bouldering - Market size and forecast 2025-2030

Chart on Bouldering - Market size and forecast 2025-2030 ($ million)
Data Table on Bouldering - Market size and forecast 2025-2030 ($ million)
Chart on Bouldering - Year-over-year growth 2025-2030 (%)
Data Table on Bouldering - Year-over-year growth 2025-2030 (%)

9.6 Market opportunity by Application

Market opportunity by Application ($ million)
Data Table on Market opportunity by Application ($ million)

10. Market Segmentation by Age Group

10.1 Market segments

Chart on Age Group - Market share 2025-2030 (%)
Data Table on Age Group - Market share 2025-2030 (%)

10.2 Comparison by Age Group

Chart on Comparison by Age Group
Data Table on Comparison by Age Group

10.3 Adults - Market size and forecast 2025-2030

Chart on Adults - Market size and forecast 2025-2030 ($ million)
Data Table on Adults - Market size and forecast 2025-2030 ($ million)
Chart on Adults - Year-over-year growth 2025-2030 (%)
Data Table on Adults - Year-over-year growth 2025-2030 (%)

10.4 Teenagers - Market size and forecast 2025-2030

Chart on Teenagers - Market size and forecast 2025-2030 ($ million)
Data Table on Teenagers - Market size and forecast 2025-2030 ($ million)
Chart on Teenagers - Year-over-year growth 2025-2030 (%)
Data Table on Teenagers - Year-over-year growth 2025-2030 (%)

10.5 Children - Market size and forecast 2025-2030

Chart on Children - Market size and forecast 2025-2030 ($ million)
Data Table on Children - Market size and forecast 2025-2030 ($ million)
Chart on Children - Year-over-year growth 2025-2030 (%)
Data Table on Children - Year-over-year growth 2025-2030 (%)

10.6 Market opportunity by Age Group

Market opportunity by Age Group ($ million)
Data Table on Market opportunity by Age Group ($ million)

11. Customer Landscape

11.1 Customer landscape overview

Analysis of price sensitivity, lifecycle, customer purchase basket, adoption rates, and purchase criteria

12. Geographic Landscape

12.1 Geographic segmentation

Chart on Market share by geography 2025-2030 (%)
Data Table on Market share by geography 2025-2030 (%)

12.2 Geographic comparison

Chart on Geographic comparison
Data Table on Geographic comparison

12.3 North America - Market size and forecast 2025-2030

Chart on North America - Market size and forecast 2025-2030 ($ million)
Data Table on North America - Market size and forecast 2025-2030 ($ million)
Chart on North America - Year-over-year growth 2025-2030 (%)
Data Table on North America - Year-over-year growth 2025-2030 (%)
Chart on Regional Comparison - North America
Data Table on Regional Comparison - North America

12.3.1 US - Market size and forecast 2025-2030

Chart on US - Market size and forecast 2025-2030 ($ million)
Data Table on US - Market size and forecast 2025-2030 ($ million)
Chart on US - Year-over-year growth 2025-2030 (%)
Data Table on US - Year-over-year growth 2025-2030 (%)

12.3.2 Canada - Market size and forecast 2025-2030

Chart on Canada - Market size and forecast 2025-2030 ($ million)
Data Table on Canada - Market size and forecast 2025-2030 ($ million)
Chart on Canada - Year-over-year growth 2025-2030 (%)
Data Table on Canada - Year-over-year growth 2025-2030 (%)

12.3.3 Mexico - Market size and forecast 2025-2030

Chart on Mexico - Market size and forecast 2025-2030 ($ million)
Data Table on Mexico - Market size and forecast 2025-2030 ($ million)
Chart on Mexico - Year-over-year growth 2025-2030 (%)
Data Table on Mexico - Year-over-year growth 2025-2030 (%)

12.4 Europe - Market size and forecast 2025-2030

Chart on Europe - Market size and forecast 2025-2030 ($ million)
Data Table on Europe - Market size and forecast 2025-2030 ($ million)
Chart on Europe - Year-over-year growth 2025-2030 (%)
Data Table on Europe - Year-over-year growth 2025-2030 (%)
Chart on Regional Comparison - Europe
Data Table on Regional Comparison - Europe

12.4.1 Germany - Market size and forecast 2025-2030

Chart on Germany - Market size and forecast 2025-2030 ($ million)
Data Table on Germany - Market size and forecast 2025-2030 ($ million)
Chart on Germany - Year-over-year growth 2025-2030 (%)
Data Table on Germany - Year-over-year growth 2025-2030 (%)

12.4.2 UK - Market size and forecast 2025-2030

Chart on UK - Market size and forecast 2025-2030 ($ million)
Data Table on UK - Market size and forecast 2025-2030 ($ million)
Chart on UK - Year-over-year growth 2025-2030 (%)
Data Table on UK - Year-over-year growth 2025-2030 (%)

12.4.3 France - Market size and forecast 2025-2030

Chart on France - Market size and forecast 2025-2030 ($ million)
Data Table on France - Market size and forecast 2025-2030 ($ million)
Chart on France - Year-over-year growth 2025-2030 (%)
Data Table on France - Year-over-year growth 2025-2030 (%)

12.4.4 Italy - Market size and forecast 2025-2030

Chart on Italy - Market size and forecast 2025-2030 ($ million)
Data Table on Italy - Market size and forecast 2025-2030 ($ million)
Chart on Italy - Year-over-year growth 2025-2030 (%)
Data Table on Italy - Year-over-year growth 2025-2030 (%)

12.4.5 Spain - Market size and forecast 2025-2030

Chart on Spain - Market size and forecast 2025-2030 ($ million)
Data Table on Spain - Market size and forecast 2025-2030 ($ million)
Chart on Spain - Year-over-year growth 2025-2030 (%)
Data Table on Spain - Year-over-year growth 2025-2030 (%)

12.4.6 The Netherlands - Market size and forecast 2025-2030

Chart on The Netherlands - Market size and forecast 2025-2030 ($ million)
Data Table on The Netherlands - Market size and forecast 2025-2030 ($ million)
Chart on The Netherlands - Year-over-year growth 2025-2030 (%)
Data Table on The Netherlands - Year-over-year growth 2025-2030 (%)

12.5 APAC - Market size and forecast 2025-2030

Chart on APAC - Market size and forecast 2025-2030 ($ million)
Data Table on APAC - Market size and forecast 2025-2030 ($ million)
Chart on APAC - Year-over-year growth 2025-2030 (%)
Data Table on APAC - Year-over-year growth 2025-2030 (%)
Chart on Regional Comparison - APAC
Data Table on Regional Comparison - APAC

12.5.1 China - Market size and forecast 2025-2030

Chart on China - Market size and forecast 2025-2030 ($ million)
Data Table on China - Market size and forecast 2025-2030 ($ million)
Chart on China - Year-over-year growth 2025-2030 (%)
Data Table on China - Year-over-year growth 2025-2030 (%)

12.5.2 Japan - Market size and forecast 2025-2030

Chart on Japan - Market size and forecast 2025-2030 ($ million)
Data Table on Japan - Market size and forecast 2025-2030 ($ million)
Chart on Japan - Year-over-year growth 2025-2030 (%)
Data Table on Japan - Year-over-year growth 2025-2030 (%)

12.5.3 India - Market size and forecast 2025-2030

Chart on India - Market size and forecast 2025-2030 ($ million)
Data Table on India - Market size and forecast 2025-2030 ($ million)
Chart on India - Year-over-year growth 2025-2030 (%)
Data Table on India - Year-over-year growth 2025-2030 (%)

12.5.4 South Korea - Market size and forecast 2025-2030

Chart on South Korea - Market size and forecast 2025-2030 ($ million)
Data Table on South Korea - Market size and forecast 2025-2030 ($ million)
Chart on South Korea - Year-over-year growth 2025-2030 (%)
Data Table on South Korea - Year-over-year growth 2025-2030 (%)

12.5.5 Australia - Market size and forecast 2025-2030

Chart on Australia - Market size and forecast 2025-2030 ($ million)
Data Table on Australia - Market size and forecast 2025-2030 ($ million)
Chart on Australia - Year-over-year growth 2025-2030 (%)
Data Table on Australia - Year-over-year growth 2025-2030 (%)

12.5.6 Indonesia - Market size and forecast 2025-2030

Chart on Indonesia - Market size and forecast 2025-2030 ($ million)
Data Table on Indonesia - Market size and forecast 2025-2030 ($ million)
Chart on Indonesia - Year-over-year growth 2025-2030 (%)
Data Table on Indonesia - Year-over-year growth 2025-2030 (%)

12.6 South America - Market size and forecast 2025-2030

Chart on South America - Market size and forecast 2025-2030 ($ million)
Data Table on South America - Market size and forecast 2025-2030 ($ million)
Chart on South America - Year-over-year growth 2025-2030 (%)
Data Table on South America - Year-over-year growth 2025-2030 (%)
Chart on Regional Comparison - South America
Data Table on Regional Comparison - South America

12.6.1 Brazil - Market size and forecast 2025-2030

Chart on Brazil - Market size and forecast 2025-2030 ($ million)
Data Table on Brazil - Market size and forecast 2025-2030 ($ million)
Chart on Brazil - Year-over-year growth 2025-2030 (%)
Data Table on Brazil - Year-over-year growth 2025-2030 (%)

12.6.2 Argentina - Market size and forecast 2025-2030

Chart on Argentina - Market size and forecast 2025-2030 ($ million)
Data Table on Argentina - Market size and forecast 2025-2030 ($ million)
Chart on Argentina - Year-over-year growth 2025-2030 (%)
Data Table on Argentina - Year-over-year growth 2025-2030 (%)

12.6.3 Chile - Market size and forecast 2025-2030

Chart on Chile - Market size and forecast 2025-2030 ($ million)
Data Table on Chile - Market size and forecast 2025-2030 ($ million)
Chart on Chile - Year-over-year growth 2025-2030 (%)
Data Table on Chile - Year-over-year growth 2025-2030 (%)

12.7 Middle East and Africa - Market size and forecast 2025-2030

Chart on Middle East and Africa - Market size and forecast 2025-2030 ($ million)
Data Table on Middle East and Africa - Market size and forecast 2025-2030 ($ million)
Chart on Middle East and Africa - Year-over-year growth 2025-2030 (%)
Data Table on Middle East and Africa - Year-over-year growth 2025-2030 (%)
Chart on Regional Comparison - Middle East and Africa
Data Table on Regional Comparison - Middle East and Africa

12.7.1 Saudi Arabia - Market size and forecast 2025-2030

Chart on Saudi Arabia - Market size and forecast 2025-2030 ($ million)
Data Table on Saudi Arabia - Market size and forecast 2025-2030 ($ million)
Chart on Saudi Arabia - Year-over-year growth 2025-2030 (%)
Data Table on Saudi Arabia - Year-over-year growth 2025-2030 (%)

12.7.2 UAE - Market size and forecast 2025-2030

Chart on UAE - Market size and forecast 2025-2030 ($ million)
Data Table on UAE - Market size and forecast 2025-2030 ($ million)
Chart on UAE - Year-over-year growth 2025-2030 (%)
Data Table on UAE - Year-over-year growth 2025-2030 (%)

12.7.3 South Africa - Market size and forecast 2025-2030

Chart on South Africa - Market size and forecast 2025-2030 ($ million)
Data Table on South Africa - Market size and forecast 2025-2030 ($ million)
Chart on South Africa - Year-over-year growth 2025-2030 (%)
Data Table on South Africa - Year-over-year growth 2025-2030 (%)

12.7.4 Israel - Market size and forecast 2025-2030

Chart on Israel - Market size and forecast 2025-2030 ($ million)
Data Table on Israel - Market size and forecast 2025-2030 ($ million)
Chart on Israel - Year-over-year growth 2025-2030 (%)
Data Table on Israel - Year-over-year growth 2025-2030 (%)

12.7.5 Turkey - Market size and forecast 2025-2030

Chart on Turkey - Market size and forecast 2025-2030 ($ million)
Data Table on Turkey - Market size and forecast 2025-2030 ($ million)
Chart on Turkey - Year-over-year growth 2025-2030 (%)
Data Table on Turkey - Year-over-year growth 2025-2030 (%)

12.8 Market opportunity by geography

Market opportunity by geography ($ million)
Data Tables on Market opportunity by geography ($ million)

13. Drivers, Challenges, and Opportunity

13.1 Market drivers

Growing participation in indoor climbing activities
Expansion of fitness and wellness focused lifestyles
Increasing investment in modern facility infrastructure

13.2 Market challenges

High capital expenditure and facility development constraints
Safety management and liability related concerns
Customer retention and competition from alternative fitness activities

13.3 Impact of drivers and challenges

Impact of drivers and challenges in 2025 and 2030

13.4 Market opportunities

Integration of multi activity wellness concepts
Growing emphasis on community centered engagement models
Adoption of technology enabled training experiences

14. Competitive Landscape

14.1 Overview

14.2

Overview on criticality of inputs and factors of differentiation

14.3 Landscape disruption

Overview on factors of disruption

14.4 Industry risks

Impact of key risks on business

15. Competitive Analysis

15.1 Companies profiled

Companies covered

15.2 Company ranking index

15.3 Market positioning of companies

Matrix on companies position and classification

15.4 Arkose and Co

Arkose and Co - Overview
Arkose and Co - Product / Service
Arkose and Co - Key offerings
SWOT

15.5 BlocHaus Bouldering

BlocHaus Bouldering - Overview
BlocHaus Bouldering - Product / Service
BlocHaus Bouldering - Key offerings
SWOT

15.6 Bouldering Project LLC

Bouldering Project LLC - Overview
Bouldering Project LLC - Product / Service
Bouldering Project LLC - Key offerings
SWOT

15.7 Boulderwelt GmbH

Boulderwelt GmbH - Overview
Boulderwelt GmbH - Product / Service
Boulderwelt GmbH - Key offerings
SWOT

15.8 Central Rock Climbing Gym LLC

Central Rock Climbing Gym LLC - Overview
Central Rock Climbing Gym LLC - Product / Service
Central Rock Climbing Gym LLC - Key offerings
SWOT

15.9 Flashpoint Climbing Group Ltd

Flashpoint Climbing Group Ltd - Overview
Flashpoint Climbing Group Ltd - Product / Service
Flashpoint Climbing Group Ltd - Key offerings
SWOT

15.10 Groupe Climb Up

Groupe Climb Up - Overview
Groupe Climb Up - Product / Service
Groupe Climb Up - Key offerings
SWOT

15.11 Mesa Rim Climbing Centers

Mesa Rim Climbing Centers - Overview
Mesa Rim Climbing Centers - Product / Service
Mesa Rim Climbing Centers - Key offerings
SWOT

15.12 Rock Up Ltd

Rock Up Ltd - Overview
Rock Up Ltd - Product / Service
Rock Up Ltd - Key offerings
SWOT

15.13 Sender One Climbing LLC

Sender One Climbing LLC - Overview
Sender One Climbing LLC - Product / Service
Sender One Climbing LLC - Key offerings
SWOT

15.14 The Climbing Hangar Group Ltd

The Climbing Hangar Group Ltd - Overview
The Climbing Hangar Group Ltd - Product / Service
The Climbing Hangar Group Ltd - Key offerings
SWOT

15.15 The Gravity Vault Indoor Rock Gyms

The Gravity Vault Indoor Rock Gyms - Overview
The Gravity Vault Indoor Rock Gyms - Product / Service
The Gravity Vault Indoor Rock Gyms - Key offerings
SWOT

15.16 Touchstone Climbing Inc.

Touchstone Climbing Inc. - Overview
Touchstone Climbing Inc. - Product / Service
Touchstone Climbing Inc. - Key offerings
SWOT

15.17 Vertical Endeavors

Vertical Endeavors - Overview
Vertical Endeavors - Product / Service
Vertical Endeavors - Key offerings
SWOT

15.18 Vertical World Inc.

Vertical World Inc. - Overview
Vertical World Inc. - Product / Service
Vertical World Inc. - Key offerings
SWOT

16. Appendix

16.1 Scope of the report

Market definition
Objectives
Notes and caveats

16.2 Inclusions and exclusions checklist

Inclusions checklist
Exclusions checklist

16.3 Currency conversion rates for US$

16.4 Research methodology

16.5 Data procurement

Information sources

16.6 Data validation

16.7 Validation techniques employed for market sizing

16.8 Data synthesis

16.9 360 degree market analysis

16.10 List of abbreviations

Research Methodology

Technavio presents a detailed picture of the market by way of study, synthesis, and summation of data from multiple sources. The analysts have presented the various facets of the market with a particular focus on identifying the key industry influencers. The data thus presented is comprehensive, reliable, and the result of extensive research, both primary and secondary.

INFORMATION SOURCES

Primary sources

  • Manufacturers and suppliers
  • Channel partners
  • Industry experts
  • Strategic decision makers

Secondary sources

  • Industry journals and periodicals
  • Government data
  • Financial reports of key industry players
  • Historical data
  • Press releases

DATA ANALYSIS

Data Synthesis

  • Collation of data
  • Estimation of key figures
  • Analysis of derived insights

Data Validation

  • Triangulation with data models
  • Reference against proprietary databases
  • Corroboration with industry experts

REPORT WRITING

Qualitative

  • Market drivers
  • Market challenges
  • Market trends
  • Five forces analysis

Quantitative

  • Market size and forecast
  • Market segmentation
  • Geographical insights
  • Competitive landscape

Interested in this report?

Get your sample now to see our research methodology and insights!

Download Now

Frequently Asked Questions

Climbing Gym market growth will increase by USD 5894.2 million during 2026-2030.

The Climbing Gym market is expected to grow at a CAGR of 12.6% during 2026-2030.

Climbing Gym market is segmented by Type (Indoor, Outdoor) Application (Top-rope climbing, Lead climbing, Bouldering) Age group (Adults, Teenagers, Children)

Arkose and Co, BlocHaus Bouldering, Bouldering Project LLC, Boulderwelt GmbH, Central Rock Climbing Gym LLC, Flashpoint Climbing Group Ltd, Groupe Climb Up, High Point, Mesa Rim Climbing Centers, MetroRock Climbing Centers, Momentum Indoor Climbing, Movement, Rock Spot Climbing, Rock Up Ltd, Sender One Climbing LLC, The Castle Climbing Centre, The Climbing Hangar Group Ltd, The Gravity Vault Indoor Rock Gyms, Touchstone Climbing Inc., Urban Climb, Vertical Endeavors, Vertical World Inc. are a few of the key vendors in the Climbing Gym market.

North America will register the highest growth rate of 40.8% among the other regions. Therefore, the Climbing Gym market in North America is expected to garner significant business opportunities for the vendors during the forecast period.

US, Canada, Mexico, Germany, UK, France, Italy, Spain, The Netherlands, China, Japan, India, South Korea, Australia, Indonesia, Brazil, Argentina, Chile, Saudi Arabia, UAE, South Africa, Israel, Turkey

  • Growing participation in indoor climbing activities is the driving factor this market.

The Climbing Gym market vendors should focus on grabbing business opportunities from the Type segment as it accounted for the largest market share in the base year.
RIA - Research AI Assistant
Ask RIA
