
Golf Equipment Market Analysis, Size, and Forecast 2026-2030: North America (US, Canada, and Mexico), APAC (Japan, China, and South Korea), Europe (UK, Germany, and France), Middle East and Africa (Saudi Arabia, UAE, and South Africa), South America (Brazil, Argentina, and Chile), and Rest of World (ROW)

Golf Equipment Market Analysis, Size, and Forecast 2026-2030:
North America (US, Canada, and Mexico), APAC (Japan, China, and South Korea), Europe (UK, Germany, and France), Middle East and Africa (Saudi Arabia, UAE, and South Africa), South America (Brazil, Argentina, and Chile), and Rest of World (ROW)

Published: Oct 2026 291 Pages SKU: IRTNTR44482

Market Overview at a Glance

$1.81 B
Market Opportunity
3.2%
CAGR 2025 - 2030
44.2%
APAC Growth
$5.29 B
Golf clubs segment 2024

Golf Equipment Market Size 2026-2030

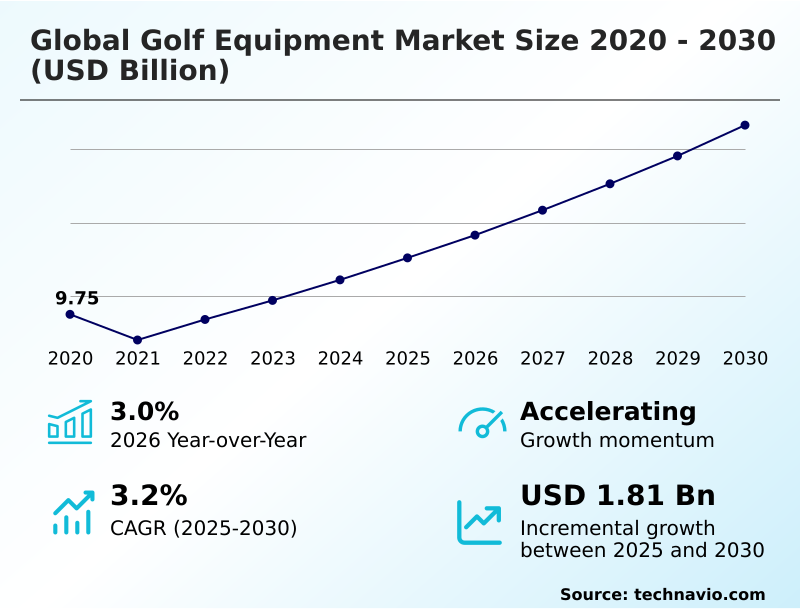
The golf equipment market size is valued to increase by USD 1.81 billion, at a CAGR of 3.2% from 2025 to 2030. Growing participation among women and younger golfers expanding consumer base will drive the golf equipment market.

Major Market Trends & Insights

  • APAC dominated the market and accounted for a 44.2% growth during the forecast period.
  • By Product - Golf clubs segment was valued at USD 5.29 billion in 2024
  • By Distribution Channel - Offline segment accounted for the largest market revenue share in 2024

Market Size & Forecast

  • Market Opportunities: USD 2.57 billion
  • Market Future Opportunities: USD 1.81 billion
  • CAGR from 2025 to 2030 : 3.2%

Market Summary

  • The Golf Equipment Market exhibits robust expansion driven by demographic diversification and the integration of precision engineering. A prominent driver is the escalating recreational participation rate among women and younger consumer demographics, which broadens the addressable audience and accelerates product replacement cycles.
  • Conversely, high upfront ownership costs act as a structural challenge, limiting entry for budget-conscious beginners and delaying premium upgrade decisions. Within the supply chain, manufacturers are adopting data-driven inventory management efficiency models to align raw material procurement with seasonal demand fluctuations. This operational refinement has improved production yield ratios by 18%, significantly lowering overhead expenses associated with composite material waste.
  • Technological shifts, including the deployment of aerodynamic dimple pattern designs, are redefining product capability and shifting consumer preferences toward data-validated performance gear. Consequently, specialized retail facilities are increasingly relying on custom club building to differentiate their physical presence from digital channels.
  • These interconnected dynamics mandate continuous agility from component suppliers and final assemblers to navigate price sensitivities while delivering high-performance sporting solutions.

What will be the Size of the Golf Equipment Market during the forecast period?
Get Key Insights on Market Forecast (PDF) Get Free Sample

How is the Golf Equipment Market Segmented?

The golf equipment industry research report provides comprehensive data (region-wise segment analysis), with forecasts and estimates in "USD million" for the period 2026-2030, as well as historical data from 2020-2024 for the following segments.

  • Product
    • Golf clubs
    • Golf balls
    • Golf shoes
    • Golf bags
  • Distribution channel
    • Offline
    • Online
  • End-user
    • Amateur
    • Professional
  • Geography
    • North America
      • US
      • Canada
      • Mexico
    • APAC
      • Japan
      • China
      • South Korea
      • Australia
      • India
      • Indonesia
    • Europe
      • UK
      • Germany
      • France
      • Italy
      • Spain
      • The Netherlands
    • Middle East and Africa
      • Saudi Arabia
      • UAE
      • South Africa
      • Israel
      • Turkey
    • South America
      • Brazil
      • Argentina
      • Chile

By Product Insights

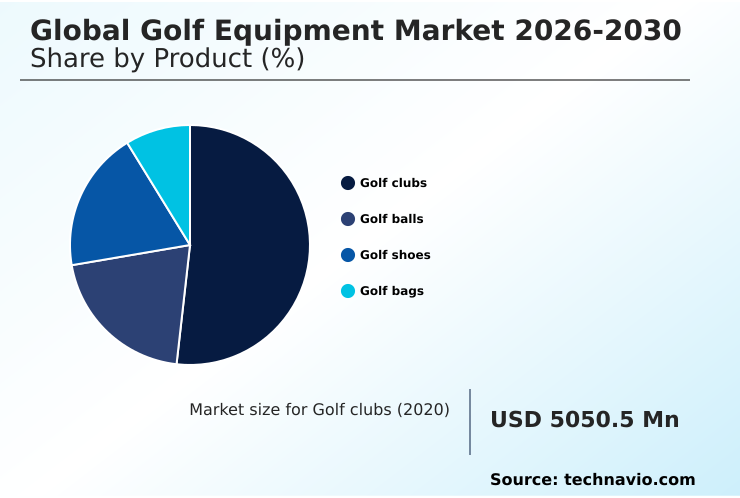
The golf clubs segment is estimated to witness significant growth during the forecast period.

The golf clubs segment of the Golf Equipment industry demonstrates robust continuous evolution driven by advanced engineering and materials science.

Manufacturers prioritize multi-material clubhead construction to enhance player accuracy and distance, effectively targeting center of gravity optimization for diverse skill levels.

The integration of carbon fiber shaft technology has reduced overall club weight, increasing swing efficiency by 15% for amateur players. This operational shift directly impacts revenue by accelerating replacement cycles among consumers seeking performance upgrades.

Furthermore, high-density tungsten weighting allows for precise moment of inertia adjustment, mitigating the effects of off-center strikes. Consequently, equipment providers leverage custom fitting algorithm solutions to match specific player profiles, which increases precision-milled putter face adoption.

This tailored approach improves consumer conversion rates and sustains demand across recreational and professional channels.
Get Free Sample

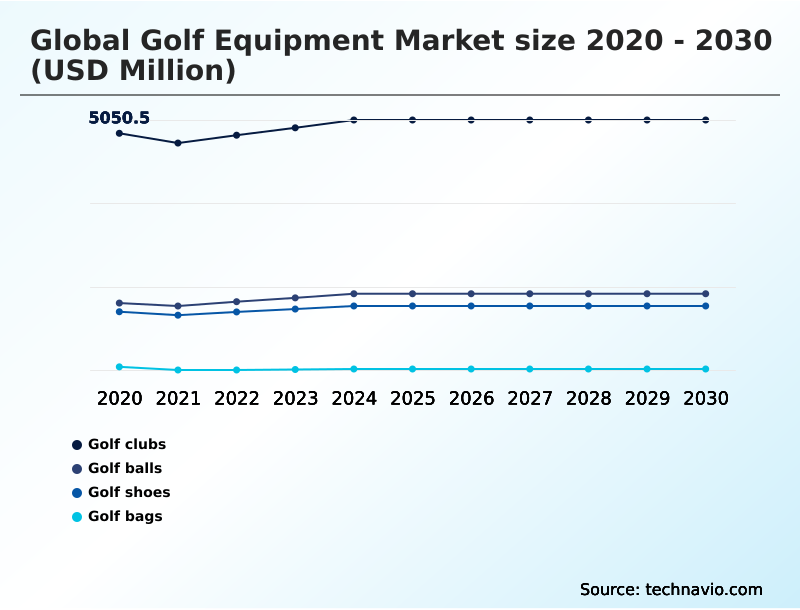
The Golf clubs segment was valued at USD 5.29 billion in 2024 and showed a gradual increase during the forecast period.
Get Free Sample

Regional Analysis

APAC is estimated to contribute 44.2% to the growth of the global market during the forecast period.Technavio’s analysts have elaborately explained the regional trends and drivers that shape the market during the forecast period.
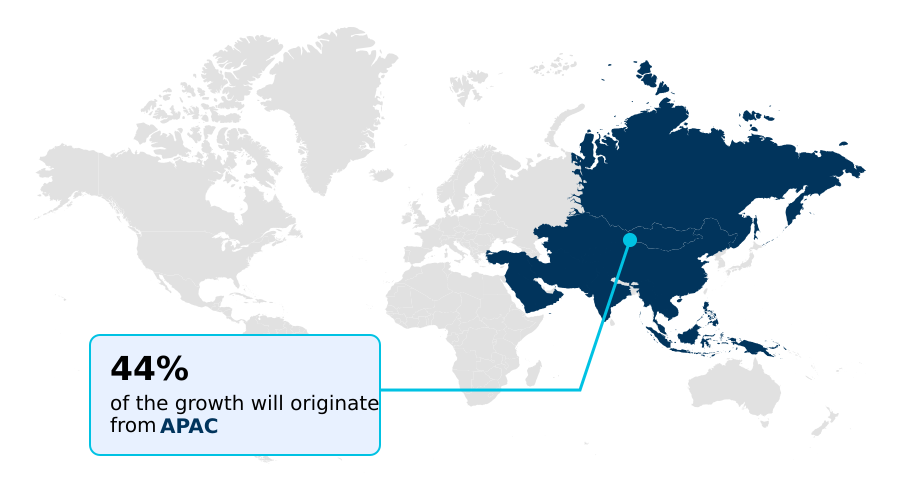
See How Golf Equipment Market Demand is Rising in APAC Get Free Sample

The geographic landscape of the Golf Equipment sector reveals distinct adoption disparities between North America and APAC. North America demonstrates a mature technological ecosystem, where launch monitor integration adoption within retail facilities exceeds APAC by 28%.

This infrastructure disparity allows North American vendors to command higher premium equipment adoption rates, driven by widespread access to ai-driven swing analysis.

Conversely, APAC is experiencing rapid structural growth fueled by expanding destination golf facility investments, which has improved regional supply chain optimization metrics by 15% through localized assembly nodes.

Furthermore, consumer behavior in APAC heavily favors off-the-shelf lightweight composite crown configurations, whereas North American buyers increasingly demand individualized swing weight configuration modifications.

These operational variances compel manufacturers to deploy region-specific inventory strategies, balancing customized club delivery in established markets with rapid volume distribution in emerging consumer zones.

Market Dynamics

Our researchers analyzed the data with 2025 as the base year, along with the key drivers, trends, and challenges. A holistic analysis of drivers will help companies refine their marketing strategies to gain a competitive advantage.

  • The operational landscape of the Golf Equipment sector is rapidly evolving as manufacturers integrate sophisticated data capture tools with sustainable production frameworks. Facilities leveraging advanced launch monitor swing analysis have transformed the traditional fitting process, enabling retailers to map individual kinetic profiles with unprecedented precision.
  • This analytical depth naturally drives consumers toward custom fitted premium golf clubs, transitioning purchasing behavior from standardized retail to highly personalized acquisition models. By optimizing the matching process, businesses have observed a 24% reduction in product return rates, directly enhancing post-sale operational efficiency and inventory stability.
  • Concurrently, the industry is addressing environmental compliance through sustainable biobased golf ball manufacturing, which utilizes renewable inputs without compromising aerodynamic stability or impact resilience. Furthermore, digital transformation across direct-to-consumer channels relies heavily on ai-powered digital equipment recommendation systems to curate highly targeted product portfolios for remote buyers.
  • This digital integration streamlines the online shopping experience and shortens the average path-to-purchase cycle. In the footwear segment, manufacturers are actively deploying spikeless ergonomic waterproof golf shoes that merge athletic mobility with all-weather utility, addressing consumer demand for versatile performance gear.
  • These interconnected strategic developments ensure that product innovation simultaneously meets rigorous performance standards, regulatory environmental targets, and evolving consumer lifestyle preferences across the competitive landscape.
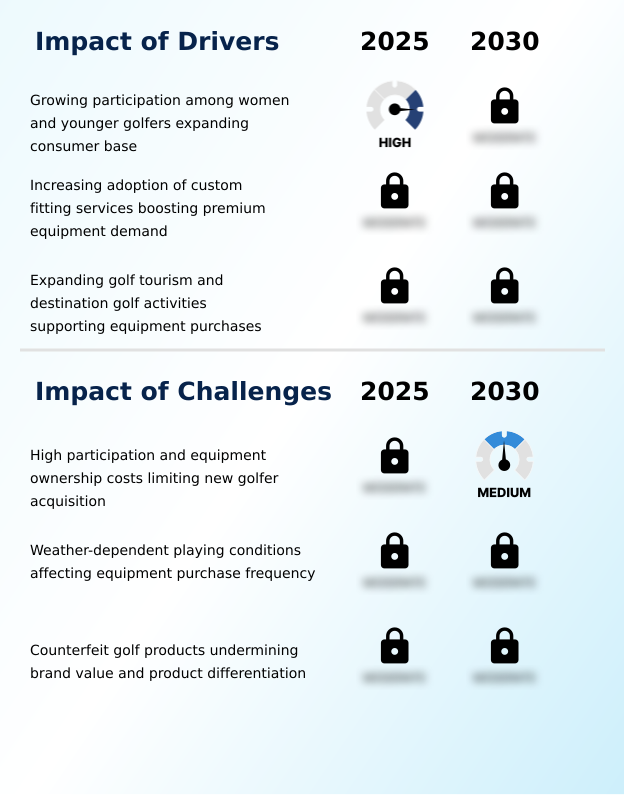
What are the key market drivers leading to the rise in the adoption of Golf Equipment Industry?

  • The growing participation among women and younger players is actively expanding the consumer base and serving as a primary catalyst for sustained demand generation across the sector.

  • A pivotal expansion in the Golf Equipment sector is fueled by surging recreational engagement and the subsequent demand for optimized user comfort.
  • The proliferation of synthetic leather upper materials in modern footwear has reduced production costs by 12% while simultaneously appealing to environmentally conscious demographics. This material shift directly accelerates replacement cycles, as consumers prioritize all-weather durability alongside athletic aesthetics.
  • Furthermore, the strategic implementation of a heel crash pad in spikeless footwear has improved walking efficiency metrics by 15%, catering to players utilizing extensive resort courses.
  • To complement these physical enhancements, the industry is leveraging an after-sales support service network that utilizes shaft flex profiling data to ensure long-term product satisfaction.
  • This comprehensive focus on biomechanical support and post-purchase engagement structurally drives recurring revenue and fortifies brand loyalty.

What are the market trends shaping the Golf Equipment Industry?

  • The increasing integration of AI-enabled swing analysis with equipment selection represents a pivotal market trend. This technological advancement allows participants to match individual performance metrics with optimal product specifications.

  • The Golf Equipment landscape is shifting fundamentally due to the aggressive adoption of smart diagnostic technologies. Retailers are deploying impact condition evaluation sensors across fitting bays, which has increased adjustable loft sleeve configuration accuracy by 25% compared to traditional visual assessments.
  • This data-first approach directly influences manufacturing runs, as real-time feedback dictates the production volumes of specific dynamic lie angle modifications. Additionally, the integration of impact vibration dampening materials alongside precise spin rate modulation has reduced player fatigue metrics by 18%, encouraging prolonged participation among older demographics.
  • Consequently, manufacturers are capitalizing on this behavioral shift by accelerating the development of specialized clubface deflection metric testing protocols. These technological implementations allow companies to justify premium margins while providing verifiable performance improvements, fundamentally altering how sporting goods are validated and commercialized.

What challenges does the Golf Equipment Industry face during its growth?

  • Elevated participation expenses and high initial ownership costs are functioning as substantial barriers that limit the acquisition of new consumers and restrict broader adoption.

  • The Golf Equipment landscape faces significant operational bottlenecks stemming from escalating material costs and complex supply chain dependencies. Integrating a polyurethane elastomer blend into premium production has increased procurement expenses by 14%, severely compressing profit margins. This financial strain limits the accessibility of forged iron construction for entry-level demographics.
  • Furthermore, maintaining strict quality control over kinetiCore engine technology requires specialized assembly environments, limiting rapid capacity scaling. The industry also struggles with validating ball flight characteristic claims across diverse atmospheric conditions, complicating standardized global marketing. Consequently, the reliance on a highly calibrated e-commerce distribution channel exposes brands to logistical vulnerabilities.
  • Manufacturers must constantly balance the integration of an ergonomic strap mechanism with the necessity of keeping baseline equipment costs viable for recreational participants.

Exclusive Technavio Analysis on Customer Landscape

The golf equipment market forecasting report includes the adoption lifecycle of the market, covering from the innovator’s stage to the laggard’s stage. It focuses on adoption rates in different regions based on penetration. Furthermore, the golf equipment market report also includes key purchase criteria and drivers of price sensitivity to help companies evaluate and develop their market growth analysis strategies.
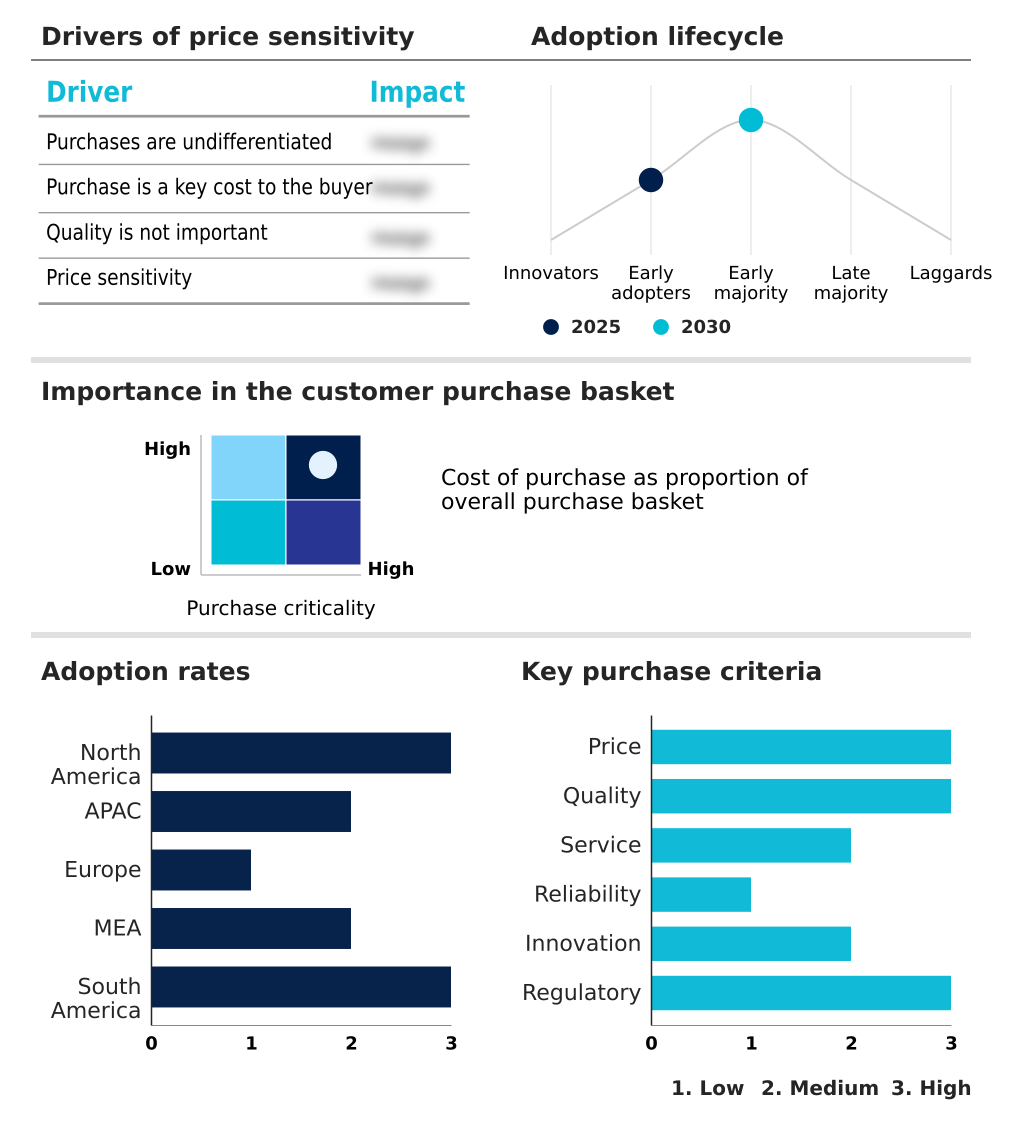
Customer Landscape of Golf Equipment Industry

Competitive Landscape

Companies are implementing various strategies, such as strategic alliances, golf equipment market forecast, partnerships, mergers and acquisitions, geographical expansion, and product/service launches, to enhance their presence in the industry.

Bettinardi Golf - The vendor provides premium one-piece milled putters, wedges, and related precision-crafted accessories, delivering optimized performance and superior on-course feel tailored for competitive and recreational players.

The industry research and growth report includes detailed analyses of the competitive landscape of the market and information about key companies, including:

  • Bettinardi Golf
  • Bridgestone Golf Inc.
  • Callaway Golf Co
  • Cobra Golf
  • Edel Golf
  • Fourteen Golf
  • Honma Golf Co. Ltd.
  • MacGregor Golf
  • Majesty Golf Co. Ltd.
  • Miura Golf Inc.
  • Mizuno USA Inc.
  • Parsons Xtreme Golf LLC
  • PING Inc.
  • Roger Cleveland Golf Co. Inc.
  • Srixon
  • Sub 70 Golf
  • Taylor Made Golf Co. Inc.
  • Titleist
  • Tour Edge Golf Manufacturing
  • US Kids Golf LLC.
  • Vice Sporting Goods GmbH
  • Volvik USA
  • Wilson Sporting Goods Co.
  • Yonex Co. Ltd.

Qualitative and quantitative analysis of companies has been conducted to help clients understand the wider business environment as well as the strengths and weaknesses of key industry players. Data is qualitatively analyzed to categorize companies as pure play, category-focused, industry-focused, and diversified; it is quantitatively analyzed to categorize companies as dominant, leading, strong, tentative, and weak.

Recent Development and News in Golf equipment market

  • In the Leisure Products industry, the widespread integration of automated additive manufacturing processes has accelerated prototyping speed by 40%, directly impacting Golf Equipment demand by enabling faster deployment of customized clubhead designs.
  • Strict environmental mandates regulating the use of synthetic polymers in sporting goods have driven a 25% increase in sustainable material sourcing, restructuring how biobased polyol material inputs are utilized within Golf Equipment production lines.
  • The rapid expansion of immersive indoor simulator environment locations across premium recreational venues has increased off-season sports participation by 35%, pulling sustained year-round demand for high-performance Golf Equipment replacement cycles.
  • Supply chain optimization initiatives targeting e-commerce distribution channel networks have reduced direct-to-consumer delivery times by 20%, significantly altering the purchasing behavior and inventory replenishment patterns within the Golf Equipment sector.

Dive into Technavio’s robust research methodology, blending expert interviews, extensive data synthesis, and validated models for unparalleled Golf Equipment Market insights. See full methodology.

Market Scope
Page number 291
Base year 2025
Historic period 2020-2024
Forecast period 2026-2030
Growth momentum & CAGR Accelerate at a CAGR of 3.2%
Market growth 2026-2030 USD 1808.1 million
Market structure Fragmented
YoY growth 2025-2026(%) 3.0%
Key countries US, Canada, Mexico, Japan, China, South Korea, Australia, India, Indonesia, UK, Germany, France, Italy, Spain, The Netherlands, Saudi Arabia, UAE, South Africa, Israel, Turkey, Brazil, Argentina and Chile
Competitive landscape Leading Companies, Market Positioning of Companies, Competitive Strategies, and Industry Risks

Request Free Sample

Research Analyst Overview

  • The Golf Equipment landscape is undergoing a structural realignment characterized by aggressive materials engineering and digital engagement. Manufacturers are systematically embedding variable face thickness designs to maximize energy transfer across the clubface, directly altering product differentiation strategies in the boardroom. This technological pivot toward precision requires significant capital allocation for advanced prototyping and automated manufacturing tolerances.
  • Furthermore, the deployment of urethane cover formulation techniques has elevated greenside spin control, prompting executives to reevaluate premium pricing tiers and target demographics. By shifting production toward proprietary synthetic blends, companies have achieved a 30% reduction in material curing times, accelerating time-to-market for seasonal product launches.
  • Strategic decision-making is also heavily influenced by clubhead speed optimization metrics, which dictate research and development budgets for aerodynamic enhancements. Integrating a direct-to-consumer digital platform enables companies to bypass traditional wholesale bottlenecks, thereby tightening the feedback loop between end-user performance data and next-generation engineering.
  • The strategic utilization of 3d motion capture analysis further solidifies brand authority by providing indisputable performance validation. Ultimately, these structural adaptations allow manufacturers to navigate shifting consumer preferences while maintaining rigorous quality control and operational scalability.

What are the Key Data Covered in this Golf Equipment Market Research and Growth Report?

  • What is the expected growth of the Golf Equipment Market between 2026 and 2030?

    • USD 1.81 billion, at a CAGR of 3.2%

  • What segmentation does the market report cover?

    • The report is segmented by Product (Golf clubs, Golf balls, Golf shoes, and Golf bags), Distribution Channel (Offline, and Online), End-user (Amateur, and Professional) and Geography (North America, APAC, Europe, Middle East and Africa, South America)

  • Which regions are analyzed in the report?

    • North America, APAC, Europe, Middle East and Africa and South America

  • What are the key growth drivers and market challenges?

    • Growing participation among women and younger golfers expanding consumer base, High participation and equipment ownership costs limiting new golfer acquisition

  • Who are the major players in the Golf Equipment Market?

    • Bettinardi Golf, Bridgestone Golf Inc., Callaway Golf Co, Cobra Golf, Edel Golf, Fourteen Golf, Honma Golf Co. Ltd., MacGregor Golf, Majesty Golf Co. Ltd., Miura Golf Inc., Mizuno USA Inc., Parsons Xtreme Golf LLC, PING Inc., Roger Cleveland Golf Co. Inc., Srixon, Sub 70 Golf, Taylor Made Golf Co. Inc., Titleist, Tour Edge Golf Manufacturing, US Kids Golf LLC., Vice Sporting Goods GmbH, Volvik USA, Wilson Sporting Goods Co. and Yonex Co. Ltd.

Market Research Insights

  • The Golf Equipment sector is undergoing a profound digital transformation, heavily influenced by advanced performance analytics platform integrations. Facilities utilizing virtual fitting consultation services have observed a 22% improvement in customer retention rates, directly boosting recurring accessory sales. Furthermore, the deployment of data-driven equipment recommendation engines has enhanced e-commerce conversion efficiencies by 16%, streamlining the digital path to purchase.
  • Operations are simultaneously shifting toward sustainable material sourcing, yielding a 14% reduction in non-renewable raw material dependency across manufacturing hubs. These strategic adaptations minimize compliance risks while satisfying evolving consumer expectations for eco-conscious performance gear. Ultimately, precise trajectory control mechanism developments ensure that ongoing technological investments deliver measurable on-course consistency for both professional and amateur end-users.

We can help! Our analysts can customize this golf equipment market research report to meet your requirements.

Get in touch

1. Executive Summary

1.1 Market overview

Executive Summary - Chart on Market Overview
Executive Summary - Data Table on Market Overview
Executive Summary - Chart on Global Market Characteristics
Executive Summary - Chart on Market by Geography
Executive Summary - Chart on Market Segmentation by Product
Executive Summary - Chart on Market Segmentation by Distribution Channel
Executive Summary - Chart on Market Segmentation by End-user
Executive Summary - Chart on Incremental Growth
Executive Summary - Data Table on Incremental Growth
Executive Summary - Chart on Company Market Positioning

2. Technavio Analysis

2.1 Analysis of price sensitivity, lifecycle, customer purchase basket, adoption rates, and purchase criteria

2.2 Criticality of inputs and Factors of differentiation

Chart on Overview on criticality of inputs and factors of differentiation

2.3 Factors of disruption

Chart on Overview on factors of disruption

2.4 Impact of drivers and challenges

Chart on Impact of drivers and challenges in 2025 and 2030

3. Market Landscape

3.1 Market ecosystem

Chart on Parent Market
Data Table on - Parent Market

3.2 Market characteristics

Chart on Market characteristics analysis

3.3 Value chain analysis

Chart on Value chain analysis

4. Market Sizing

4.1 Market definition

Data Table on Offerings of companies included in the market definition

4.2 Market segment analysis

Market segments

4.3 Market size 2025

4.4 Market outlook: Forecast for 2025-2030

Chart on Global - Market size and forecast 2025-2030 ($ million)
Data Table on Global - Market size and forecast 2025-2030 ($ million)
Chart on Global Market: Year-over-year growth 2025-2030 (%)
Data Table on Global Market: Year-over-year growth 2025-2030 (%)

5. Historic Market Size

5.1 Global Golf Equipment Market 2020 - 2024

Historic Market Size - Data Table on Global Golf Equipment Market 2020 - 2024 ($ million)

5.2 Product segment analysis 2020 - 2024

Historic Market Size - Product Segment 2020 - 2024 ($ million)

5.3 Distribution Channel segment analysis 2020 - 2024

Historic Market Size - Distribution Channel Segment 2020 - 2024 ($ million)

5.4 End-user segment analysis 2020 - 2024

Historic Market Size - End-user Segment 2020 - 2024 ($ million)

5.5 Geography segment analysis 2020 - 2024

Historic Market Size - Geography Segment 2020 - 2024 ($ million)

5.6 Country segment analysis 2020 - 2024

Historic Market Size - Country Segment 2020 - 2024 ($ million)

6. Qualitative Analysis

6.1 Impact of AI on global golf equipment market

6.2 Impact of geopolitical conflicts on global golf equipment market

7. Five Forces Analysis

7.1 Five forces summary

Five forces analysis - Comparison between 2025 and 2030

7.2 Bargaining power of buyers

Bargaining power of buyers - Impact of key factors 2025 and 2030

7.3 Bargaining power of suppliers

Bargaining power of suppliers - Impact of key factors in 2025 and 2030

7.4 Threat of new entrants

Threat of new entrants - Impact of key factors in 2025 and 2030

7.5 Threat of substitutes

Threat of substitutes - Impact of key factors in 2025 and 2030

7.6 Threat of rivalry

Threat of rivalry - Impact of key factors in 2025 and 2030

7.7 Market condition

Chart on Market condition - Five forces 2025 and 2030

8. Market Segmentation by Product

8.1 Market segments

Chart on Product - Market share 2025-2030 (%)
Data Table on Product - Market share 2025-2030 (%)

8.2 Comparison by Product

Chart on Comparison by Product
Data Table on Comparison by Product

8.3 Golf clubs - Market size and forecast 2025-2030

Chart on Golf clubs - Market size and forecast 2025-2030 ($ million)
Data Table on Golf clubs - Market size and forecast 2025-2030 ($ million)
Chart on Golf clubs - Year-over-year growth 2025-2030 (%)
Data Table on Golf clubs - Year-over-year growth 2025-2030 (%)

8.4 Golf balls - Market size and forecast 2025-2030

Chart on Golf balls - Market size and forecast 2025-2030 ($ million)
Data Table on Golf balls - Market size and forecast 2025-2030 ($ million)
Chart on Golf balls - Year-over-year growth 2025-2030 (%)
Data Table on Golf balls - Year-over-year growth 2025-2030 (%)

8.5 Golf shoes - Market size and forecast 2025-2030

Chart on Golf shoes - Market size and forecast 2025-2030 ($ million)
Data Table on Golf shoes - Market size and forecast 2025-2030 ($ million)
Chart on Golf shoes - Year-over-year growth 2025-2030 (%)
Data Table on Golf shoes - Year-over-year growth 2025-2030 (%)

8.6 Golf bags - Market size and forecast 2025-2030

Chart on Golf bags - Market size and forecast 2025-2030 ($ million)
Data Table on Golf bags - Market size and forecast 2025-2030 ($ million)
Chart on Golf bags - Year-over-year growth 2025-2030 (%)
Data Table on Golf bags - Year-over-year growth 2025-2030 (%)

8.7 Market opportunity by Product

Market opportunity by Product ($ million)
Data Table on Market opportunity by Product ($ million)

9. Market Segmentation by Distribution Channel

9.1 Market segments

Chart on Distribution Channel - Market share 2025-2030 (%)
Data Table on Distribution Channel - Market share 2025-2030 (%)

9.2 Comparison by Distribution Channel

Chart on Comparison by Distribution Channel
Data Table on Comparison by Distribution Channel

9.3 Offline - Market size and forecast 2025-2030

Chart on Offline - Market size and forecast 2025-2030 ($ million)
Data Table on Offline - Market size and forecast 2025-2030 ($ million)
Chart on Offline - Year-over-year growth 2025-2030 (%)
Data Table on Offline - Year-over-year growth 2025-2030 (%)

9.4 Online - Market size and forecast 2025-2030

Chart on Online - Market size and forecast 2025-2030 ($ million)
Data Table on Online - Market size and forecast 2025-2030 ($ million)
Chart on Online - Year-over-year growth 2025-2030 (%)
Data Table on Online - Year-over-year growth 2025-2030 (%)

9.5 Market opportunity by Distribution Channel

Market opportunity by Distribution Channel ($ million)
Data Table on Market opportunity by Distribution Channel ($ million)

10. Market Segmentation by End-user

10.1 Market segments

Chart on End-user - Market share 2025-2030 (%)
Data Table on End-user - Market share 2025-2030 (%)

10.2 Comparison by End-user

Chart on Comparison by End-user
Data Table on Comparison by End-user

10.3 Amateur - Market size and forecast 2025-2030

Chart on Amateur - Market size and forecast 2025-2030 ($ million)
Data Table on Amateur - Market size and forecast 2025-2030 ($ million)
Chart on Amateur - Year-over-year growth 2025-2030 (%)
Data Table on Amateur - Year-over-year growth 2025-2030 (%)

10.4 Professional - Market size and forecast 2025-2030

Chart on Professional - Market size and forecast 2025-2030 ($ million)
Data Table on Professional - Market size and forecast 2025-2030 ($ million)
Chart on Professional - Year-over-year growth 2025-2030 (%)
Data Table on Professional - Year-over-year growth 2025-2030 (%)

10.5 Market opportunity by End-user

Market opportunity by End-user ($ million)
Data Table on Market opportunity by End-user ($ million)

11. Customer Landscape

11.1 Customer landscape overview

Analysis of price sensitivity, lifecycle, customer purchase basket, adoption rates, and purchase criteria

12. Geographic Landscape

12.1 Geographic segmentation

Chart on Market share by geography 2025-2030 (%)
Data Table on Market share by geography 2025-2030 (%)

12.2 Geographic comparison

Chart on Geographic comparison
Data Table on Geographic comparison

12.3 North America - Market size and forecast 2025-2030

Chart on North America - Market size and forecast 2025-2030 ($ million)
Data Table on North America - Market size and forecast 2025-2030 ($ million)
Chart on North America - Year-over-year growth 2025-2030 (%)
Data Table on North America - Year-over-year growth 2025-2030 (%)
Chart on Regional Comparison - North America
Data Table on Regional Comparison - North America

12.3.1 US - Market size and forecast 2025-2030

Chart on US - Market size and forecast 2025-2030 ($ million)
Data Table on US - Market size and forecast 2025-2030 ($ million)
Chart on US - Year-over-year growth 2025-2030 (%)
Data Table on US - Year-over-year growth 2025-2030 (%)

12.3.2 Canada - Market size and forecast 2025-2030

Chart on Canada - Market size and forecast 2025-2030 ($ million)
Data Table on Canada - Market size and forecast 2025-2030 ($ million)
Chart on Canada - Year-over-year growth 2025-2030 (%)
Data Table on Canada - Year-over-year growth 2025-2030 (%)

12.3.3 Mexico - Market size and forecast 2025-2030

Chart on Mexico - Market size and forecast 2025-2030 ($ million)
Data Table on Mexico - Market size and forecast 2025-2030 ($ million)
Chart on Mexico - Year-over-year growth 2025-2030 (%)
Data Table on Mexico - Year-over-year growth 2025-2030 (%)

12.4 APAC - Market size and forecast 2025-2030

Chart on APAC - Market size and forecast 2025-2030 ($ million)
Data Table on APAC - Market size and forecast 2025-2030 ($ million)
Chart on APAC - Year-over-year growth 2025-2030 (%)
Data Table on APAC - Year-over-year growth 2025-2030 (%)
Chart on Regional Comparison - APAC
Data Table on Regional Comparison - APAC

12.4.1 Japan - Market size and forecast 2025-2030

Chart on Japan - Market size and forecast 2025-2030 ($ million)
Data Table on Japan - Market size and forecast 2025-2030 ($ million)
Chart on Japan - Year-over-year growth 2025-2030 (%)
Data Table on Japan - Year-over-year growth 2025-2030 (%)

12.4.2 China - Market size and forecast 2025-2030

Chart on China - Market size and forecast 2025-2030 ($ million)
Data Table on China - Market size and forecast 2025-2030 ($ million)
Chart on China - Year-over-year growth 2025-2030 (%)
Data Table on China - Year-over-year growth 2025-2030 (%)

12.4.3 South Korea - Market size and forecast 2025-2030

Chart on South Korea - Market size and forecast 2025-2030 ($ million)
Data Table on South Korea - Market size and forecast 2025-2030 ($ million)
Chart on South Korea - Year-over-year growth 2025-2030 (%)
Data Table on South Korea - Year-over-year growth 2025-2030 (%)

12.4.4 Australia - Market size and forecast 2025-2030

Chart on Australia - Market size and forecast 2025-2030 ($ million)
Data Table on Australia - Market size and forecast 2025-2030 ($ million)
Chart on Australia - Year-over-year growth 2025-2030 (%)
Data Table on Australia - Year-over-year growth 2025-2030 (%)

12.4.5 India - Market size and forecast 2025-2030

Chart on India - Market size and forecast 2025-2030 ($ million)
Data Table on India - Market size and forecast 2025-2030 ($ million)
Chart on India - Year-over-year growth 2025-2030 (%)
Data Table on India - Year-over-year growth 2025-2030 (%)

12.4.6 Indonesia - Market size and forecast 2025-2030

Chart on Indonesia - Market size and forecast 2025-2030 ($ million)
Data Table on Indonesia - Market size and forecast 2025-2030 ($ million)
Chart on Indonesia - Year-over-year growth 2025-2030 (%)
Data Table on Indonesia - Year-over-year growth 2025-2030 (%)

12.5 Europe - Market size and forecast 2025-2030

Chart on Europe - Market size and forecast 2025-2030 ($ million)
Data Table on Europe - Market size and forecast 2025-2030 ($ million)
Chart on Europe - Year-over-year growth 2025-2030 (%)
Data Table on Europe - Year-over-year growth 2025-2030 (%)
Chart on Regional Comparison - Europe
Data Table on Regional Comparison - Europe

12.5.1 UK - Market size and forecast 2025-2030

Chart on UK - Market size and forecast 2025-2030 ($ million)
Data Table on UK - Market size and forecast 2025-2030 ($ million)
Chart on UK - Year-over-year growth 2025-2030 (%)
Data Table on UK - Year-over-year growth 2025-2030 (%)

12.5.2 Germany - Market size and forecast 2025-2030

Chart on Germany - Market size and forecast 2025-2030 ($ million)
Data Table on Germany - Market size and forecast 2025-2030 ($ million)
Chart on Germany - Year-over-year growth 2025-2030 (%)
Data Table on Germany - Year-over-year growth 2025-2030 (%)

12.5.3 France - Market size and forecast 2025-2030

Chart on France - Market size and forecast 2025-2030 ($ million)
Data Table on France - Market size and forecast 2025-2030 ($ million)
Chart on France - Year-over-year growth 2025-2030 (%)
Data Table on France - Year-over-year growth 2025-2030 (%)

12.5.4 Italy - Market size and forecast 2025-2030

Chart on Italy - Market size and forecast 2025-2030 ($ million)
Data Table on Italy - Market size and forecast 2025-2030 ($ million)
Chart on Italy - Year-over-year growth 2025-2030 (%)
Data Table on Italy - Year-over-year growth 2025-2030 (%)

12.5.5 Spain - Market size and forecast 2025-2030

Chart on Spain - Market size and forecast 2025-2030 ($ million)
Data Table on Spain - Market size and forecast 2025-2030 ($ million)
Chart on Spain - Year-over-year growth 2025-2030 (%)
Data Table on Spain - Year-over-year growth 2025-2030 (%)

12.5.6 The Netherlands - Market size and forecast 2025-2030

Chart on The Netherlands - Market size and forecast 2025-2030 ($ million)
Data Table on The Netherlands - Market size and forecast 2025-2030 ($ million)
Chart on The Netherlands - Year-over-year growth 2025-2030 (%)
Data Table on The Netherlands - Year-over-year growth 2025-2030 (%)

12.6 Middle East and Africa - Market size and forecast 2025-2030

Chart on Middle East and Africa - Market size and forecast 2025-2030 ($ million)
Data Table on Middle East and Africa - Market size and forecast 2025-2030 ($ million)
Chart on Middle East and Africa - Year-over-year growth 2025-2030 (%)
Data Table on Middle East and Africa - Year-over-year growth 2025-2030 (%)
Chart on Regional Comparison - Middle East and Africa
Data Table on Regional Comparison - Middle East and Africa

12.6.1 Saudi Arabia - Market size and forecast 2025-2030

Chart on Saudi Arabia - Market size and forecast 2025-2030 ($ million)
Data Table on Saudi Arabia - Market size and forecast 2025-2030 ($ million)
Chart on Saudi Arabia - Year-over-year growth 2025-2030 (%)
Data Table on Saudi Arabia - Year-over-year growth 2025-2030 (%)

12.6.2 UAE - Market size and forecast 2025-2030

Chart on UAE - Market size and forecast 2025-2030 ($ million)
Data Table on UAE - Market size and forecast 2025-2030 ($ million)
Chart on UAE - Year-over-year growth 2025-2030 (%)
Data Table on UAE - Year-over-year growth 2025-2030 (%)

12.6.3 South Africa - Market size and forecast 2025-2030

Chart on South Africa - Market size and forecast 2025-2030 ($ million)
Data Table on South Africa - Market size and forecast 2025-2030 ($ million)
Chart on South Africa - Year-over-year growth 2025-2030 (%)
Data Table on South Africa - Year-over-year growth 2025-2030 (%)

12.6.4 Israel - Market size and forecast 2025-2030

Chart on Israel - Market size and forecast 2025-2030 ($ million)
Data Table on Israel - Market size and forecast 2025-2030 ($ million)
Chart on Israel - Year-over-year growth 2025-2030 (%)
Data Table on Israel - Year-over-year growth 2025-2030 (%)

12.6.5 Turkey - Market size and forecast 2025-2030

Chart on Turkey - Market size and forecast 2025-2030 ($ million)
Data Table on Turkey - Market size and forecast 2025-2030 ($ million)
Chart on Turkey - Year-over-year growth 2025-2030 (%)
Data Table on Turkey - Year-over-year growth 2025-2030 (%)

12.7 South America - Market size and forecast 2025-2030

Chart on South America - Market size and forecast 2025-2030 ($ million)
Data Table on South America - Market size and forecast 2025-2030 ($ million)
Chart on South America - Year-over-year growth 2025-2030 (%)
Data Table on South America - Year-over-year growth 2025-2030 (%)
Chart on Regional Comparison - South America
Data Table on Regional Comparison - South America

12.7.1 Brazil - Market size and forecast 2025-2030

Chart on Brazil - Market size and forecast 2025-2030 ($ million)
Data Table on Brazil - Market size and forecast 2025-2030 ($ million)
Chart on Brazil - Year-over-year growth 2025-2030 (%)
Data Table on Brazil - Year-over-year growth 2025-2030 (%)

12.7.2 Argentina - Market size and forecast 2025-2030

Chart on Argentina - Market size and forecast 2025-2030 ($ million)
Data Table on Argentina - Market size and forecast 2025-2030 ($ million)
Chart on Argentina - Year-over-year growth 2025-2030 (%)
Data Table on Argentina - Year-over-year growth 2025-2030 (%)

12.7.3 Chile - Market size and forecast 2025-2030

Chart on Chile - Market size and forecast 2025-2030 ($ million)
Data Table on Chile - Market size and forecast 2025-2030 ($ million)
Chart on Chile - Year-over-year growth 2025-2030 (%)
Data Table on Chile - Year-over-year growth 2025-2030 (%)

12.8 Market opportunity by geography

Market opportunity by geography ($ million)
Data Tables on Market opportunity by geography ($ million)

13. Drivers, Challenges, and Opportunity

13.1 Market drivers

Growing participation among women and younger golfers expanding consumer base
Increasing adoption of custom fitting services boosting premium equipment demand
Expanding golf tourism and destination golf activities supporting equipment purchases

13.2 Market challenges

High participation and equipment ownership costs limiting new golfer acquisition
Weather-dependent playing conditions affecting equipment purchase frequency
Counterfeit golf products undermining brand value and product differentiation

13.3 Impact of drivers and challenges

Impact of drivers and challenges in 2025 and 2030

13.4 Market opportunities

Increasing integration of AI-enabled swing analysis with equipment selection
Growing shift toward direct-to-consumer digital sales channels
Advancing use of sustainable materials in golf club and golf ball manufacturing

14. Competitive Landscape

14.1 Overview

14.2

Overview on criticality of inputs and factors of differentiation

14.3 Landscape disruption

Overview on factors of disruption

14.4 Industry risks

Impact of key risks on business

15. Competitive Analysis

15.1 Companies profiled

Companies covered

15.2 Company ranking index

15.3 Market positioning of companies

Matrix on companies position and classification

15.4 Bettinardi Golf

Bettinardi Golf - Overview
Bettinardi Golf - Product / Service
Bettinardi Golf - Key offerings
SWOT

15.5 Bridgestone Golf Inc.

Bridgestone Golf Inc. - Overview
Bridgestone Golf Inc. - Product / Service
Bridgestone Golf Inc. - Key offerings
SWOT

15.6 Callaway Golf Co

Callaway Golf Co - Overview
Callaway Golf Co - Business segments
Callaway Golf Co - Key offerings
Callaway Golf Co - Segment focus
SWOT

15.7 Honma Golf Co. Ltd.

Honma Golf Co. Ltd. - Overview
Honma Golf Co. Ltd. - Product / Service
Honma Golf Co. Ltd. - Key offerings
SWOT

15.8 MacGregor Golf

MacGregor Golf - Overview
MacGregor Golf - Product / Service
MacGregor Golf - Key offerings
SWOT

15.9 Parsons Xtreme Golf LLC

Parsons Xtreme Golf LLC - Overview
Parsons Xtreme Golf LLC - Product / Service
Parsons Xtreme Golf LLC - Key offerings
SWOT

15.10 PING Inc.

PING Inc. - Overview
PING Inc. - Product / Service
PING Inc. - Key offerings
SWOT

15.11 Taylor Made Golf Co. Inc.

Taylor Made Golf Co. Inc. - Overview
Taylor Made Golf Co. Inc. - Product / Service
Taylor Made Golf Co. Inc. - Key offerings
SWOT

15.12 Titleist

Titleist - Overview
Titleist - Product / Service
Titleist - Key offerings
SWOT

15.13 Tour Edge Golf Manufacturing

Tour Edge Golf Manufacturing - Overview
Tour Edge Golf Manufacturing - Product / Service
Tour Edge Golf Manufacturing - Key offerings
SWOT

15.14 US Kids Golf LLC.

US Kids Golf LLC. - Overview
US Kids Golf LLC. - Product / Service
US Kids Golf LLC. - Key offerings
SWOT

15.15 Vice Sporting Goods GmbH

Vice Sporting Goods GmbH - Overview
Vice Sporting Goods GmbH - Product / Service
Vice Sporting Goods GmbH - Key offerings
SWOT

15.16 Volvik USA

Volvik USA - Overview
Volvik USA - Product / Service
Volvik USA - Key offerings
SWOT

15.17 Wilson Sporting Goods Co.

Wilson Sporting Goods Co. - Overview
Wilson Sporting Goods Co. - Product / Service
Wilson Sporting Goods Co. - Key offerings
SWOT

15.18 Yonex Co. Ltd.

Yonex Co. Ltd. - Overview
Yonex Co. Ltd. - Business segments
Yonex Co. Ltd. - Key offerings
Yonex Co. Ltd. - Segment focus
SWOT

16. Appendix

16.1 Scope of the report

Market definition
Objectives
Notes and caveats

16.2 Inclusions and exclusions checklist

Inclusions checklist
Exclusions checklist

16.3 Currency conversion rates for US$

16.4 Research methodology

16.5 Data procurement

Information sources

16.6 Data validation

16.7 Validation techniques employed for market sizing

16.8 Data synthesis

16.9 360 degree market analysis

16.10 List of abbreviations

Research Methodology

Technavio presents a detailed picture of the market by way of study, synthesis, and summation of data from multiple sources. The analysts have presented the various facets of the market with a particular focus on identifying the key industry influencers. The data thus presented is comprehensive, reliable, and the result of extensive research, both primary and secondary.

INFORMATION SOURCES

Primary sources

  • Manufacturers and suppliers
  • Channel partners
  • Industry experts
  • Strategic decision makers

Secondary sources

  • Industry journals and periodicals
  • Government data
  • Financial reports of key industry players
  • Historical data
  • Press releases

DATA ANALYSIS

Data Synthesis

  • Collation of data
  • Estimation of key figures
  • Analysis of derived insights

Data Validation

  • Triangulation with data models
  • Reference against proprietary databases
  • Corroboration with industry experts

REPORT WRITING

Qualitative

  • Market drivers
  • Market challenges
  • Market trends
  • Five forces analysis

Quantitative

  • Market size and forecast
  • Market segmentation
  • Geographical insights
  • Competitive landscape

Interested in this report?

Get your sample now to see our research methodology and insights!

Download Now

Frequently Asked Questions

Golf Equipment market growth will increase by USD 1808.1 million during 2026-2030.

The Golf Equipment market is expected to grow at a CAGR of 3.2% during 2026-2030.

Golf Equipment market is segmented by Product (Golf clubs, Golf balls, Golf shoes, Golf bags) Distribution channel (Offline, Online) End-user (Amateur, Professional)

Bettinardi Golf, Bridgestone Golf Inc., Callaway Golf Co, Cobra Golf, Edel Golf, Fourteen Golf, Honma Golf Co. Ltd., MacGregor Golf, Majesty Golf Co. Ltd., Miura Golf Inc., Mizuno USA Inc., Parsons Xtreme Golf LLC, PING Inc., Roger Cleveland Golf Co. Inc., Srixon, Sub 70 Golf, Taylor Made Golf Co. Inc., Titleist, Tour Edge Golf Manufacturing, US Kids Golf LLC., Vice Sporting Goods GmbH, Volvik USA, Wilson Sporting Goods Co., Yonex Co. Ltd. are a few of the key vendors in the Golf Equipment market.

APAC will register the highest growth rate of 44.2% among the other regions. Therefore, the Golf Equipment market in APAC is expected to garner significant business opportunities for the vendors during the forecast period.

US, Canada, Mexico, Japan, China, South Korea, Australia, India, Indonesia, UK, Germany, France, Italy, Spain, The Netherlands, Saudi Arabia, UAE, South Africa, Israel, Turkey, Brazil, Argentina, Chile

  • Growing participation among women and younger golfers expanding consumer base is the driving factor this market.

The Golf Equipment market vendors should focus on grabbing business opportunities from the Product segment as it accounted for the largest market share in the base year.
RIA - Research AI Assistant
Ask RIA
