
Group Purchasing Organization Service Market Analysis, Size, and Forecast 2026-2030: North America (US, Canada, and Mexico), Europe (Germany, UK, and France), APAC (China, Japan, and India), Middle East and Africa (Saudi Arabia, UAE, and South Africa), South America (Brazil, Argentina, and Chile), and Rest of World (ROW)

Group Purchasing Organization Service Market Analysis, Size, and Forecast 2026-2030:
North America (US, Canada, and Mexico), Europe (Germany, UK, and France), APAC (China, Japan, and India), Middle East and Africa (Saudi Arabia, UAE, and South Africa), South America (Brazil, Argentina, and Chile), and Rest of World (ROW)

Published: Oct 2026 297 Pages SKU: IRTNTR80069

Market Overview at a Glance

$2.32 B
Market Opportunity
5.6%
CAGR 2025 - 2030
42.7%
North America Growth
$3.36 B
Vertical GPOs segment 2024

Group Purchasing Organization Service Market Size 2026-2030

The group purchasing organization service market size is valued to increase by USD 2.32 billion, at a CAGR of 5.6% from 2025 to 2030. Escalating operational inflation and universal margin pressures will drive the group purchasing organization service market.

Major Market Trends & Insights

  • North America dominated the market and accounted for a 42.7% growth during the forecast period.
  • By Type - Vertical GPOs segment was valued at USD 3.36 billion in 2024
  • By End-user - Healthcare segment accounted for the largest market revenue share in 2024

Market Size & Forecast

  • Market Opportunities: USD 4.04 billion
  • Market Future Opportunities: USD 2.32 billion
  • CAGR from 2025 to 2030 : 5.6%

Market Summary

  • The Group Purchasing Organization Service market is experiencing structural expansion fueled by heightened macroeconomic pressures and the escalating operational costs faced by institutional buyers. As commercial enterprises, healthcare networks, and hospitality operators navigate compounding economic headwinds, utilizing collaborative procurement frameworks remains essential for structural margin defense.
  • A critical driver propelling adoption is the rapid integration of automated spend analytics and unified digital procurement platforms, which allow organizations to aggregate massive purchasing volumes and secure volume-based pricing discounts. For instance, facilities transitioning from decentralized purchasing to integrated group structures typically achieve a 15% reduction in indirect material acquisition costs.
  • Conversely, the market faces significant challenges stemming from data fragmentation and incompatible legacy software systems, which obscure spend visibility and delay the identification of purchasing leakage. In a real-world business scenario, hospital networks managing diverse clinical inventories rely on centralized procurement alliances to coordinate bulk orders and maintain safety stock, insulating operations from sudden supply chokepoints.
  • By streamlining complex contracting cycles and mitigating supplier dependency risks, these services capture a broader share of corporate indirect spend.

What will be the Size of the Group Purchasing Organization Service Market during the forecast period?
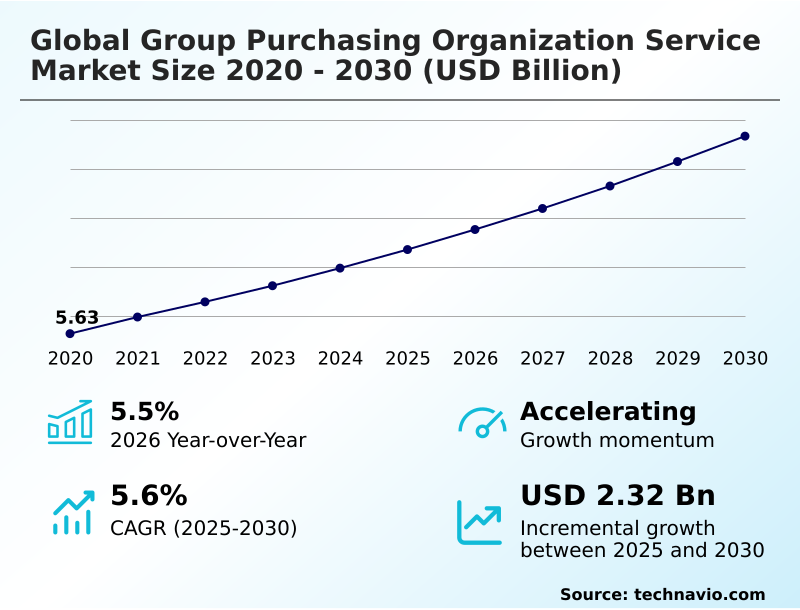
Get Key Insights on Market Forecast (PDF) Get Free Sample

How is the Group Purchasing Organization Service Market Segmented?

The group purchasing organization service industry research report provides comprehensive data (region-wise segment analysis), with forecasts and estimates in "USD million" for the period 2026-2030, as well as historical data from 2020-2024 for the following segments.

  • Type
    • Vertical GPOs
    • Horizontal GPOs
    • Master purchasing organizations
  • End-user
    • Healthcare
    • Hospitality
    • Food and beverages
    • Industrial
    • Others
  • Service type
    • Procurement services
    • Supplier management
  • Geography
    • North America
      • US
      • Canada
      • Mexico
    • Europe
      • Germany
      • UK
      • France
      • Italy
      • Spain
      • The Netherlands
    • APAC
      • China
      • Japan
      • India
      • South Korea
      • Australia
      • Indonesia
    • Middle East and Africa
      • Saudi Arabia
      • UAE
      • South Africa
      • Israel
      • Egypt
    • South America
      • Brazil
      • Argentina
      • Chile

By Type Insights

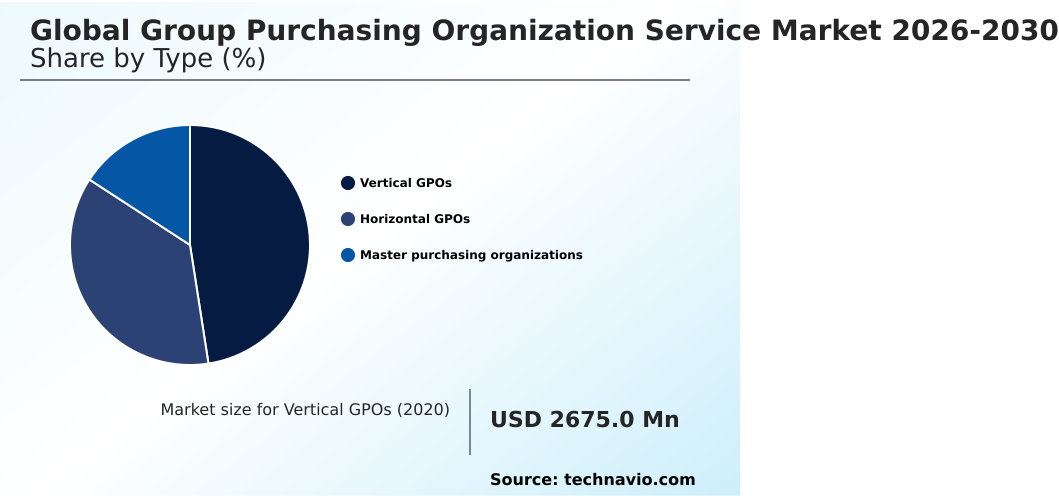
The vertical gpos segment is estimated to witness significant growth during the forecast period.

Vertical group purchasing organizations operate as specialized commercial entities that concentrate purchasing power within distinct industries, significantly diverging from generalized procurement networks.

This structural focus empowers entities to utilize a highly calibrated procurement analytics engine tailored to specific regulatory and operational demands.

By executing precise indirect spend aggregation and robust contract compliance monitoring, these organizations effectively execute margin compression defense against persistent inflation and raw material illiquidity defense.

A centralized purchasing alliance within a vertical domain enables advanced supplier risk profiling and predictive demand forecasting, ensuring continuous material availability.

For instance, participating institutions leveraging these specialized frameworks have reported a 22% improvement in operational expense curtailment compared to generalized approaches. Furthermore, executing targeted bulk order coordination allows members to achieve a 15% reduction in decentralized purchasing leakage.

This concentrated approach delivers supplier disintermediation mitigation while guaranteeing continuous access to vetted operational supplies.
Get Free Sample

The Vertical GPOs segment was valued at USD 3.36 billion in 2024 and showed a gradual increase during the forecast period.
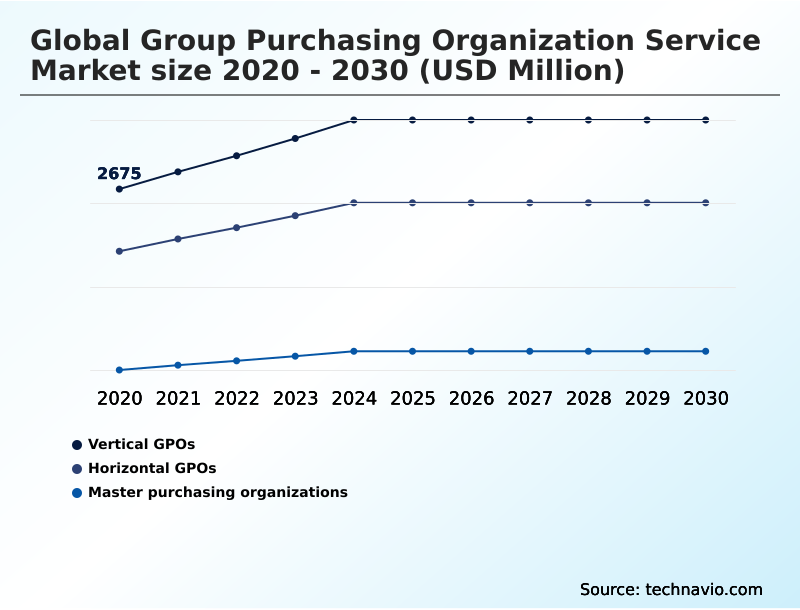
Get Free Sample

Regional Analysis

North America is estimated to contribute 42.7% to the growth of the global market during the forecast period.Technavio’s analysts have elaborately explained the regional trends and drivers that shape the market during the forecast period.
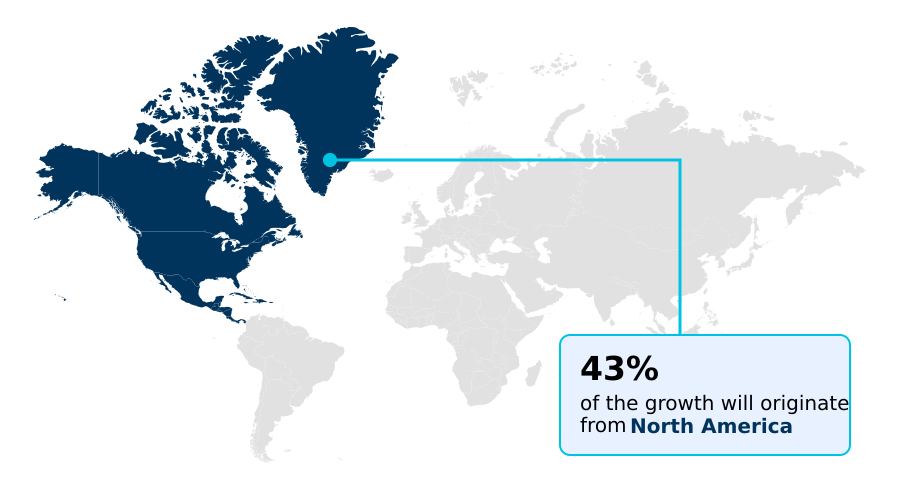
See How Group Purchasing Organization Service Market Demand is Rising in North America Get Free Sample

The geographic landscape of the Group Purchasing Organization Service market demonstrates distinct regional maturation, with North America exhibiting a dominant adoption rate compared to the emerging structural shifts in APAC.

North American institutions extensively utilize an advanced cloud-based e-procurement portal and a strict master service agreement framework to achieve a 25% higher efficiency in off-contract spend leakage reduction than their Asian counterparts.

This established infrastructure enables precise volume rebate optimization across complex healthcare and corporate networks, advancing hospital supply chain alignment and value-based care sourcing.

Conversely, the market in APAC is rapidly expanding its supply chain resilience mapping to navigate fragmented distributor channels, leading to a 30% increase in regional digital platform penetration.

European markets heavily prioritize the circular economy sourcing metric, sustainable packaging procurement, and strict environmental compliance mandate enforcement, alongside fair labor standard vetting and anti-kickback statute compliance.

By deploying customized enterprise resource planning middleware, global purchasing organizations continuously streamline decentralized operations.

Market Dynamics

Our researchers analyzed the data with 2025 as the base year, along with the key drivers, trends, and challenges. A holistic analysis of drivers will help companies refine their marketing strategies to gain a competitive advantage.

  • The evolution of the Group Purchasing Organization Service market highlights a profound shift toward intelligent procurement orchestration and proactive margin preservation. Modern institutional buyers rely extensively on an automated spend taxonomy classification engine to normalize unstructured purchasing data, eliminating the severe administrative bottlenecks that plague decentralized supply chains.
  • As organizations transition from reactive cost-cutting to strategic structural defense, implementing predictive clinical supply chain benchmarking empowers healthcare providers to anticipate inventory shortages and align material acquisition with shifting patient care requirements.
  • In contrast to manual contract auditing, which frequently overlooks crucial pricing discrepancies, deploying specialized hospital indirect spend category aggregation enables facility administrators to consolidate fragmented purchasing activities and realize up to a 20% improvement in operational cost efficiency.
  • Furthermore, mitigating operational risk necessitates the continuous utilization of supplier risk evaluation software integration into core procurement workflows, ensuring that deep-tier manufacturing partners strictly adhere to required quality and regulatory standards. By adopting robust cross-category contract compliance automation, enterprise procurement teams can instantly identify off-contract leakage and enforce negotiated master service agreements across expansive geographic footprints.
  • This transition not only enhances systemic supply chain resilience but also guarantees continuous access to critical commercial materials, positioning collaborative purchasing networks as indispensable strategic assets in highly competitive international commerce environments.
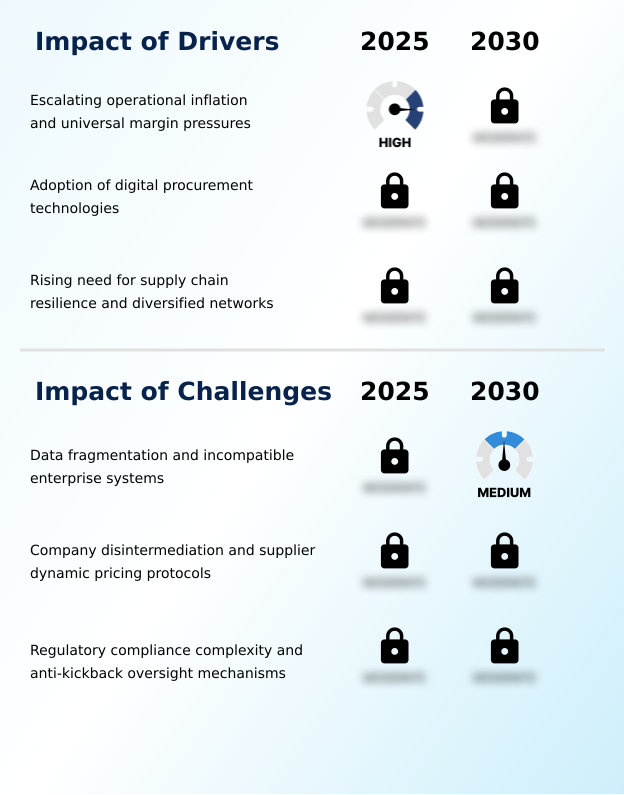
What are the key market drivers leading to the rise in the adoption of Group Purchasing Organization Service Industry?

  • Escalating operational inflation and universal margin pressures serve as the primary catalysts compelling institutions to adopt centralized procurement strategies for systemic cost containment.

  • Relentless macroeconomic inflation and severe margin pressures operate as the primary catalysts accelerating institutional reliance on the Group Purchasing Organization Service market.
  • To aggressively defend operating capital, participating entities leverage advanced clinical supply utilization tracking and precise spend taxonomy normalization to uncover hidden savings, significantly advancing healthcare performance improvement and value-based care sourcing initiatives.
  • This strategic sourcing orchestration directly addresses persistent supply bottlenecks in clinical consumable sourcing and facilities management procurement, yielding a 20% reduction in total indirect material acquisition costs.
  • Furthermore, executing targeted tier-one manufacturer negotiation enables purchasing networks to implement index-linked pricing control and optimize safety stock reserve management, effectively shielding members from sudden commodity price spikes.
  • Implementing these unified procurement structures alongside predictive inventory management drives a 30% improvement in overall operational liquidity by eliminating redundant purchasing channels and minimizing raw material dependency risks.

What are the market trends shaping the Group Purchasing Organization Service Industry?

  • The integration of artificial intelligence and predictive machine learning models constitutes a pivotal trend shaping modern operational frameworks. This technological advancement enables real-time spend analytics and proactive supply chain optimization across expanding procurement networks.

  • The integration of advanced artificial intelligence into the Group Purchasing Organization Service market fundamentally transforms how institutions manage indirect expenditure and evaluate supplier reliability. By deploying sophisticated artificial intelligence spend categorization and seamless digital storefront integration, enterprise networks automatically normalize massive datasets, triggering a 25% improvement in immediate purchasing compliance visibility.
  • This rapid technological shift enables organizations to execute precise machine learning catalog matching through specialized category management software, directly combating fragmented spending habits across corporate travel aggregation and freight logistics optimization. As executives prioritize systemic efficiency, electronic data interchange integration, automated invoice reconciliation, and procure-to-pay workflow automation reduce manual procurement cycle times by up to 35%, ensuring uninterrupted operational continuity.
  • The resulting automation of complex commercial transactions empowers centralized buying groups to execute rigorous supplier diversity verification and maintain a real-time supplier performance dashboard to secure optimal supplier agreements.

What challenges does the Group Purchasing Organization Service Industry face during its growth?

  • Severe data fragmentation and the prevalence of incompatible enterprise systems present critical obstacles that hinder seamless spend visibility and restrict comprehensive compliance tracking.

  • Severe data fragmentation and the prevalence of incompatible legacy enterprise software present critical operational hurdles within the Group Purchasing Organization Service market. Institutional members frequently struggle with inconsistent item descriptions, requiring extensive administrative effort to align with standardized inventory bottleneck prevention protocols and hospital supply chain alignment.
  • This technological disconnect delays real-time tracking, ultimately resulting in a 15% decrease in optimal contract utilization compared to fully integrated procurement systems. Additionally, the widespread adoption of a dynamic pricing algorithm by major manufacturers challenges static baseline price capping agreements, leaving purchasing alliances vulnerable to sudden inflationary surcharges that disrupt any customized rebate structure.
  • Managing complex cross-border trade compliance requirements, establishing a reliable dynamic allocation framework, conducting multi-tier supplier auditing, and maintaining robust secondary sourcing channel networks increases internal administrative overhead by up to 18%, significantly diluting the overall efficiency gains promised by centralized buying structures.

Exclusive Technavio Analysis on Customer Landscape

The group purchasing organization service market forecasting report includes the adoption lifecycle of the market, covering from the innovator’s stage to the laggard’s stage. It focuses on adoption rates in different regions based on penetration. Furthermore, the group purchasing organization service market report also includes key purchase criteria and drivers of price sensitivity to help companies evaluate and develop their market growth analysis strategies.
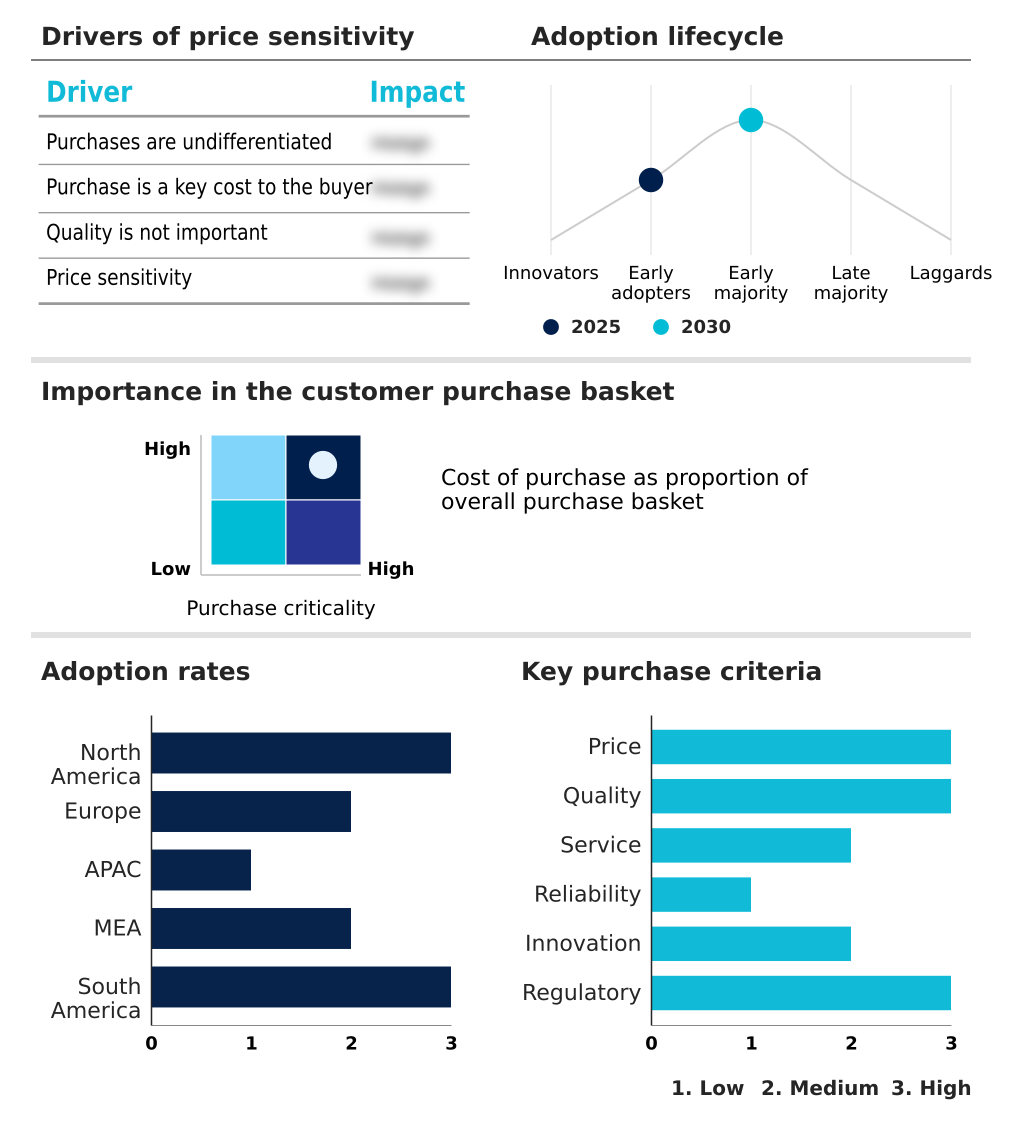
Customer Landscape of Group Purchasing Organization Service Industry

Competitive Landscape

Companies are implementing various strategies, such as strategic alliances, group purchasing organization service market forecast, partnerships, mergers and acquisitions, geographical expansion, and product/service launches, to enhance their presence in the industry.

AMS Sourcing B.V. - The entity delivers comprehensive procurement solutions, emphasizing joint purchasing, commercial buying alliances, and supplier negotiation capabilities to optimize operational costs for retail partners.

The industry research and growth report includes detailed analyses of the competitive landscape of the market and information about key companies, including:

  • AMS Sourcing B.V.
  • Avendra International
  • Buyers Edge Platform
  • Club Procure
  • Corcentric Inc.
  • CoreTrust
  • Entegra Procurement Services
  • Foodbuy USA
  • HealthTrust Purchasing Group
  • Managed Health Care Associates
  • OMNIA Partners
  • Premier Inc.
  • Procure Analytics
  • Prospitalia
  • Resah
  • Sourcewell
  • TIPS
  • UNA
  • Vizient Inc.
  • Yankee Alliance

Qualitative and quantitative analysis of companies has been conducted to help clients understand the wider business environment as well as the strengths and weaknesses of key industry players. Data is qualitatively analyzed to categorize companies as pure play, category-focused, industry-focused, and diversified; it is quantitatively analyzed to categorize companies as dominant, leading, strong, tentative, and weak.

Recent Development and News in Group purchasing organization service market

  • In the Specialized Consumer Services industry, the transition toward digitized procurement platforms has accelerated enterprise workflow integration, directly impacting Group Purchasing Organization Service demand by requiring advanced spend transparency mechanisms.
  • Stringent environmental and governance regulations mandating carbon footprint reporting have compelled corporate networks to adopt certified sourcing protocols, substantially elevating the reliance on the Group Purchasing Organization Service market for compliant supplier networks.
  • Global supply chain chokepoints and raw material shortages have forced commercial enterprises to abandon single-source dependencies, driving the Group Purchasing Organization Service market to establish multi-tiered, resilient fulfillment channels.
  • The increasing adoption of artificial intelligence within commercial enterprise resource planning systems has enabled real-time purchasing analytics, driving institutions toward the Group Purchasing Organization Service market to secure dynamic, index-linked volume pricing.

Dive into Technavio’s robust research methodology, blending expert interviews, extensive data synthesis, and validated models for unparalleled Group Purchasing Organization Service Market insights. See full methodology.

Market Scope
Page number 297
Base year 2025
Historic period 2020-2024
Forecast period 2026-2030
Growth momentum & CAGR Accelerate at a CAGR of 5.6%
Market growth 2026-2030 USD 2315.9 million
Market structure Fragmented
YoY growth 2025-2026(%) 5.5%
Key countries US, Canada, Mexico, Germany, UK, France, Italy, Spain, The Netherlands, China, Japan, India, South Korea, Australia, Indonesia, Saudi Arabia, UAE, South Africa, Israel, Egypt, Brazil, Argentina and Chile
Competitive landscape Leading Companies, Market Positioning of Companies, Competitive Strategies, and Industry Risks

Request Free Sample

Research Analyst Overview

  • The Group Purchasing Organization Service market continues to undergo fundamental structural evolution, transitioning from retrospective expenditure auditing toward predictive, data-driven supply chain orchestration. Institutional executives increasingly implement structured procurement frameworks to execute rigorous contract monitoring and streamline multi-tier supplier evaluation across diverse operational footprints.
  • This transition directly influences boardroom-level compliance strategies, compelling corporate leadership to embed strategic sourcing orchestration and precise predictive demand planning into core enterprise resource planning models. Consequently, organizations shifting to unified, AI-enabled purchasing platforms have recorded a 30% reduction in invoice processing time and administrative friction compared to traditional manual negotiation cycles.
  • Furthermore, the active deployment of automated reconciliation systems allows procurement departments to capture dynamic rebate opportunities and enforce strict pricing controls. By standardizing complex supply taxonomy and establishing highly transparent purchasing governance, centralized buying structures successfully mitigate systemic fulfillment risks and protect operating margins against persistent macroeconomic volatility.

What are the Key Data Covered in this Group Purchasing Organization Service Market Research and Growth Report?

  • What is the expected growth of the Group Purchasing Organization Service Market between 2026 and 2030?

    • USD 2.32 billion, at a CAGR of 5.6%

  • What segmentation does the market report cover?

    • The report is segmented by Type (Vertical GPOs, Horizontal GPOs, and Master purchasing organizations), End-user (Healthcare, Hospitality, Food and beverages, Industrial, and Others), Service Type (Procurement services, and Supplier management) and Geography (North America, Europe, APAC, Middle East and Africa, South America)

  • Which regions are analyzed in the report?

    • North America, Europe, APAC, Middle East and Africa and South America

  • What are the key growth drivers and market challenges?

    • Escalating operational inflation and universal margin pressures, Data fragmentation and incompatible enterprise systems

  • Who are the major players in the Group Purchasing Organization Service Market?

    • AMS Sourcing B.V., Avendra International, Buyers Edge Platform, Club Procure, Corcentric Inc., CoreTrust, Entegra Procurement Services, Foodbuy USA, HealthTrust Purchasing Group, Managed Health Care Associates, OMNIA Partners, Premier Inc., Procure Analytics, Prospitalia, Resah, Sourcewell, TIPS, UNA, Vizient Inc. and Yankee Alliance

Market Research Insights

  • The Group Purchasing Organization Service market operates as a highly strategic mechanism for cost control and operational optimization across diverse commercial domains. By leveraging collaborative structures, institutions systematically coordinate large-scale orders to counter widespread material shortages. Implementing these frameworks allows corporate entities to execute effective supplier negotiation, yielding a 20% improvement in continuous contract compliance.
  • Furthermore, modern digital platform integration and automated spend tracking enhance transaction transparency, driving a 15% reduction in administrative processing bottlenecks. Through optimized procurement workflows and predictive inventory planning, participating organizations significantly lower indirect supply acquisition costs and secure resilient operational foundations in a highly competitive landscape.

We can help! Our analysts can customize this group purchasing organization service market research report to meet your requirements.

Get in touch

1. Executive Summary

1.1 Market overview

Executive Summary - Chart on Market Overview
Executive Summary - Data Table on Market Overview
Executive Summary - Chart on Global Market Characteristics
Executive Summary - Chart on Market by Geography
Executive Summary - Chart on Market Segmentation by Type
Executive Summary - Chart on Market Segmentation by End-user
Executive Summary - Chart on Market Segmentation by Service Type
Executive Summary - Chart on Incremental Growth
Executive Summary - Data Table on Incremental Growth
Executive Summary - Chart on Company Market Positioning

2. Technavio Analysis

2.1 Analysis of price sensitivity, lifecycle, customer purchase basket, adoption rates, and purchase criteria

2.2 Criticality of inputs and Factors of differentiation

Chart on Overview on criticality of inputs and factors of differentiation

2.3 Factors of disruption

Chart on Overview on factors of disruption

2.4 Impact of drivers and challenges

Chart on Impact of drivers and challenges in 2025 and 2030

3. Market Landscape

3.1 Market ecosystem

Chart on Parent Market
Data Table on - Parent Market

3.2 Market characteristics

Chart on Market characteristics analysis

3.3 Value chain analysis

Chart on Value chain analysis

4. Market Sizing

4.1 Market definition

Data Table on Offerings of companies included in the market definition

4.2 Market segment analysis

Market segments

4.3 Market size 2025

4.4 Market outlook: Forecast for 2025-2030

Chart on Global - Market size and forecast 2025-2030 ($ million)
Data Table on Global - Market size and forecast 2025-2030 ($ million)
Chart on Global Market: Year-over-year growth 2025-2030 (%)
Data Table on Global Market: Year-over-year growth 2025-2030 (%)

5. Historic Market Size

5.1 Global Group Purchasing Organization Service Market 2020 - 2024

Historic Market Size - Data Table on Global Group Purchasing Organization Service Market 2020 - 2024 ($ million)

5.2 Type segment analysis 2020 - 2024

Historic Market Size - Type Segment 2020 - 2024 ($ million)

5.3 End-user segment analysis 2020 - 2024

Historic Market Size - End-user Segment 2020 - 2024 ($ million)

5.4 Service Type segment analysis 2020 - 2024

Historic Market Size - Service Type Segment 2020 - 2024 ($ million)

5.5 Geography segment analysis 2020 - 2024

Historic Market Size - Geography Segment 2020 - 2024 ($ million)

5.6 Country segment analysis 2020 - 2024

Historic Market Size - Country Segment 2020 - 2024 ($ million)

6. Qualitative Analysis

6.1 Impact of AI in Global Group Purchasing Organization Service Market

6.2 Impact of Geopolitical Conflicts on Global Group Purchasing Organization Service Market

7. Five Forces Analysis

7.1 Five forces summary

Five forces analysis - Comparison between 2025 and 2030

7.2 Bargaining power of buyers

Bargaining power of buyers - Impact of key factors 2025 and 2030

7.3 Bargaining power of suppliers

Bargaining power of suppliers - Impact of key factors in 2025 and 2030

7.4 Threat of new entrants

Threat of new entrants - Impact of key factors in 2025 and 2030

7.5 Threat of substitutes

Threat of substitutes - Impact of key factors in 2025 and 2030

7.6 Threat of rivalry

Threat of rivalry - Impact of key factors in 2025 and 2030

7.7 Market condition

Chart on Market condition - Five forces 2025 and 2030

8. Market Segmentation by Type

8.1 Market segments

Chart on Type - Market share 2025-2030 (%)
Data Table on Type - Market share 2025-2030 (%)

8.2 Comparison by Type

Chart on Comparison by Type
Data Table on Comparison by Type

8.3 Vertical GPOs - Market size and forecast 2025-2030

Chart on Vertical GPOs - Market size and forecast 2025-2030 ($ million)
Data Table on Vertical GPOs - Market size and forecast 2025-2030 ($ million)
Chart on Vertical GPOs - Year-over-year growth 2025-2030 (%)
Data Table on Vertical GPOs - Year-over-year growth 2025-2030 (%)

8.4 Horizontal GPOs - Market size and forecast 2025-2030

Chart on Horizontal GPOs - Market size and forecast 2025-2030 ($ million)
Data Table on Horizontal GPOs - Market size and forecast 2025-2030 ($ million)
Chart on Horizontal GPOs - Year-over-year growth 2025-2030 (%)
Data Table on Horizontal GPOs - Year-over-year growth 2025-2030 (%)

8.5 Master purchasing organizations - Market size and forecast 2025-2030

Chart on Master purchasing organizations - Market size and forecast 2025-2030 ($ million)
Data Table on Master purchasing organizations - Market size and forecast 2025-2030 ($ million)
Chart on Master purchasing organizations - Year-over-year growth 2025-2030 (%)
Data Table on Master purchasing organizations - Year-over-year growth 2025-2030 (%)

8.6 Market opportunity by Type

Market opportunity by Type ($ million)
Data Table on Market opportunity by Type ($ million)

9. Market Segmentation by End-user

9.1 Market segments

Chart on End-user - Market share 2025-2030 (%)
Data Table on End-user - Market share 2025-2030 (%)

9.2 Comparison by End-user

Chart on Comparison by End-user
Data Table on Comparison by End-user

9.3 Healthcare - Market size and forecast 2025-2030

Chart on Healthcare - Market size and forecast 2025-2030 ($ million)
Data Table on Healthcare - Market size and forecast 2025-2030 ($ million)
Chart on Healthcare - Year-over-year growth 2025-2030 (%)
Data Table on Healthcare - Year-over-year growth 2025-2030 (%)

9.4 Hospitality - Market size and forecast 2025-2030

Chart on Hospitality - Market size and forecast 2025-2030 ($ million)
Data Table on Hospitality - Market size and forecast 2025-2030 ($ million)
Chart on Hospitality - Year-over-year growth 2025-2030 (%)
Data Table on Hospitality - Year-over-year growth 2025-2030 (%)

9.5 Food and beverages - Market size and forecast 2025-2030

Chart on Food and beverages - Market size and forecast 2025-2030 ($ million)
Data Table on Food and beverages - Market size and forecast 2025-2030 ($ million)
Chart on Food and beverages - Year-over-year growth 2025-2030 (%)
Data Table on Food and beverages - Year-over-year growth 2025-2030 (%)

9.6 Industrial - Market size and forecast 2025-2030

Chart on Industrial - Market size and forecast 2025-2030 ($ million)
Data Table on Industrial - Market size and forecast 2025-2030 ($ million)
Chart on Industrial - Year-over-year growth 2025-2030 (%)
Data Table on Industrial - Year-over-year growth 2025-2030 (%)

9.7 Others - Market size and forecast 2025-2030

Chart on Others - Market size and forecast 2025-2030 ($ million)
Data Table on Others - Market size and forecast 2025-2030 ($ million)
Chart on Others - Year-over-year growth 2025-2030 (%)
Data Table on Others - Year-over-year growth 2025-2030 (%)

9.8 Market opportunity by End-user

Market opportunity by End-user ($ million)
Data Table on Market opportunity by End-user ($ million)

10. Market Segmentation by Service Type

10.1 Market segments

Chart on Service Type - Market share 2025-2030 (%)
Data Table on Service Type - Market share 2025-2030 (%)

10.2 Comparison by Service Type

Chart on Comparison by Service Type
Data Table on Comparison by Service Type

10.3 Procurement services - Market size and forecast 2025-2030

Chart on Procurement services - Market size and forecast 2025-2030 ($ million)
Data Table on Procurement services - Market size and forecast 2025-2030 ($ million)
Chart on Procurement services - Year-over-year growth 2025-2030 (%)
Data Table on Procurement services - Year-over-year growth 2025-2030 (%)

10.4 Supplier management - Market size and forecast 2025-2030

Chart on Supplier management - Market size and forecast 2025-2030 ($ million)
Data Table on Supplier management - Market size and forecast 2025-2030 ($ million)
Chart on Supplier management - Year-over-year growth 2025-2030 (%)
Data Table on Supplier management - Year-over-year growth 2025-2030 (%)

10.5 Market opportunity by Service Type

Market opportunity by Service Type ($ million)
Data Table on Market opportunity by Service Type ($ million)

11. Customer Landscape

11.1 Customer landscape overview

Analysis of price sensitivity, lifecycle, customer purchase basket, adoption rates, and purchase criteria

12. Geographic Landscape

12.1 Geographic segmentation

Chart on Market share by geography 2025-2030 (%)
Data Table on Market share by geography 2025-2030 (%)

12.2 Geographic comparison

Chart on Geographic comparison
Data Table on Geographic comparison

12.3 North America - Market size and forecast 2025-2030

Chart on North America - Market size and forecast 2025-2030 ($ million)
Data Table on North America - Market size and forecast 2025-2030 ($ million)
Chart on North America - Year-over-year growth 2025-2030 (%)
Data Table on North America - Year-over-year growth 2025-2030 (%)
Chart on Regional Comparison - North America
Data Table on Regional Comparison - North America

12.3.1 US - Market size and forecast 2025-2030

Chart on US - Market size and forecast 2025-2030 ($ million)
Data Table on US - Market size and forecast 2025-2030 ($ million)
Chart on US - Year-over-year growth 2025-2030 (%)
Data Table on US - Year-over-year growth 2025-2030 (%)

12.3.2 Canada - Market size and forecast 2025-2030

Chart on Canada - Market size and forecast 2025-2030 ($ million)
Data Table on Canada - Market size and forecast 2025-2030 ($ million)
Chart on Canada - Year-over-year growth 2025-2030 (%)
Data Table on Canada - Year-over-year growth 2025-2030 (%)

12.3.3 Mexico - Market size and forecast 2025-2030

Chart on Mexico - Market size and forecast 2025-2030 ($ million)
Data Table on Mexico - Market size and forecast 2025-2030 ($ million)
Chart on Mexico - Year-over-year growth 2025-2030 (%)
Data Table on Mexico - Year-over-year growth 2025-2030 (%)

12.4 Europe - Market size and forecast 2025-2030

Chart on Europe - Market size and forecast 2025-2030 ($ million)
Data Table on Europe - Market size and forecast 2025-2030 ($ million)
Chart on Europe - Year-over-year growth 2025-2030 (%)
Data Table on Europe - Year-over-year growth 2025-2030 (%)
Chart on Regional Comparison - Europe
Data Table on Regional Comparison - Europe

12.4.1 Germany - Market size and forecast 2025-2030

Chart on Germany - Market size and forecast 2025-2030 ($ million)
Data Table on Germany - Market size and forecast 2025-2030 ($ million)
Chart on Germany - Year-over-year growth 2025-2030 (%)
Data Table on Germany - Year-over-year growth 2025-2030 (%)

12.4.2 UK - Market size and forecast 2025-2030

Chart on UK - Market size and forecast 2025-2030 ($ million)
Data Table on UK - Market size and forecast 2025-2030 ($ million)
Chart on UK - Year-over-year growth 2025-2030 (%)
Data Table on UK - Year-over-year growth 2025-2030 (%)

12.4.3 France - Market size and forecast 2025-2030

Chart on France - Market size and forecast 2025-2030 ($ million)
Data Table on France - Market size and forecast 2025-2030 ($ million)
Chart on France - Year-over-year growth 2025-2030 (%)
Data Table on France - Year-over-year growth 2025-2030 (%)

12.4.4 Italy - Market size and forecast 2025-2030

Chart on Italy - Market size and forecast 2025-2030 ($ million)
Data Table on Italy - Market size and forecast 2025-2030 ($ million)
Chart on Italy - Year-over-year growth 2025-2030 (%)
Data Table on Italy - Year-over-year growth 2025-2030 (%)

12.4.5 Spain - Market size and forecast 2025-2030

Chart on Spain - Market size and forecast 2025-2030 ($ million)
Data Table on Spain - Market size and forecast 2025-2030 ($ million)
Chart on Spain - Year-over-year growth 2025-2030 (%)
Data Table on Spain - Year-over-year growth 2025-2030 (%)

12.4.6 The Netherlands - Market size and forecast 2025-2030

Chart on The Netherlands - Market size and forecast 2025-2030 ($ million)
Data Table on The Netherlands - Market size and forecast 2025-2030 ($ million)
Chart on The Netherlands - Year-over-year growth 2025-2030 (%)
Data Table on The Netherlands - Year-over-year growth 2025-2030 (%)

12.5 APAC - Market size and forecast 2025-2030

Chart on APAC - Market size and forecast 2025-2030 ($ million)
Data Table on APAC - Market size and forecast 2025-2030 ($ million)
Chart on APAC - Year-over-year growth 2025-2030 (%)
Data Table on APAC - Year-over-year growth 2025-2030 (%)
Chart on Regional Comparison - APAC
Data Table on Regional Comparison - APAC

12.5.1 China - Market size and forecast 2025-2030

Chart on China - Market size and forecast 2025-2030 ($ million)
Data Table on China - Market size and forecast 2025-2030 ($ million)
Chart on China - Year-over-year growth 2025-2030 (%)
Data Table on China - Year-over-year growth 2025-2030 (%)

12.5.2 Japan - Market size and forecast 2025-2030

Chart on Japan - Market size and forecast 2025-2030 ($ million)
Data Table on Japan - Market size and forecast 2025-2030 ($ million)
Chart on Japan - Year-over-year growth 2025-2030 (%)
Data Table on Japan - Year-over-year growth 2025-2030 (%)

12.5.3 India - Market size and forecast 2025-2030

Chart on India - Market size and forecast 2025-2030 ($ million)
Data Table on India - Market size and forecast 2025-2030 ($ million)
Chart on India - Year-over-year growth 2025-2030 (%)
Data Table on India - Year-over-year growth 2025-2030 (%)

12.5.4 South Korea - Market size and forecast 2025-2030

Chart on South Korea - Market size and forecast 2025-2030 ($ million)
Data Table on South Korea - Market size and forecast 2025-2030 ($ million)
Chart on South Korea - Year-over-year growth 2025-2030 (%)
Data Table on South Korea - Year-over-year growth 2025-2030 (%)

12.5.5 Australia - Market size and forecast 2025-2030

Chart on Australia - Market size and forecast 2025-2030 ($ million)
Data Table on Australia - Market size and forecast 2025-2030 ($ million)
Chart on Australia - Year-over-year growth 2025-2030 (%)
Data Table on Australia - Year-over-year growth 2025-2030 (%)

12.5.6 Indonesia - Market size and forecast 2025-2030

Chart on Indonesia - Market size and forecast 2025-2030 ($ million)
Data Table on Indonesia - Market size and forecast 2025-2030 ($ million)
Chart on Indonesia - Year-over-year growth 2025-2030 (%)
Data Table on Indonesia - Year-over-year growth 2025-2030 (%)

12.6 Middle East and Africa - Market size and forecast 2025-2030

Chart on Middle East and Africa - Market size and forecast 2025-2030 ($ million)
Data Table on Middle East and Africa - Market size and forecast 2025-2030 ($ million)
Chart on Middle East and Africa - Year-over-year growth 2025-2030 (%)
Data Table on Middle East and Africa - Year-over-year growth 2025-2030 (%)
Chart on Regional Comparison - Middle East and Africa
Data Table on Regional Comparison - Middle East and Africa

12.6.1 Saudi Arabia - Market size and forecast 2025-2030

Chart on Saudi Arabia - Market size and forecast 2025-2030 ($ million)
Data Table on Saudi Arabia - Market size and forecast 2025-2030 ($ million)
Chart on Saudi Arabia - Year-over-year growth 2025-2030 (%)
Data Table on Saudi Arabia - Year-over-year growth 2025-2030 (%)

12.6.2 UAE - Market size and forecast 2025-2030

Chart on UAE - Market size and forecast 2025-2030 ($ million)
Data Table on UAE - Market size and forecast 2025-2030 ($ million)
Chart on UAE - Year-over-year growth 2025-2030 (%)
Data Table on UAE - Year-over-year growth 2025-2030 (%)

12.6.3 South Africa - Market size and forecast 2025-2030

Chart on South Africa - Market size and forecast 2025-2030 ($ million)
Data Table on South Africa - Market size and forecast 2025-2030 ($ million)
Chart on South Africa - Year-over-year growth 2025-2030 (%)
Data Table on South Africa - Year-over-year growth 2025-2030 (%)

12.6.4 Israel - Market size and forecast 2025-2030

Chart on Israel - Market size and forecast 2025-2030 ($ million)
Data Table on Israel - Market size and forecast 2025-2030 ($ million)
Chart on Israel - Year-over-year growth 2025-2030 (%)
Data Table on Israel - Year-over-year growth 2025-2030 (%)

12.6.5 Egypt - Market size and forecast 2025-2030

Chart on Egypt - Market size and forecast 2025-2030 ($ million)
Data Table on Egypt - Market size and forecast 2025-2030 ($ million)
Chart on Egypt - Year-over-year growth 2025-2030 (%)
Data Table on Egypt - Year-over-year growth 2025-2030 (%)

12.7 South America - Market size and forecast 2025-2030

Chart on South America - Market size and forecast 2025-2030 ($ million)
Data Table on South America - Market size and forecast 2025-2030 ($ million)
Chart on South America - Year-over-year growth 2025-2030 (%)
Data Table on South America - Year-over-year growth 2025-2030 (%)
Chart on Regional Comparison - South America
Data Table on Regional Comparison - South America

12.7.1 Brazil - Market size and forecast 2025-2030

Chart on Brazil - Market size and forecast 2025-2030 ($ million)
Data Table on Brazil - Market size and forecast 2025-2030 ($ million)
Chart on Brazil - Year-over-year growth 2025-2030 (%)
Data Table on Brazil - Year-over-year growth 2025-2030 (%)

12.7.2 Argentina - Market size and forecast 2025-2030

Chart on Argentina - Market size and forecast 2025-2030 ($ million)
Data Table on Argentina - Market size and forecast 2025-2030 ($ million)
Chart on Argentina - Year-over-year growth 2025-2030 (%)
Data Table on Argentina - Year-over-year growth 2025-2030 (%)

12.7.3 Chile - Market size and forecast 2025-2030

Chart on Chile - Market size and forecast 2025-2030 ($ million)
Data Table on Chile - Market size and forecast 2025-2030 ($ million)
Chart on Chile - Year-over-year growth 2025-2030 (%)
Data Table on Chile - Year-over-year growth 2025-2030 (%)

12.8 Market opportunity by geography

Market opportunity by geography ($ million)
Data Tables on Market opportunity by geography ($ million)

13. Drivers, Challenges, and Opportunity

13.1 Market drivers

Escalating operational inflation and universal margin pressures
Adoption of digital procurement technologies
Rising need for supply chain resilience and diversified networks

13.2 Market challenges

Data fragmentation and incompatible enterprise systems
Company disintermediation and supplier dynamic pricing protocols
Regulatory compliance complexity and anti-kickback oversight mechanisms

13.3 Impact of drivers and challenges

Impact of drivers and challenges in 2025 and 2030

13.4 Market opportunities

Integration of AI and predictive machine learning models
Expansion of non-traditional commercial verticals and horizontal procurement domains
Transition toward sustainable procurement frameworks

14. Competitive Landscape

14.1 Overview

14.2

Overview on criticality of inputs and factors of differentiation

14.3 Landscape disruption

Overview on factors of disruption

14.4 Industry risks

Impact of key risks on business

15. Competitive Analysis

15.1 Companies profiled

Companies covered

15.2 Company ranking index

15.3 Market positioning of companies

Matrix on companies position and classification

15.4 AMS Sourcing B.V.

AMS Sourcing B.V. - Overview
AMS Sourcing B.V. - Product / Service
AMS Sourcing B.V. - Key offerings
SWOT

15.5 Avendra International

Avendra International - Overview
Avendra International - Product / Service
Avendra International - Key offerings
SWOT

15.6 Buyers Edge Platform

Buyers Edge Platform - Overview
Buyers Edge Platform - Product / Service
Buyers Edge Platform - Key offerings
SWOT

15.7 Club Procure

Club Procure - Overview
Club Procure - Product / Service
Club Procure - Key offerings
SWOT

15.8 Corcentric Inc.

Corcentric Inc. - Overview
Corcentric Inc. - Product / Service
Corcentric Inc. - Key offerings
SWOT

15.9 CoreTrust

CoreTrust - Overview
CoreTrust - Product / Service
CoreTrust - Key offerings
SWOT

15.10 Entegra Procurement Services

Entegra Procurement Services - Overview
Entegra Procurement Services - Product / Service
Entegra Procurement Services - Key offerings
SWOT

15.11 Foodbuy USA

Foodbuy USA - Overview
Foodbuy USA - Product / Service
Foodbuy USA - Key offerings
SWOT

15.12 HealthTrust Purchasing Group

HealthTrust Purchasing Group - Overview
HealthTrust Purchasing Group - Product / Service
HealthTrust Purchasing Group - Key offerings
SWOT

15.13 Managed Health Care Associates

Managed Health Care Associates - Overview
Managed Health Care Associates - Product / Service
Managed Health Care Associates - Key offerings
SWOT

15.14 OMNIA Partners

OMNIA Partners - Overview
OMNIA Partners - Product / Service
OMNIA Partners - Key offerings
SWOT

15.15 Premier Inc.

Premier Inc. - Overview
Premier Inc. - Product / Service
Premier Inc. - Key offerings
SWOT

15.16 Resah

Resah - Overview
Resah - Product / Service
Resah - Key offerings
SWOT

15.17 Sourcewell

Sourcewell - Overview
Sourcewell - Product / Service
Sourcewell - Key offerings
SWOT

15.18 TIPS

TIPS - Overview
TIPS - Product / Service
TIPS - Key offerings
SWOT

16. Appendix

16.1 Scope of the report

Market definition
Objectives
Notes and caveats

16.2 Inclusions and exclusions checklist

Inclusions checklist
Exclusions checklist

16.3 Currency conversion rates for US$

16.4 Research methodology

16.5 Data procurement

Information sources

16.6 Data validation

16.7 Validation techniques employed for market sizing

16.8 Data synthesis

16.9 360 degree market analysis

16.10 List of abbreviations

Research Methodology

Technavio presents a detailed picture of the market by way of study, synthesis, and summation of data from multiple sources. The analysts have presented the various facets of the market with a particular focus on identifying the key industry influencers. The data thus presented is comprehensive, reliable, and the result of extensive research, both primary and secondary.

INFORMATION SOURCES

Primary sources

  • Manufacturers and suppliers
  • Channel partners
  • Industry experts
  • Strategic decision makers

Secondary sources

  • Industry journals and periodicals
  • Government data
  • Financial reports of key industry players
  • Historical data
  • Press releases

DATA ANALYSIS

Data Synthesis

  • Collation of data
  • Estimation of key figures
  • Analysis of derived insights

Data Validation

  • Triangulation with data models
  • Reference against proprietary databases
  • Corroboration with industry experts

REPORT WRITING

Qualitative

  • Market drivers
  • Market challenges
  • Market trends
  • Five forces analysis

Quantitative

  • Market size and forecast
  • Market segmentation
  • Geographical insights
  • Competitive landscape

Interested in this report?

Get your sample now to see our research methodology and insights!

Download Now

Frequently Asked Questions

Group Purchasing Organization Service market growth will increase by USD 2315.9 million during 2026-2030.

The Group Purchasing Organization Service market is expected to grow at a CAGR of 5.6% during 2026-2030.

Group Purchasing Organization Service market is segmented by Type (Vertical GPOs, Horizontal GPOs, Master purchasing organizations) End-user (Healthcare, Hospitality, Food and beverages, Industrial, Others) Service type (Procurement services, Supplier management)

AMS Sourcing B.V., Avendra International, Buyers Edge Platform, Club Procure, Corcentric Inc., CoreTrust, Entegra Procurement Services, Foodbuy USA, HealthTrust Purchasing Group, Managed Health Care Associates, OMNIA Partners, Premier Inc., Procure Analytics, Prospitalia, Resah, Sourcewell, TIPS, UNA, Vizient Inc., Yankee Alliance are a few of the key vendors in the Group Purchasing Organization Service market.

North America will register the highest growth rate of 42.7% among the other regions. Therefore, the Group Purchasing Organization Service market in North America is expected to garner significant business opportunities for the vendors during the forecast period.

US, Canada, Mexico, Germany, UK, France, Italy, Spain, The Netherlands, China, Japan, India, South Korea, Australia, Indonesia, Saudi Arabia, UAE, South Africa, Israel, Egypt, Brazil, Argentina, Chile

  • Escalating operational inflation and universal margin pressures is the driving factor this market.

The Group Purchasing Organization Service market vendors should focus on grabbing business opportunities from the Type segment as it accounted for the largest market share in the base year.
RIA - Research AI Assistant
Ask RIA
