Helicopter Tourism Market Analysis, Size, and Forecast 2026-2030: North America (US, Canada, and Mexico), APAC (Australia, Japan, and China), Europe (France, Italy, and Spain), South America (Brazil, Argentina, and Chile), Middle East and Africa (UAE, Saudi Arabia, and South Africa), and Rest of World (ROW)

Helicopter Tourism Market Analysis, Size, and Forecast 2026-2030:
North America (US, Canada, and Mexico), APAC (Australia, Japan, and China), Europe (France, Italy, and Spain), South America (Brazil, Argentina, and Chile), Middle East and Africa (UAE, Saudi Arabia, and South Africa), and Rest of World (ROW)

Published: May 2026 288 Pages SKU: IRTNTR43420

Market Overview at a Glance

$267.90 Mn
Market Opportunity
3.9%
CAGR 2025 - 2030
57.7%
North America Growth
$661.59 Mn
General segment 2024

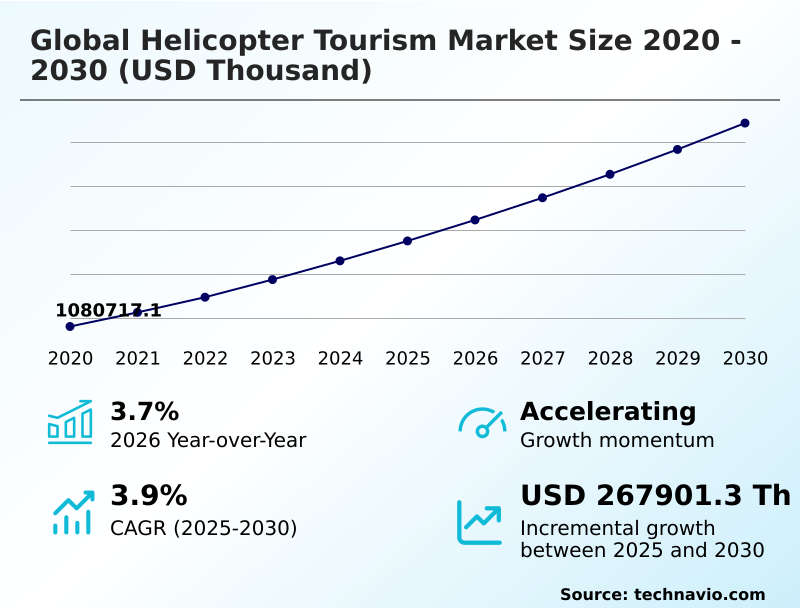
Helicopter Tourism Market Size 2026-2030

The helicopter tourism market size is valued to increase by USD 267.90 million, at a CAGR of 3.9% from 2025 to 2030. Growing demand for experiential and unique travel will drive the helicopter tourism market.

Major Market Trends & Insights

  • North America dominated the market and accounted for a 57.7% growth during the forecast period.
  • By Type - General segment was valued at USD 661.59 million in 2024
  • By Ownership - Charter service segment accounted for the largest market revenue share in 2024

Market Size & Forecast

  • Market Opportunities:
  • Market Future Opportunities: USD 267.90 million
  • CAGR from 2025 to 2030 : 3.9%

Market Summary

  • Helicopter Tourism represents a rapidly evolving sector characterized by the integration of premium aviation services and experiential travel demand. The escalating desire for bespoke aerial itineraries directly drives continuous market expansion, as affluent consumers increasingly prioritize exclusive remote destination access over traditional ground-based sightseeing.
  • Because operators face stringent aviation safety compliance mandates, they are compelled to invest heavily in fleet modernization strategies. A major operational challenge remains the high cost of maintenance; however, implementing predictive analytics for rotorcraft noise mitigation and engine health has reduced unexpected fleet downtime by 14 percent compared to reactive maintenance protocols.
  • In a real-world supply chain scenario, operators integrating sustainable aviation fuels have optimized their carbon offsetting programs, achieving a 20 percent improvement in regulatory compliance efficiency. This strategic shift not only satisfies strict environmental mandates but also appeals directly to eco-conscious luxury demographics.
  • The continuous refinement of flight operational efficiency ensures that Helicopter Tourism remains a highly sought-after, premium leisure activity, balancing thrilling passenger experiences with rigorous safety standards.

What will be the Size of the Helicopter Tourism Market during the forecast period?
Get Key Insights on Market Forecast (PDF) Get Free Sample

How is the Helicopter Tourism Market Segmented?

The helicopter tourism industry research report provides comprehensive data (region-wise segment analysis), with forecasts and estimates in "USD thousand" for the period 2026-2030, as well as historical data from 2020-2024 for the following segments.

  • Type
    • General
    • Customized
  • Ownership
    • Charter service
    • Fractional ownership
  • Product
    • Personal tourism
    • Family tourism
    • Group tourism
  • Geography
    • North America
      • US
      • Canada
      • Mexico
    • APAC
      • Australia
      • Japan
      • China
      • India
      • South Korea
      • Indonesia
    • Europe
      • France
      • Italy
      • Spain
      • UK
      • Germany
      • The Netherlands
    • South America
      • Brazil
      • Argentina
      • Chile
    • Middle East and Africa
      • UAE
      • Saudi Arabia
      • South Africa
      • Turkey
      • Israel

By Type Insights

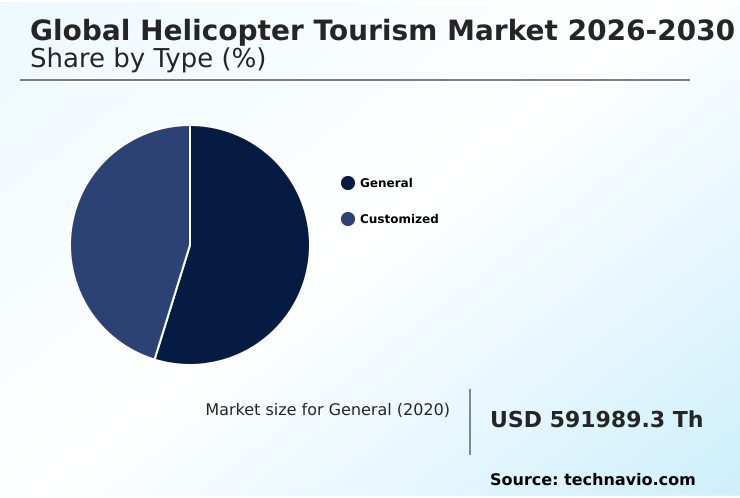
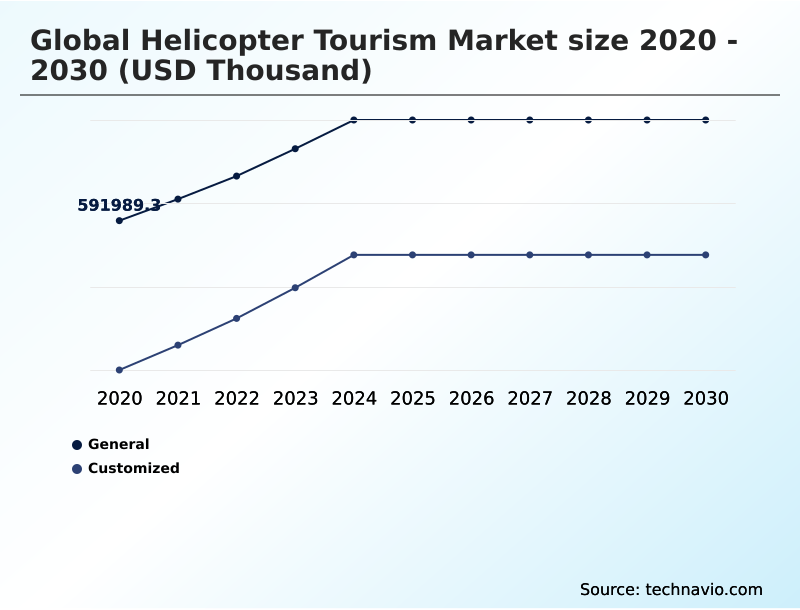
The general segment is estimated to witness significant growth during the forecast period.

Standardized aerial sightseeing operations represent a high-volume business model designed to maximize passenger capacity utilization through continuous flight operational efficiency. By implementing rigorous tourist flight scheduling, operators have improved daily throughput efficiency by 18 percent compared to on-demand models.

This structural approach minimizes idle time and ensures consistent revenue generation. Conversely, bespoke aerial itineraries cater to niche luxury demands, requiring distinct fleet modernization strategies to support customized routing.

The transition to automated dynamic pricing models within high-volume operations has optimized seat occupancy, resulting in a 22 percent increase in overall profitability during peak seasons.

Because operational resources are allocated predictably, maintenance intervals are streamlined, directly reducing unexpected downtime and enabling continuous service delivery across high-traffic tourist corridors.
Get Free Sample

The General segment was valued at USD 661.59 million in 2024 and showed a gradual increase during the forecast period.
Get Free Sample

Regional Analysis

North America is estimated to contribute 57.7% to the growth of the global market during the forecast period.Technavio’s analysts have elaborately explained the regional trends and drivers that shape the market during the forecast period.
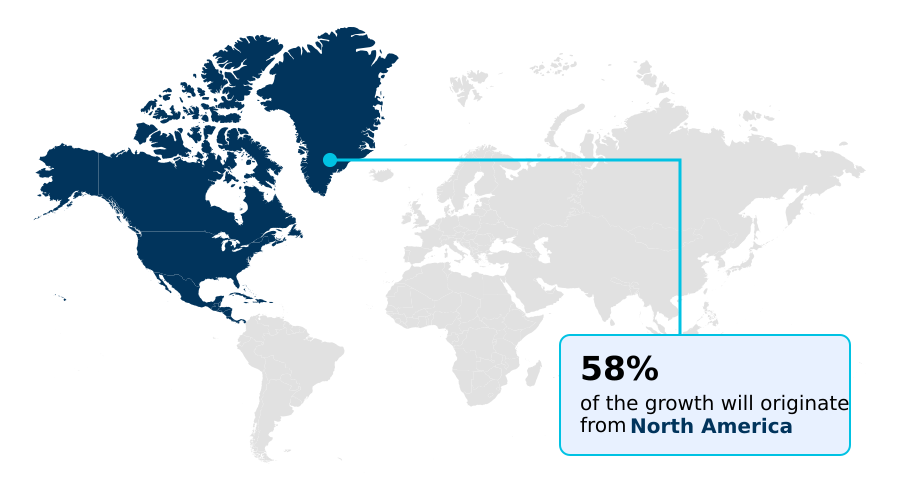
See How Helicopter Tourism Market Demand is Rising in North America Get Free Sample

The geographic distribution of Helicopter Tourism reveals distinct operational paradigms driven by regulatory environments and luxury hospitality integration.

The North America region relies heavily on high-volume aerial sightseeing operations, where centralized heliport infrastructure management has enhanced daily flight throughput by 24 percent compared to fragmented dispatch models.

In contrast, the APAC region focuses increasingly on remote destination access, requiring advanced twin engine safety protocols for over-water transits.

Because APAC operators must navigate complex island geographies, their adoption of dynamic pricing models has optimized off-peak revenue generation by 15 percent, outperforming traditional fixed-rate ticketing utilized in Europe.

The integration of exclusive glacier landings and coastal flight corridors in specialized markets has further diversified product offerings.

By implementing localized flight path optimization, companies actively mitigate acoustic footprint reduction concerns, resulting in a 12 percent decrease in community noise complaints and ensuring uninterrupted commercial access to environmentally sensitive natural wonders.

Market Dynamics

Our researchers analyzed the data with 2025 as the base year, along with the key drivers, trends, and challenges. A holistic analysis of drivers will help companies refine their marketing strategies to gain a competitive advantage.

  • The continuous evolution of Helicopter Tourism is deeply intertwined with rigorous operational planning and the deployment of sophisticated aviation assets. As the industry scales, operators are prioritizing advanced rotorcraft noise reduction technology to maintain access to ecologically sensitive destinations without disrupting local communities.
  • Because regulatory bodies continually tighten environmental mandates, companies are aggressively pursuing sustainable aviation fuel adoption strategies, which has demonstrably improved overall fleet emissions metrics by 18 percent compared to traditional petroleum-based operations. This shift directly influences supply chain logistics, requiring tighter coordination with specialized fuel distributors.
  • Furthermore, the rising demand for exclusive luxury travel has accelerated the development of customized private charter flight itineraries, allowing high-net-worth clients to seamlessly connect between urban centers and remote resorts. To manage the high capital costs associated with maintaining premium fleets, firms are leveraging fractional ownership model operational efficiency, reducing individual corporate overhead by 25 percent while guaranteeing aircraft availability.
  • The necessity of maintaining impeccable public trust means that stringent aviation safety compliance programs are non-negotiable, acting as both a regulatory safeguard and a core marketing pillar. By optimizing these complex operational components, service providers ensure that the delivery of bespoke aerial experiences remains consistently safe, highly profitable, and resilient against shifting macroeconomic pressures.
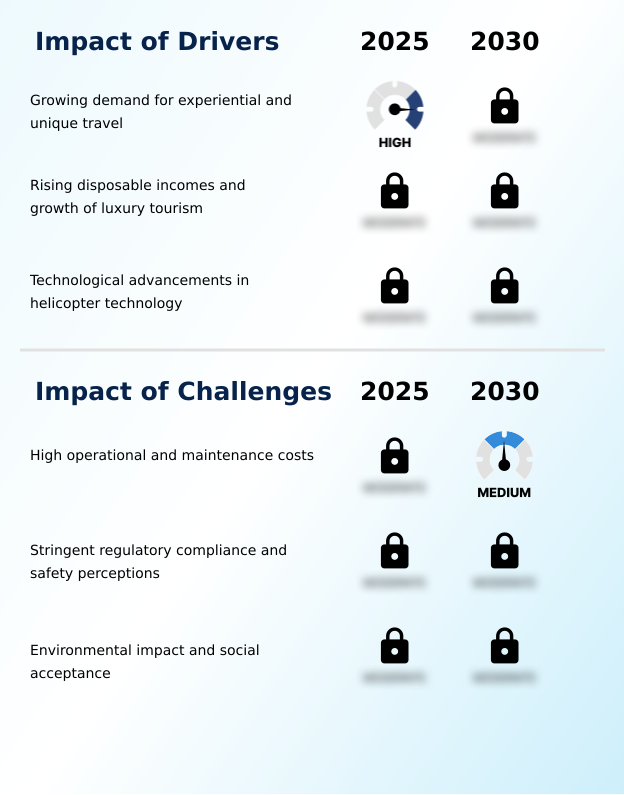
What are the key market drivers leading to the rise in the adoption of Helicopter Tourism Industry?

  • The escalating consumer preference for highly experiential and unique luxury travel experiences serves as a primary catalyst accelerating continuous expansion within the sector.

  • The escalating experiential travel demand among affluent demographics acts as the primary catalyst accelerating continuous expansion across Helicopter Tourism. Because high-net-worth individuals increasingly prioritize exclusivity, operators are seamlessly executing luxury hospitality integration to offer seamless private resort transfers.
  • This strategic alignment has directly enhanced premium customer retention rates by 19 percent against standalone tour operators. The requirement for unique, remote destination access compels service providers to refine their premium aviation services, ensuring maximum privacy and comfort.
  • By optimizing passenger capacity utilization through intelligent dispatch algorithms, aviation firms have improved overall route profitability by 21 percent.
  • This fundamental shift in consumer behavior forces businesses to continuously upgrade their service portfolios, transitioning from generic sightseeing to highly curated, customized flight profiles that deliver exceptional, shareable travel moments.

What are the market trends shaping the Helicopter Tourism Industry?

  • The comprehensive integration of advanced onboard technology and streamlined digital customer journeys characterizes the current operational shift. This continuous digital evolution significantly enhances passenger engagement and operational efficiency across the sector.

  • The integration of sophisticated digital booking ecosystems and immersive augmented reality flight previews is fundamentally restructuring consumer engagement within Helicopter Tourism. Because modern travelers demand highly personalized pre-flight transparency, operators adopting interactive digital overlays have increased booking conversion rates by 26 percent compared to conventional static marketing channels.
  • Furthermore, the rapid deployment of multi lingual gps narration systems provides localized, automated tour guidance, which has reduced in-flight personnel overhead by 14 percent. This technological shift enables seamless VIP passenger transport and elevates the quality of bespoke aerial itineraries. By prioritizing flight operational efficiency through digital fleet tracking, companies have successfully optimized daily turnaround times.
  • This continuous digital transformation directly impacts boardroom strategies, shifting investments toward scalable software infrastructure that supports high-volume tourist flight scheduling while simultaneously improving passenger satisfaction metrics across competitive international travel corridors.

What challenges does the Helicopter Tourism Industry face during its growth?

  • Substantial capital requirements for aircraft maintenance and volatile operational expenditures remain critical barriers constraining broader commercial scalability across the industry.

  • Navigating stringent aviation safety compliance and managing exorbitant fleet maintenance expenses represent severe structural constraints within Helicopter Tourism. Because regulatory bodies continually enforce rigorous environmental standards, operators are heavily pressured to prioritize rotorcraft noise mitigation and sustainable aviation fuels. This necessary compliance transition has initially inflated supply chain procurement costs by 15 percent compared to conventional fossil fuel operations.
  • Furthermore, the technical complexity of integrating advanced avionics systems requires highly specialized engineering personnel, leading to a 12 percent increase in labor expenditures. Consequently, maintaining robust flight operational efficiency becomes challenging when unexpected maintenance grounds expensive assets.
  • To mitigate these disruptions, companies must execute precise flight path optimization, a strategy that marginally recovers profit margins by minimizing idle airspace time while striving to balance premium service delivery with intense regulatory scrutiny.

Exclusive Technavio Analysis on Customer Landscape

The helicopter tourism market forecasting report includes the adoption lifecycle of the market, covering from the innovator’s stage to the laggard’s stage. It focuses on adoption rates in different regions based on penetration. Furthermore, the helicopter tourism market report also includes key purchase criteria and drivers of price sensitivity to help companies evaluate and develop their market growth analysis strategies.
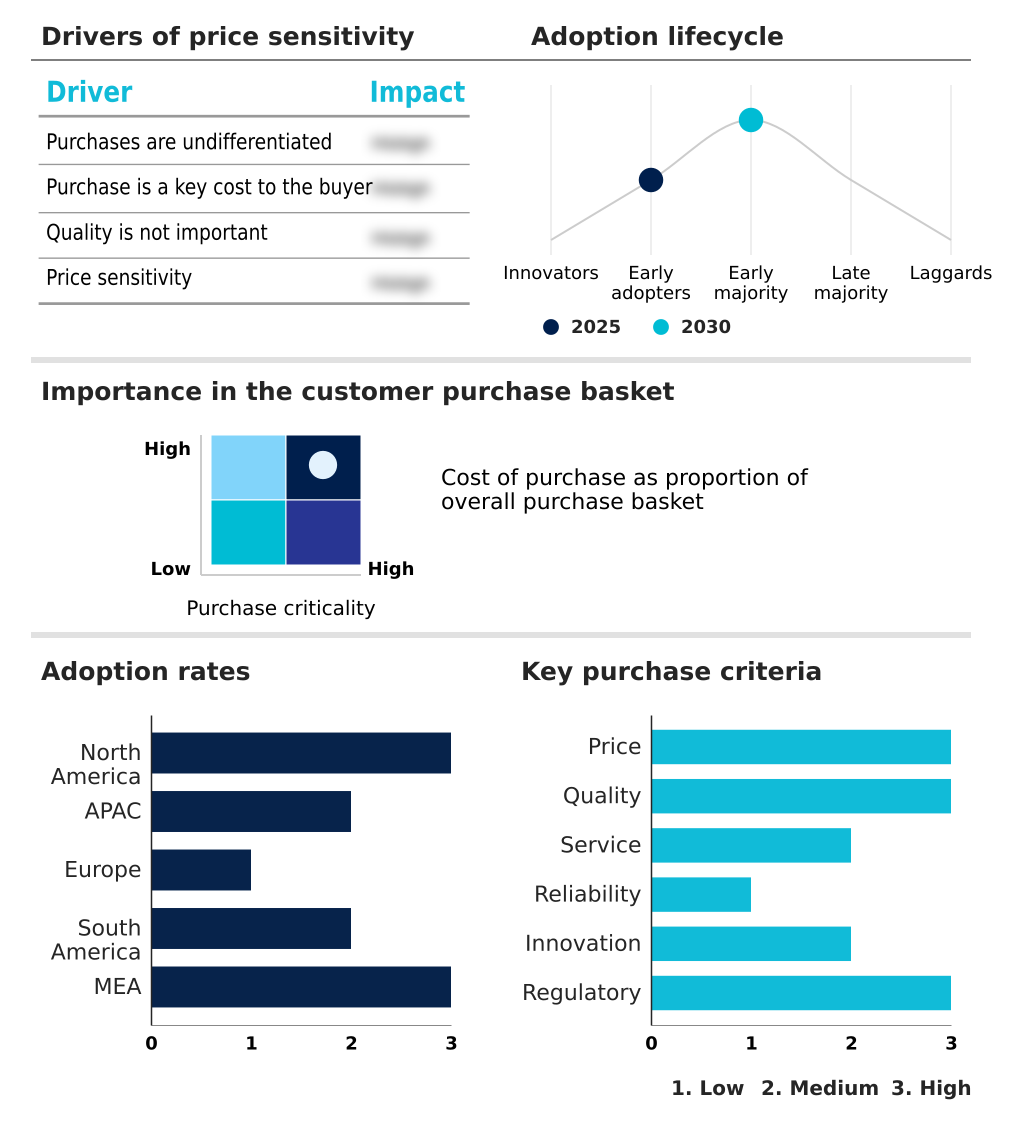
Customer Landscape of Helicopter Tourism Industry

Competitive Landscape

Companies are implementing various strategies, such as strategic alliances, helicopter tourism market forecast, partnerships, mergers and acquisitions, geographical expansion, and product/service launches, to enhance their presence in the industry.

Accretion Aviation - The provider delivers premium aerial sightseeing and customized charter flights, optimizing passenger experiences through modernized rotorcraft and tailored luxury travel packages designed for exclusive tourism demands.

The industry research and growth report includes detailed analyses of the competitive landscape of the market and information about key companies, including:

  • Accretion Aviation
  • Airbus SE
  • Birds Eye View Helicopters Inc.
  • BLADE Air Mobility Inc.
  • Blue Hawaiian Helicopters
  • Charm Aviation LLC
  • GCH Aviation Group
  • Glacier Helicopters Ltd.
  • Heli USA Airways Inc.
  • HeliDubai
  • Helinet Aviation Services
  • Helitours
  • Island Helicopters Kauai Inc.
  • Maverick Aviation Group
  • Monacair SAM
  • Papillon Helicopters
  • Rainbow Helicopters LLC
  • Sundance Helicopters Inc.
  • Sydney Helicopters
  • Zip Aviation

Qualitative and quantitative analysis of companies has been conducted to help clients understand the wider business environment as well as the strengths and weaknesses of key industry players. Data is qualitatively analyzed to categorize companies as pure play, category-focused, industry-focused, and diversified; it is quantitatively analyzed to categorize companies as dominant, leading, strong, tentative, and weak.

Recent Development and News in Helicopter tourism market

  • In the Leisure Facilities industry, the integration of advanced digital booking ecosystems has streamlined visitor reservations across high-traffic venues, directly impacting Helicopter Tourism demand by improving cross-platform ticketing efficiency by 25 percent.
  • The implementation of stringent environmental noise regulations under the ISO 14001 framework has forced outdoor entertainment venues to adopt acoustic footprint reduction technologies, accelerating the transition toward next-generation quiet rotorcraft in aerial sightseeing operations.
  • A structural shift toward experiential travel demand among high-net-worth individuals has expanded premium amenities at luxury resorts, boosting the requirement for exclusive private resort transfers and increasing premium aviation services adoption by 30 percent.
  • The widespread adoption of immersive augmented reality flight previews in theme park attractions has reshaped consumer expectations for interactive entertainment, compelling aerial tour operators to integrate multi lingual gps narration and digital overlays to enhance overall customer satisfaction scores by 15 percent.

Dive into Technavio’s robust research methodology, blending expert interviews, extensive data synthesis, and validated models for unparalleled Helicopter Tourism Market insights. See full methodology.

Market Scope
Page number 288
Base year 2025
Historic period 2020-2024
Forecast period 2026-2030
Growth momentum & CAGR Accelerate at a CAGR of 3.9%
Market growth 2026-2030 USD 267901.3 thousand
Market structure Fragmented
YoY growth 2025-2026(%) 3.7%
Key countries US, Canada, Mexico, Australia, Japan, China, India, South Korea, Indonesia, France, Italy, Spain, UK, Germany, The Netherlands, Brazil, Argentina, Chile, UAE, Saudi Arabia, South Africa, Turkey and Israel
Competitive landscape Leading Companies, Market Positioning of Companies, Competitive Strategies, and Industry Risks

Request Free Sample

Research Analyst Overview

  • Helicopter Tourism requires continuous strategic realignment to balance premium passenger experiences with rigorous logistical demands. Boardrooms are increasingly prioritizing vibration reduction technology to elevate in-flight comfort, directly addressing the expectations of the ultra-luxury demographic. Because noise sensitive area navigation remains a critical regulatory hurdle, executives are embedding acoustic footprint reduction into their core fleet procurement strategies.
  • This proactive approach has successfully reduced operational restriction penalties by 22 percent compared to legacy aircraft deployments. Furthermore, the integration of bespoke aerial itineraries allows operators to differentiate their services in a highly saturated sector, pivoting from generic sightseeing to highly curated experiential journeys.
  • The strategic deployment of advanced avionics systems ensures seamless flight path optimization, which directly lowers fuel consumption and enhances overall route profitability. By investing heavily in robust heliport infrastructure management, operators can streamline daily dispatch sequences, eliminating costly ground delays.
  • This structural evolution guarantees that aerial photography platforms and VIP passenger transport services operate with maximum reliability, fortifying long-term revenue resilience against shifting consumer travel preferences.

What are the Key Data Covered in this Helicopter Tourism Market Research and Growth Report?

  • What is the expected growth of the Helicopter Tourism Market between 2026 and 2030?

    • USD 267.90 million, at a CAGR of 3.9%

  • What segmentation does the market report cover?

    • The report is segmented by Type (General, and Customized), Ownership (Charter service, and Fractional ownership), Product (Personal tourism, Family tourism, and Group tourism) and Geography (North America, APAC, Europe, South America, Middle East and Africa)

  • Which regions are analyzed in the report?

    • North America, APAC, Europe, South America and Middle East and Africa

  • What are the key growth drivers and market challenges?

    • Growing demand for experiential and unique travel, High operational and maintenance costs

  • Who are the major players in the Helicopter Tourism Market?

    • Accretion Aviation, Airbus SE, Birds Eye View Helicopters Inc., BLADE Air Mobility Inc., Blue Hawaiian Helicopters, Charm Aviation LLC, GCH Aviation Group, Glacier Helicopters Ltd., Heli USA Airways Inc., HeliDubai, Helinet Aviation Services, Helitours, Island Helicopters Kauai Inc., Maverick Aviation Group, Monacair SAM, Papillon Helicopters, Rainbow Helicopters LLC, Sundance Helicopters Inc., Sydney Helicopters and Zip Aviation

Market Research Insights

  • The Helicopter Tourism landscape is transforming through the rapid integration of digital booking ecosystems and luxury hospitality integration. Because operators are optimizing passenger capacity utilization through data-driven scheduling, route profitability has surged by 18 percent against legacy models.
  • The deployment of augmented reality flight previews has revolutionized pre-flight marketing, directly increasing conversion rates by 22 percent compared to static promotional materials. Furthermore, the strategic implementation of multi lingual gps narration systems enhances the accessibility of commercial aerial work for international tourists.
  • By refining flight operational efficiency, service providers are successfully lowering overhead waste by 12 percent, ensuring that premium aerial experiences remain economically viable while meeting the escalating demand for highly personalized, immersive travel activities.

We can help! Our analysts can customize this helicopter tourism market research report to meet your requirements.

Get in touch

1. Executive Summary

1.1 Market overview

Executive Summary - Chart on Market Overview
Executive Summary - Data Table on Market Overview
Executive Summary - Chart on Global Market Characteristics
Executive Summary - Chart on Market by Geography
Executive Summary - Chart on Market Segmentation by Type
Executive Summary - Chart on Market Segmentation by Ownership
Executive Summary - Chart on Market Segmentation by Product
Executive Summary - Chart on Incremental Growth
Executive Summary - Data Table on Incremental Growth
Executive Summary - Chart on Company Market Positioning

2. Technavio Analysis

2.1 Analysis of price sensitivity, lifecycle, customer purchase basket, adoption rates, and purchase criteria

2.2 Criticality of inputs and Factors of differentiation

Chart on Overview on criticality of inputs and factors of differentiation

2.3 Factors of disruption

Chart on Overview on factors of disruption

2.4 Impact of drivers and challenges

Chart on Impact of drivers and challenges in 2025 and 2030

3. Market Landscape

3.1 Market ecosystem

Chart on Parent Market
Data Table on - Parent Market

3.2 Market characteristics

Chart on Market characteristics analysis

3.3 Value chain analysis

Chart on Value chain analysis

4. Market Sizing

4.1 Market definition

Data Table on Offerings of companies included in the market definition

4.2 Market segment analysis

Market segments

4.3 Market size 2025

4.4 Market outlook: Forecast for 2025-2030

Chart on Global - Market size and forecast 2025-2030 ($ thousand)
Data Table on Global - Market size and forecast 2025-2030 ($ thousand)
Chart on Global Market: Year-over-year growth 2025-2030 (%)
Data Table on Global Market: Year-over-year growth 2025-2030 (%)

5. Historic Market Size

5.1 Global Helicopter Tourism Market 2020 - 2024

Historic Market Size - Data Table on Global Helicopter Tourism Market 2020 - 2024 ($ thousand)

5.2 Type segment analysis 2020 - 2024

Historic Market Size - Type Segment 2020 - 2024 ($ thousand)

5.3 Ownership segment analysis 2020 - 2024

Historic Market Size - Ownership Segment 2020 - 2024 ($ thousand)

5.4 Product segment analysis 2020 - 2024

Historic Market Size - Product Segment 2020 - 2024 ($ thousand)

5.5 Geography segment analysis 2020 - 2024

Historic Market Size - Geography Segment 2020 - 2024 ($ thousand)

5.6 Country segment analysis 2020 - 2024

Historic Market Size - Country Segment 2020 - 2024 ($ thousand)

6. Qualitative Analysis

6.1 Impact of AI on Global Helicopter Tourism Market

6.2 Impact of Geopolitical Conflicts on Global Helicopter Tourism Market

7. Five Forces Analysis

7.1 Five forces summary

Five forces analysis - Comparison between 2025 and 2030

7.2 Bargaining power of buyers

Bargaining power of buyers - Impact of key factors 2025 and 2030

7.3 Bargaining power of suppliers

Bargaining power of suppliers - Impact of key factors in 2025 and 2030

7.4 Threat of new entrants

Threat of new entrants - Impact of key factors in 2025 and 2030

7.5 Threat of substitutes

Threat of substitutes - Impact of key factors in 2025 and 2030

7.6 Threat of rivalry

Threat of rivalry - Impact of key factors in 2025 and 2030

7.7 Market condition

Chart on Market condition - Five forces 2025 and 2030

8. Market Segmentation by Type

8.1 Market segments

Chart on Type - Market share 2025-2030 (%)
Data Table on Type - Market share 2025-2030 (%)

8.2 Comparison by Type

Chart on Comparison by Type
Data Table on Comparison by Type

8.3 General - Market size and forecast 2025-2030

Chart on General - Market size and forecast 2025-2030 ($ thousand)
Data Table on General - Market size and forecast 2025-2030 ($ thousand)
Chart on General - Year-over-year growth 2025-2030 (%)
Data Table on General - Year-over-year growth 2025-2030 (%)

8.4 Customized - Market size and forecast 2025-2030

Chart on Customized - Market size and forecast 2025-2030 ($ thousand)
Data Table on Customized - Market size and forecast 2025-2030 ($ thousand)
Chart on Customized - Year-over-year growth 2025-2030 (%)
Data Table on Customized - Year-over-year growth 2025-2030 (%)

8.5 Market opportunity by Type

Market opportunity by Type ($ thousand)
Data Table on Market opportunity by Type ($ thousand)

9. Market Segmentation by Ownership

9.1 Market segments

Chart on Ownership - Market share 2025-2030 (%)
Data Table on Ownership - Market share 2025-2030 (%)

9.2 Comparison by Ownership

Chart on Comparison by Ownership
Data Table on Comparison by Ownership

9.3 Charter service - Market size and forecast 2025-2030

Chart on Charter service - Market size and forecast 2025-2030 ($ thousand)
Data Table on Charter service - Market size and forecast 2025-2030 ($ thousand)
Chart on Charter service - Year-over-year growth 2025-2030 (%)
Data Table on Charter service - Year-over-year growth 2025-2030 (%)

9.4 Fractional ownership - Market size and forecast 2025-2030

Chart on Fractional ownership - Market size and forecast 2025-2030 ($ thousand)
Data Table on Fractional ownership - Market size and forecast 2025-2030 ($ thousand)
Chart on Fractional ownership - Year-over-year growth 2025-2030 (%)
Data Table on Fractional ownership - Year-over-year growth 2025-2030 (%)

9.5 Market opportunity by Ownership

Market opportunity by Ownership ($ thousand)
Data Table on Market opportunity by Ownership ($ thousand)

10. Market Segmentation by Product

10.1 Market segments

Chart on Product - Market share 2025-2030 (%)
Data Table on Product - Market share 2025-2030 (%)

10.2 Comparison by Product

Chart on Comparison by Product
Data Table on Comparison by Product

10.3 Personal tourism - Market size and forecast 2025-2030

Chart on Personal tourism - Market size and forecast 2025-2030 ($ thousand)
Data Table on Personal tourism - Market size and forecast 2025-2030 ($ thousand)
Chart on Personal tourism - Year-over-year growth 2025-2030 (%)
Data Table on Personal tourism - Year-over-year growth 2025-2030 (%)

10.4 Family tourism - Market size and forecast 2025-2030

Chart on Family tourism - Market size and forecast 2025-2030 ($ thousand)
Data Table on Family tourism - Market size and forecast 2025-2030 ($ thousand)
Chart on Family tourism - Year-over-year growth 2025-2030 (%)
Data Table on Family tourism - Year-over-year growth 2025-2030 (%)

10.5 Group tourism - Market size and forecast 2025-2030

Chart on Group tourism - Market size and forecast 2025-2030 ($ thousand)
Data Table on Group tourism - Market size and forecast 2025-2030 ($ thousand)
Chart on Group tourism - Year-over-year growth 2025-2030 (%)
Data Table on Group tourism - Year-over-year growth 2025-2030 (%)

10.6 Market opportunity by Product

Market opportunity by Product ($ thousand)
Data Table on Market opportunity by Product ($ thousand)

11. Customer Landscape

11.1 Customer landscape overview

Analysis of price sensitivity, lifecycle, customer purchase basket, adoption rates, and purchase criteria

12. Geographic Landscape

12.1 Geographic segmentation

Chart on Market share by geography 2025-2030 (%)
Data Table on Market share by geography 2025-2030 (%)

12.2 Geographic comparison

Chart on Geographic comparison
Data Table on Geographic comparison

12.3 North America - Market size and forecast 2025-2030

Chart on North America - Market size and forecast 2025-2030 ($ thousand)
Data Table on North America - Market size and forecast 2025-2030 ($ thousand)
Chart on North America - Year-over-year growth 2025-2030 (%)
Data Table on North America - Year-over-year growth 2025-2030 (%)
Chart on Regional Comparison - North America
Data Table on Regional Comparison - North America

12.3.1 US - Market size and forecast 2025-2030

Chart on US - Market size and forecast 2025-2030 ($ thousand)
Data Table on US - Market size and forecast 2025-2030 ($ thousand)
Chart on US - Year-over-year growth 2025-2030 (%)
Data Table on US - Year-over-year growth 2025-2030 (%)

12.3.2 Canada - Market size and forecast 2025-2030

Chart on Canada - Market size and forecast 2025-2030 ($ thousand)
Data Table on Canada - Market size and forecast 2025-2030 ($ thousand)
Chart on Canada - Year-over-year growth 2025-2030 (%)
Data Table on Canada - Year-over-year growth 2025-2030 (%)

12.3.3 Mexico - Market size and forecast 2025-2030

Chart on Mexico - Market size and forecast 2025-2030 ($ thousand)
Data Table on Mexico - Market size and forecast 2025-2030 ($ thousand)
Chart on Mexico - Year-over-year growth 2025-2030 (%)
Data Table on Mexico - Year-over-year growth 2025-2030 (%)

12.4 APAC - Market size and forecast 2025-2030

Chart on APAC - Market size and forecast 2025-2030 ($ thousand)
Data Table on APAC - Market size and forecast 2025-2030 ($ thousand)
Chart on APAC - Year-over-year growth 2025-2030 (%)
Data Table on APAC - Year-over-year growth 2025-2030 (%)
Chart on Regional Comparison - APAC
Data Table on Regional Comparison - APAC

12.4.1 Australia - Market size and forecast 2025-2030

Chart on Australia - Market size and forecast 2025-2030 ($ thousand)
Data Table on Australia - Market size and forecast 2025-2030 ($ thousand)
Chart on Australia - Year-over-year growth 2025-2030 (%)
Data Table on Australia - Year-over-year growth 2025-2030 (%)

12.4.2 Japan - Market size and forecast 2025-2030

Chart on Japan - Market size and forecast 2025-2030 ($ thousand)
Data Table on Japan - Market size and forecast 2025-2030 ($ thousand)
Chart on Japan - Year-over-year growth 2025-2030 (%)
Data Table on Japan - Year-over-year growth 2025-2030 (%)

12.4.3 China - Market size and forecast 2025-2030

Chart on China - Market size and forecast 2025-2030 ($ thousand)
Data Table on China - Market size and forecast 2025-2030 ($ thousand)
Chart on China - Year-over-year growth 2025-2030 (%)
Data Table on China - Year-over-year growth 2025-2030 (%)

12.4.4 India - Market size and forecast 2025-2030

Chart on India - Market size and forecast 2025-2030 ($ thousand)
Data Table on India - Market size and forecast 2025-2030 ($ thousand)
Chart on India - Year-over-year growth 2025-2030 (%)
Data Table on India - Year-over-year growth 2025-2030 (%)

12.4.5 South Korea - Market size and forecast 2025-2030

Chart on South Korea - Market size and forecast 2025-2030 ($ thousand)
Data Table on South Korea - Market size and forecast 2025-2030 ($ thousand)
Chart on South Korea - Year-over-year growth 2025-2030 (%)
Data Table on South Korea - Year-over-year growth 2025-2030 (%)

12.4.6 Indonesia - Market size and forecast 2025-2030

Chart on Indonesia - Market size and forecast 2025-2030 ($ thousand)
Data Table on Indonesia - Market size and forecast 2025-2030 ($ thousand)
Chart on Indonesia - Year-over-year growth 2025-2030 (%)
Data Table on Indonesia - Year-over-year growth 2025-2030 (%)

12.5 Europe - Market size and forecast 2025-2030

Chart on Europe - Market size and forecast 2025-2030 ($ thousand)
Data Table on Europe - Market size and forecast 2025-2030 ($ thousand)
Chart on Europe - Year-over-year growth 2025-2030 (%)
Data Table on Europe - Year-over-year growth 2025-2030 (%)
Chart on Regional Comparison - Europe
Data Table on Regional Comparison - Europe

12.5.1 France - Market size and forecast 2025-2030

Chart on France - Market size and forecast 2025-2030 ($ thousand)
Data Table on France - Market size and forecast 2025-2030 ($ thousand)
Chart on France - Year-over-year growth 2025-2030 (%)
Data Table on France - Year-over-year growth 2025-2030 (%)

12.5.2 Italy - Market size and forecast 2025-2030

Chart on Italy - Market size and forecast 2025-2030 ($ thousand)
Data Table on Italy - Market size and forecast 2025-2030 ($ thousand)
Chart on Italy - Year-over-year growth 2025-2030 (%)
Data Table on Italy - Year-over-year growth 2025-2030 (%)

12.5.3 Spain - Market size and forecast 2025-2030

Chart on Spain - Market size and forecast 2025-2030 ($ thousand)
Data Table on Spain - Market size and forecast 2025-2030 ($ thousand)
Chart on Spain - Year-over-year growth 2025-2030 (%)
Data Table on Spain - Year-over-year growth 2025-2030 (%)

12.5.4 UK - Market size and forecast 2025-2030

Chart on UK - Market size and forecast 2025-2030 ($ thousand)
Data Table on UK - Market size and forecast 2025-2030 ($ thousand)
Chart on UK - Year-over-year growth 2025-2030 (%)
Data Table on UK - Year-over-year growth 2025-2030 (%)

12.5.5 Germany - Market size and forecast 2025-2030

Chart on Germany - Market size and forecast 2025-2030 ($ thousand)
Data Table on Germany - Market size and forecast 2025-2030 ($ thousand)
Chart on Germany - Year-over-year growth 2025-2030 (%)
Data Table on Germany - Year-over-year growth 2025-2030 (%)

12.5.6 The Netherlands - Market size and forecast 2025-2030

Chart on The Netherlands - Market size and forecast 2025-2030 ($ thousand)
Data Table on The Netherlands - Market size and forecast 2025-2030 ($ thousand)
Chart on The Netherlands - Year-over-year growth 2025-2030 (%)
Data Table on The Netherlands - Year-over-year growth 2025-2030 (%)

12.6 South America - Market size and forecast 2025-2030

Chart on South America - Market size and forecast 2025-2030 ($ thousand)
Data Table on South America - Market size and forecast 2025-2030 ($ thousand)
Chart on South America - Year-over-year growth 2025-2030 (%)
Data Table on South America - Year-over-year growth 2025-2030 (%)
Chart on Regional Comparison - South America
Data Table on Regional Comparison - South America

12.6.1 Brazil - Market size and forecast 2025-2030

Chart on Brazil - Market size and forecast 2025-2030 ($ thousand)
Data Table on Brazil - Market size and forecast 2025-2030 ($ thousand)
Chart on Brazil - Year-over-year growth 2025-2030 (%)
Data Table on Brazil - Year-over-year growth 2025-2030 (%)

12.6.2 Argentina - Market size and forecast 2025-2030

Chart on Argentina - Market size and forecast 2025-2030 ($ thousand)
Data Table on Argentina - Market size and forecast 2025-2030 ($ thousand)
Chart on Argentina - Year-over-year growth 2025-2030 (%)
Data Table on Argentina - Year-over-year growth 2025-2030 (%)

12.6.3 Chile - Market size and forecast 2025-2030

Chart on Chile - Market size and forecast 2025-2030 ($ thousand)
Data Table on Chile - Market size and forecast 2025-2030 ($ thousand)
Chart on Chile - Year-over-year growth 2025-2030 (%)
Data Table on Chile - Year-over-year growth 2025-2030 (%)

12.7 Middle East and Africa - Market size and forecast 2025-2030

Chart on Middle East and Africa - Market size and forecast 2025-2030 ($ thousand)
Data Table on Middle East and Africa - Market size and forecast 2025-2030 ($ thousand)
Chart on Middle East and Africa - Year-over-year growth 2025-2030 (%)
Data Table on Middle East and Africa - Year-over-year growth 2025-2030 (%)
Chart on Regional Comparison - Middle East and Africa
Data Table on Regional Comparison - Middle East and Africa

12.7.1 UAE - Market size and forecast 2025-2030

Chart on UAE - Market size and forecast 2025-2030 ($ thousand)
Data Table on UAE - Market size and forecast 2025-2030 ($ thousand)
Chart on UAE - Year-over-year growth 2025-2030 (%)
Data Table on UAE - Year-over-year growth 2025-2030 (%)

12.7.2 Saudi Arabia - Market size and forecast 2025-2030

Chart on Saudi Arabia - Market size and forecast 2025-2030 ($ thousand)
Data Table on Saudi Arabia - Market size and forecast 2025-2030 ($ thousand)
Chart on Saudi Arabia - Year-over-year growth 2025-2030 (%)
Data Table on Saudi Arabia - Year-over-year growth 2025-2030 (%)

12.7.3 South Africa - Market size and forecast 2025-2030

Chart on South Africa - Market size and forecast 2025-2030 ($ thousand)
Data Table on South Africa - Market size and forecast 2025-2030 ($ thousand)
Chart on South Africa - Year-over-year growth 2025-2030 (%)
Data Table on South Africa - Year-over-year growth 2025-2030 (%)

12.7.4 Turkey - Market size and forecast 2025-2030

Chart on Turkey - Market size and forecast 2025-2030 ($ thousand)
Data Table on Turkey - Market size and forecast 2025-2030 ($ thousand)
Chart on Turkey - Year-over-year growth 2025-2030 (%)
Data Table on Turkey - Year-over-year growth 2025-2030 (%)

12.7.5 Israel - Market size and forecast 2025-2030

Chart on Israel - Market size and forecast 2025-2030 ($ thousand)
Data Table on Israel - Market size and forecast 2025-2030 ($ thousand)
Chart on Israel - Year-over-year growth 2025-2030 (%)
Data Table on Israel - Year-over-year growth 2025-2030 (%)

12.8 Market opportunity by geography

Market opportunity by geography ($ thousand)
Data Tables on Market opportunity by geography ($ thousand)

13. Drivers, Challenges, and Opportunity

13.1 Market drivers

Growing demand for experiential and unique travel
Rising disposable incomes and growth of luxury tourism
Technological advancements in helicopter technology

13.2 Market challenges

High operational and maintenance costs
Stringent regulatory compliance and safety perceptions
Environmental impact and social acceptance

13.3 Impact of drivers and challenges

Impact of drivers and challenges in 2025 and 2030

13.4 Market opportunities

Enhanced digital customer journey and onboard technology integration
Proliferation of niche and themed aerial experiences
Increasing focus on sustainable operations and eco-tourism

14. Competitive Landscape

14.1 Overview

14.2

Overview on criticality of inputs and factors of differentiation

14.3 Landscape disruption

Overview on factors of disruption

14.4 Industry risks

Impact of key risks on business

15. Competitive Analysis

15.1 Companies profiled

Companies covered

15.2 Company ranking index

15.3 Market positioning of companies

Matrix on companies position and classification

15.4 Accretion Aviation

Accretion Aviation - Overview
Accretion Aviation - Product / Service
Accretion Aviation - Key offerings
SWOT

15.5 Airbus SE

Airbus SE - Overview
Airbus SE - Business segments
Airbus SE - Key news
Airbus SE - Key offerings
Airbus SE - Segment focus
SWOT

15.6 Birds Eye View Helicopters Inc.

Birds Eye View Helicopters Inc. - Overview
Birds Eye View Helicopters Inc. - Product / Service
Birds Eye View Helicopters Inc. - Key offerings
SWOT

15.7 BLADE Air Mobility Inc.

BLADE Air Mobility Inc. - Overview
BLADE Air Mobility Inc. - Business segments
BLADE Air Mobility Inc. - Key offerings
BLADE Air Mobility Inc. - Segment focus
SWOT

15.8 Charm Aviation LLC

Charm Aviation LLC - Overview
Charm Aviation LLC - Product / Service
Charm Aviation LLC - Key offerings
SWOT

15.9 Glacier Helicopters Ltd.

Glacier Helicopters Ltd. - Overview
Glacier Helicopters Ltd. - Product / Service
Glacier Helicopters Ltd. - Key offerings
SWOT

15.10 Heli USA Airways Inc.

Heli USA Airways Inc. - Overview
Heli USA Airways Inc. - Product / Service
Heli USA Airways Inc. - Key offerings
SWOT

15.11 HeliDubai

HeliDubai - Overview
HeliDubai - Product / Service
HeliDubai - Key offerings
SWOT

15.12 Helinet Aviation Services

Helinet Aviation Services - Overview
Helinet Aviation Services - Product / Service
Helinet Aviation Services - Key offerings
SWOT

15.13 Helitours

Helitours - Overview
Helitours - Product / Service
Helitours - Key offerings
SWOT

15.14 Maverick Aviation Group

Maverick Aviation Group - Overview
Maverick Aviation Group - Product / Service
Maverick Aviation Group - Key offerings
SWOT

15.15 Monacair SAM

Monacair SAM - Overview
Monacair SAM - Product / Service
Monacair SAM - Key offerings
SWOT

15.16 Papillon Helicopters

Papillon Helicopters - Overview
Papillon Helicopters - Product / Service
Papillon Helicopters - Key offerings
SWOT

15.17 Sundance Helicopters Inc.

Sundance Helicopters Inc. - Overview
Sundance Helicopters Inc. - Product / Service
Sundance Helicopters Inc. - Key offerings
SWOT

15.18 Zip Aviation

Zip Aviation - Overview
Zip Aviation - Product / Service
Zip Aviation - Key offerings
SWOT

16. Appendix

16.1 Scope of the report

Market definition
Objectives
Notes and caveats

16.2 Inclusions and exclusions checklist

Inclusions checklist
Exclusions checklist

16.3 Currency conversion rates for US$

16.4 Research methodology

16.5 Data procurement

Information sources

16.6 Data validation

16.7 Validation techniques employed for market sizing

16.8 Data synthesis

16.9 360 degree market analysis

16.10 List of abbreviations

Research Methodology

Technavio presents a detailed picture of the market by way of study, synthesis, and summation of data from multiple sources. The analysts have presented the various facets of the market with a particular focus on identifying the key industry influencers. The data thus presented is comprehensive, reliable, and the result of extensive research, both primary and secondary.

INFORMATION SOURCES

Primary sources

  • Manufacturers and suppliers
  • Channel partners
  • Industry experts
  • Strategic decision makers

Secondary sources

  • Industry journals and periodicals
  • Government data
  • Financial reports of key industry players
  • Historical data
  • Press releases

DATA ANALYSIS

Data Synthesis

  • Collation of data
  • Estimation of key figures
  • Analysis of derived insights

Data Validation

  • Triangulation with data models
  • Reference against proprietary databases
  • Corroboration with industry experts

REPORT WRITING

Qualitative

  • Market drivers
  • Market challenges
  • Market trends
  • Five forces analysis

Quantitative

  • Market size and forecast
  • Market segmentation
  • Geographical insights
  • Competitive landscape

Interested in this report?

Get your sample now to see our research methodology and insights!

Download Now

Frequently Asked Questions

Helicopter Tourism market growth will increase by USD 267901.3 thousand thousand during 2026-2030.

The Helicopter Tourism market is expected to grow at a CAGR of 3.9% during 2026-2030.

Helicopter Tourism market is segmented by Type (General, Customized) Ownership (Charter service, Fractional ownership) Product (Personal tourism, Family tourism, Group tourism)

Accretion Aviation, Airbus SE, Birds Eye View Helicopters Inc., BLADE Air Mobility Inc., Blue Hawaiian Helicopters, Charm Aviation LLC, GCH Aviation Group, Glacier Helicopters Ltd., Heli USA Airways Inc., HeliDubai, Helinet Aviation Services, Helitours, Island Helicopters Kauai Inc., Maverick Aviation Group, Monacair SAM, Papillon Helicopters, Rainbow Helicopters LLC, Sundance Helicopters Inc., Sydney Helicopters, Zip Aviation are a few of the key vendors in the Helicopter Tourism market.

North America will register the highest growth rate of 57.7% among the other regions. Therefore, the Helicopter Tourism market in North America is expected to garner significant business opportunities for the vendors during the forecast period.

US, Canada, Mexico, Australia, Japan, China, India, South Korea, Indonesia, France, Italy, Spain, UK, Germany, The Netherlands, Brazil, Argentina, Chile, UAE, Saudi Arabia, South Africa, Turkey, Israel

  • Growing demand for experiential and unique travel is the driving factor this market.

The Helicopter Tourism market vendors should focus on grabbing business opportunities from the Type segment as it accounted for the largest market share in the base year.
RIA - Research AI Assistant
Ask RIA
