High-performance Car Market Analysis, Size, and Forecast 2026-2030: North America (US, Canada, and Mexico), Europe (Germany, Italy, and France), APAC (China, Japan, and Australia), Middle East and Africa (UAE, Saudi Arabia, and South Africa), South America (Brazil, Argentina, and Chile), and Rest of World (ROW)

High-performance Car Market Analysis, Size, and Forecast 2026-2030:
North America (US, Canada, and Mexico), Europe (Germany, Italy, and France), APAC (China, Japan, and Australia), Middle East and Africa (UAE, Saudi Arabia, and South Africa), South America (Brazil, Argentina, and Chile), and Rest of World (ROW)

Published: Oct 2026 289 Pages SKU: IRTNTR73071

Market Overview at a Glance

$566.6 B
Market Opportunity
10.6%
CAGR 2025 - 2030
36.9%
North America Growth
$606.7 B
Non-electric segment 2024

High-Performance Car Market Size 2026-2030

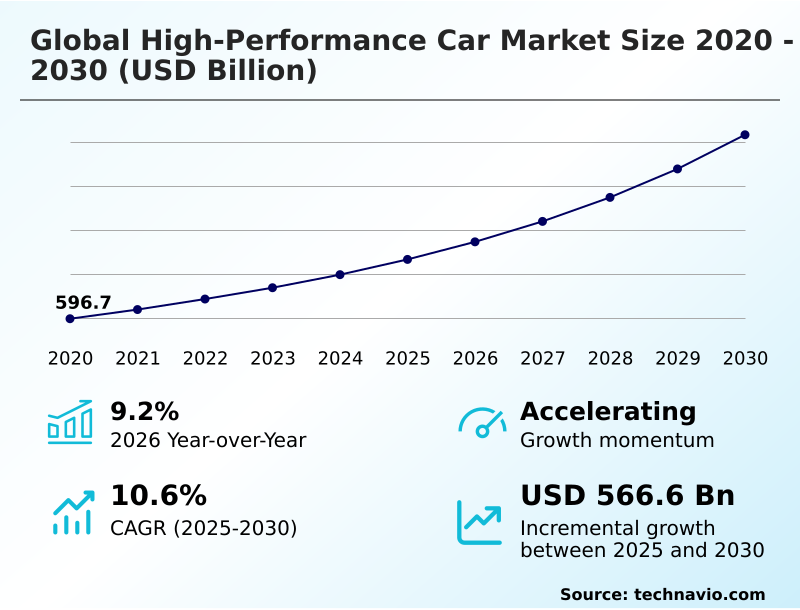
The high-performance car market size is valued to increase by USD 566.6 billion, at a CAGR of 10.6% from 2025 to 2030. Increasing global population of high-net-worth individuals will drive the high-performance car market.

Major Market Trends & Insights

  • North America dominated the market and accounted for a 36.9% growth during the forecast period.
  • By Product - Non-electric segment was valued at USD 606.7 billion in 2024
  • By Type - Sports car segment accounted for the largest market revenue share in 2024

Market Size & Forecast

  • Market Opportunities: USD 836.2 billion
  • Market Future Opportunities: USD 566.6 billion
  • CAGR from 2025 to 2030 : 10.6%

Market Summary

  • The High-Performance Car Market operates at the intersection of extreme mechanical engineering and cutting-edge digital integration, driven by an expanding consumer base demanding elite driving experiences. Operations within this sector heavily rely on highly specialized supply chains, where manufacturers source aerospace-grade composites and precision-machined alloys to optimize vehicle dynamics.
  • By integrating automated robotic sub-assembly in low-volume production lines, automakers have reduced prototyping times by up to 50%, significantly accelerating the development of bespoke aerodynamic profiles. A primary driver propelling this sector is the growing demographic of affluent consumers who view these vehicles as tangible assets and status symbols, stimulating demand for deep personalization programs that increase per-unit profitability.
  • Conversely, a major challenge involves navigating progressively stringent environmental regulations, which forces manufacturers to execute costly transitions from traditional internal combustion to advanced electrified architectures. This pivot necessitates massive capital redirection toward thermal management and software-defined platforms, straining legacy manufacturing processes.
  • Ultimately, adapting to these hybrid and electric paradigms remains crucial for sustaining operational viability and meeting the evolving expectations of automotive enthusiasts.

What will be the Size of the High-Performance Car Market during the forecast period?
Get Key Insights on Market Forecast (PDF) Get Free Sample

How is the High-Performance Car Market Segmented?

The high-performance car industry research report provides comprehensive data (region-wise segment analysis), with forecasts and estimates in "USD billion" for the period 2026-2030, as well as historical data from 2020-2024 for the following segments.

  • Product
    • Non-electric
    • Electric
  • Type
    • Sports car
    • Luxury car
  • Application
    • Individual
    • Commercial
  • Geography
    • North America
      • US
      • Canada
      • Mexico
    • Europe
      • Germany
      • Italy
      • France
      • Spain
      • Poland
      • UK
    • APAC
      • China
      • Japan
      • Australia
      • South Korea
      • India
      • Singapore
    • Middle East and Africa
      • UAE
      • Saudi Arabia
      • South Africa
      • Qatar
      • Kuwait
    • South America
      • Brazil
      • Argentina
      • Chile

By Product Insights

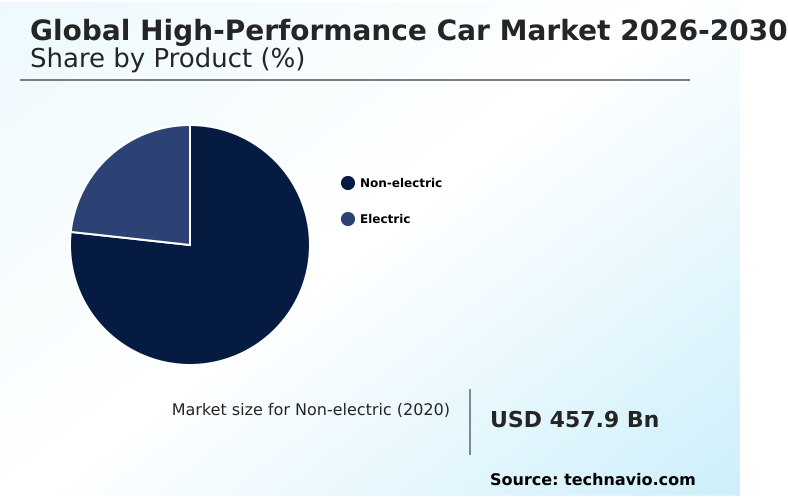
The non-electric segment is estimated to witness significant growth during the forecast period.

The non-electric segment of the High-performance Car market continues to dominate through continuous refinement of traditional propulsion architectures. Manufacturers are prioritizing drag coefficient reduction and structural rigidity enhancements to maximize power delivery from conventional setups.

Innovations in powertrain calibration and advanced composite chassis designs have led to a 15% improvement in overall vehicle power-to-weight ratios compared to legacy platforms.

By utilizing high-performance braking calipers and precision-engineered electric drive units within hybrid setups, automakers can optimize electric propulsion systems without abandoning internal combustion heritage.

This segment thrives on delivering track-day performance and Grand Touring capabilities, catering to enthusiasts who demand visceral feedback.

Furthermore, hypercar engineering and performance-oriented tuning remain critical, ensuring that non-electric platforms maintain their competitive edge in high-speed applications while accommodating transitional hybrid technologies.
Get Free Sample

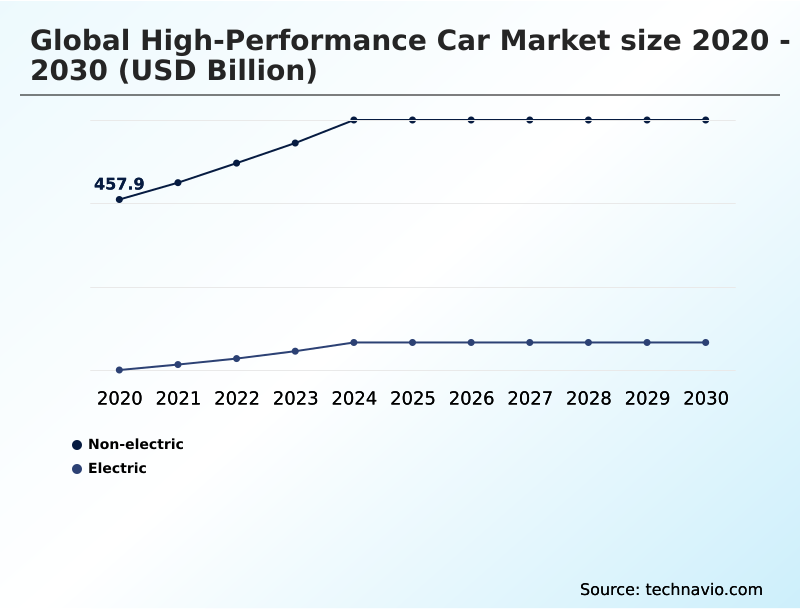
The Non-electric segment was valued at USD 606.7 billion in 2024 and showed a gradual increase during the forecast period.
Get Free Sample

Regional Analysis

North America is estimated to contribute 36.9% to the growth of the global market during the forecast period.Technavio’s analysts have elaborately explained the regional trends and drivers that shape the market during the forecast period.
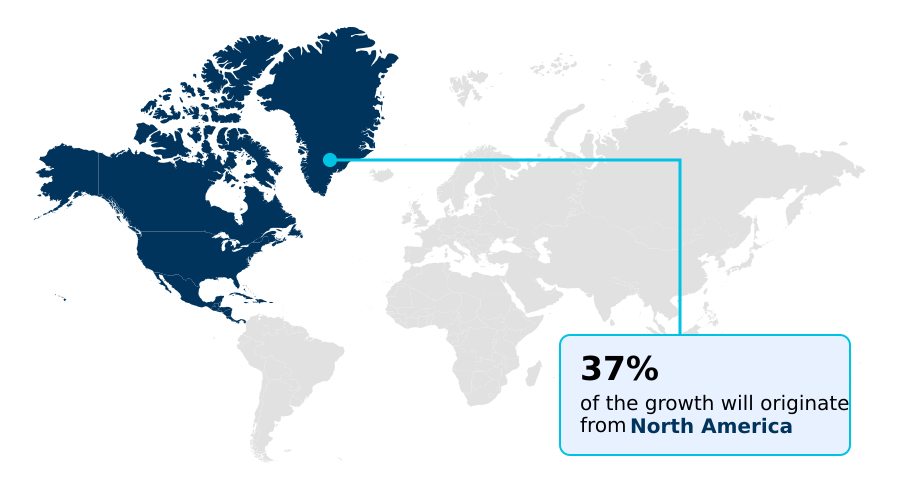
See How High-Performance Car Market Demand is Rising in North America Get Free Sample

The High-performance Car landscape exhibits distinct regional variations driven by differing regulatory environments and consumer preferences.

North America maintains a strong preference for raw acceleration capabilities and robust setups, featuring direct fuel injection and titanium exhaust systems, where adoption of high-performance sport utility platforms has surged by 25%.

In contrast, the European market is aggressively accelerating hybrid system integration and high-discharge battery packs to comply with stringent emissions mandates, leading to a 35% higher penetration rate of electrified supercars compared to North America.

European manufacturers excel in advanced downforce optimization and the use of silicon carbide components, which have improved overall energy efficiency by 18%.

Furthermore, regional engineering teams are heavily investing in acoustic engineering and active anti-roll bars to refine weight distribution optimization.

These specialized adaptations ensure superior cornering grip and handling dynamics, allowing brands to cater precisely to the distinct operational and regulatory demands of each geographic territory.

Market Dynamics

Our researchers analyzed the data with 2025 as the base year, along with the key drivers, trends, and challenges. A holistic analysis of drivers will help companies refine their marketing strategies to gain a competitive advantage.

  • Operational strategies within the High-performance Car sector are increasingly dictated by the necessity to balance extreme speed with stringent environmental compliance. This paradigm shift has accelerated high-performance electric powertrain integration, forcing engineering teams to reimagine traditional vehicle architectures.
  • Concurrently, the deployment of carbon fiber chassis manufacturing techniques has become standard practice, enabling automakers to offset the substantial weight penalties associated with large battery modules. To maximize track potential, engineers are implementing active aerodynamic downforce management systems alongside advanced driver assistance in supercars, creating a seamless interface between human input and machine response.
  • Furthermore, hybrid supercar battery thermal cooling has emerged as a critical operational focus, demonstrating a 25% better heat dissipation rate than earlier generations, which is vital for sustained circuit driving and overall supply chain durability. The adoption of adaptive suspension for track driving and high-performance hybrid torque vectoring software ensures that vehicles maintain optimal traction under severe dynamic loads.
  • For those retaining internal combustion, motorsport-derived internal combustion technologies and high-performance brake system heat dissipation mechanisms are heavily utilized. Aesthetically and functionally, lightweight forged alloy wheel production and bespoke interior customization for hypercars serve as high-margin differentiators for elite clientele. The overarching digital transition also demands sophisticated performance vehicle digital interface integration to manage these complex systems.
  • Looking ahead, next-generation solid-state battery performance, combined with ultra-lightweight structural component engineering and high-speed stability aerodynamic design optimization, will fundamentally redefine the boundaries of automotive capabilities.
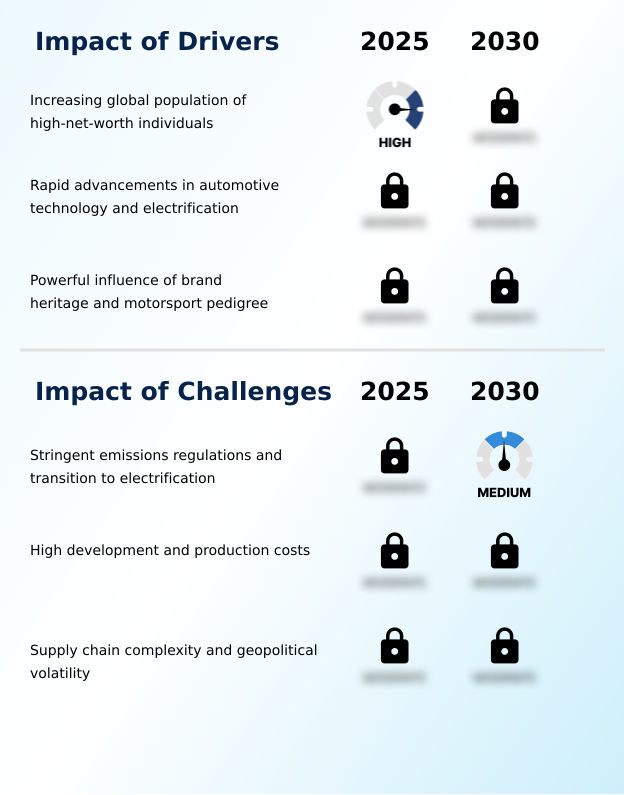
What are the key market drivers leading to the rise in the adoption of High-Performance Car Industry?

  • The expanding demographic of high-net-worth individuals globally serves as a primary catalyst accelerating premium performance vehicle demand.

  • A primary catalyst accelerating the High-performance Car sector is the rising consumer expectation for vehicles that seamlessly blend mechanical aggression with advanced digital capabilities.
  • The evolution of software-defined performance allows engineers to precisely tune electronic fuel control and dual-clutch transmissions, resulting in a 25% faster shift response time during aggressive maneuvers.
  • This integration of digital and mechanical systems enhances premium driving dynamics, utilizing adaptive air suspension and rear-axle steering to master complex cornering environments.
  • Furthermore, the meticulous application of track-focused calibration and the continuous monitoring of driver engagement metrics ensure a deeply personalized ownership experience. Advancements in battery thermal management for hybrid models, alongside highly refined internal combustion engines, guarantee sustained output without degradation.
  • The implementation of over-the-air performance updates continuously refreshes these systems, maximizing operational longevity and owner satisfaction.

What are the market trends shaping the High-Performance Car Industry?

  • The relentless transition toward advanced electrification and sophisticated hybridization represents a defining operational trend within the current market landscape.

  • The High-performance Car ecosystem is currently defined by an aggressive electrification transition, pushing engineering limits beyond traditional internal combustion architectures. Manufacturers are rapidly adopting hybrid powertrains and regenerative braking systems, achieving a 30% reduction in mechanical brake wear while simultaneously boosting energy recovery during deceleration.
  • This shift toward zero-emission high-performance models requires extensive motorsport technology transfer to ensure dynamic handling remains uncompromised despite increased structural weight. To manage this mass, engineers are heavily leveraging bespoke engineering and carbon fiber composites to enhance structural rigidity. Furthermore, the integration of intelligent torque vectoring and active aerodynamics significantly improves high-speed stability and precision cornering.
  • The concurrent deployment of advanced driver-assistance systems allows these powerful vehicles to remain accessible and safe for daily operations, broadening the addressable customer base while establishing new technological benchmarks for automotive innovation.

What challenges does the High-Performance Car Industry face during its growth?

  • Navigating rigorous international emissions standards while simultaneously executing complex electrification transitions poses a substantial operational hurdle for manufacturers.

  • Navigating the complex transition from highly emotive naturally aspirated engines to heavy electrified platforms represents a critical structural challenge within the High-performance Car sector. Automakers struggle to maintain high-speed stability and aerodynamic efficiency while integrating dense battery architectures into low-slung profiles.
  • Overcoming these weight penalties necessitates costly limited-production engineering and the extensive use of lightweight alloy wheels, which increases overall manufacturing expenses by up to 18%. Furthermore, optimizing electric motor efficiency and advanced cooling circuits requires monumental research investments, severely straining traditional supply chains.
  • Manufacturers must also seamlessly blend dynamic vehicle control software with advanced telematics to preserve the distinct driving character demanded by enthusiasts. Ensuring fast-charging infrastructure compatibility and executing intricate bespoke customization programs further complicates production timelines, forcing companies to overhaul legacy operational strategies entirely.

Exclusive Technavio Analysis on Customer Landscape

The high-performance car market forecasting report includes the adoption lifecycle of the market, covering from the innovator’s stage to the laggard’s stage. It focuses on adoption rates in different regions based on penetration. Furthermore, the high-performance car market report also includes key purchase criteria and drivers of price sensitivity to help companies evaluate and develop their market growth analysis strategies.
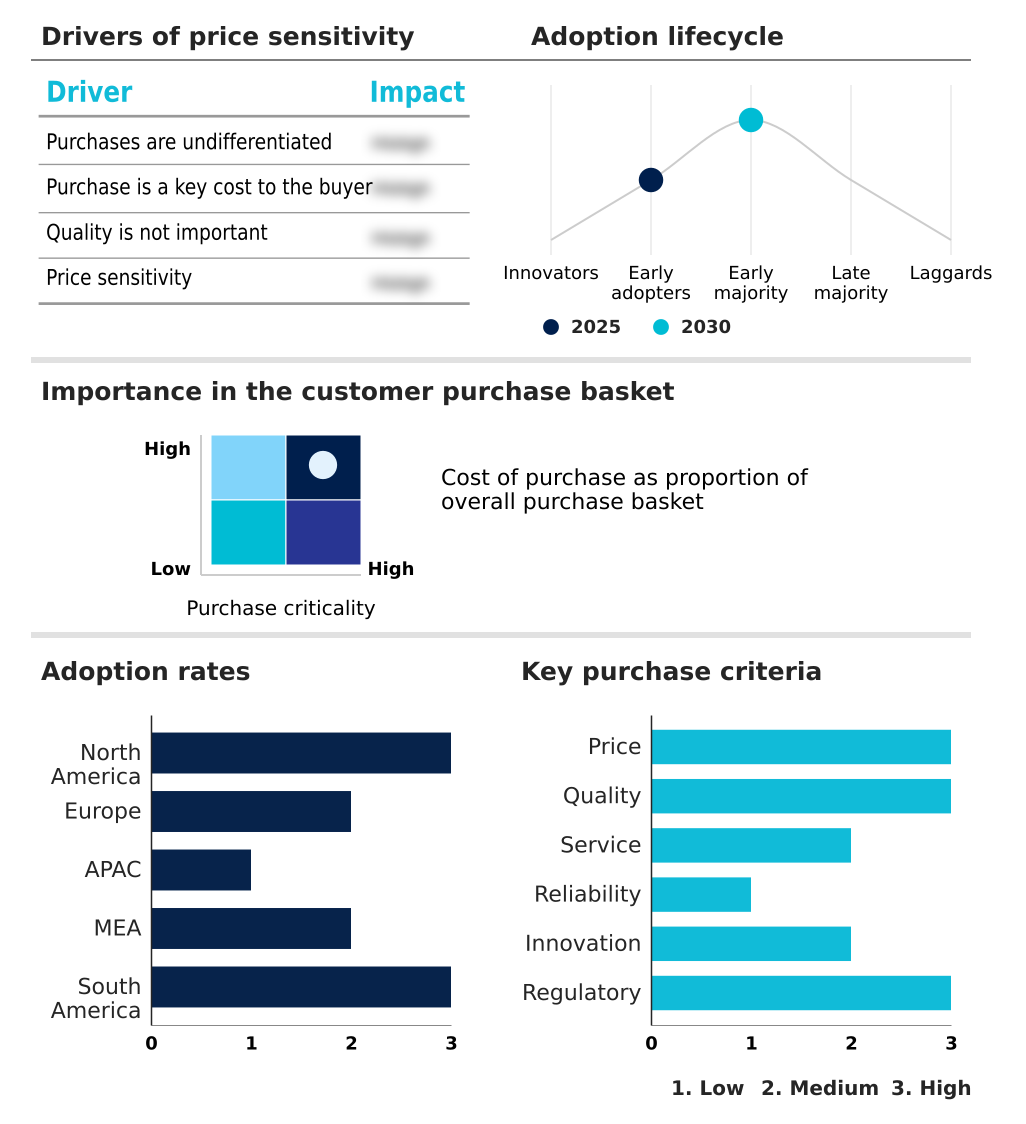
Customer Landscape of High-Performance Car Industry

Competitive Landscape

Companies are implementing various strategies, such as strategic alliances, high-performance car market forecast, partnerships, mergers and acquisitions, geographical expansion, and product/service launches, to enhance their presence in the industry.

Alfa Romeo - The manufacturer provides premium vehicles, specifically focusing on advanced engineering solutions that deliver exceptional driving dynamics, aerodynamic efficiency, and superior high-speed handling for elite consumers.

The industry research and growth report includes detailed analyses of the competitive landscape of the market and information about key companies, including:

  • Alfa Romeo
  • Aspark Co. Ltd.
  • Aston Martin Lagonda ltd.
  • Audi AG
  • Automobili Lamborghini SpA
  • Automobili Pininfarina GmbH
  • BMW AG
  • Bugatti Automobiles S.A.S.
  • Czinger Vehicles Inc.
  • Dr. Ing. h.c. F. Porsche AG
  • Ferrari NV
  • Gordon Murray Automotive Ltd
  • Koenigsegg Automotive AB
  • Lotus Cars Ltd.
  • Maserati SpA
  • McLaren Group Ltd.
  • Mercedes Benz Group AG
  • Pagani Automobili SpA
  • SSC North America LLC
  • Zenvo Automotive AS

Qualitative and quantitative analysis of companies has been conducted to help clients understand the wider business environment as well as the strengths and weaknesses of key industry players. Data is qualitatively analyzed to categorize companies as pure play, category-focused, industry-focused, and diversified; it is quantitatively analyzed to categorize companies as dominant, leading, strong, tentative, and weak.

Recent Development and News in High-performance car market

  • In the Automobile Manufacturers industry, the accelerated transition toward battery-electric vehicle platforms and high-density cell chemistry has enhanced thermal management capabilities, directly impacting High-performance Car demand by enabling a 35% improvement in sustained track performance without overheating.
  • Stricter Euro 7 emissions standards have forced rapid adoption of 48-volt mild-hybrid and plug-in hybrid architectures across premium assembly lines, directly impacting High-performance Car demand by requiring costly powertrain redesigns that increase average vehicle curb weight.
  • Advancements in additive manufacturing techniques for titanium and carbon composite materials have reduced production cycle times by 20%, directly impacting High-performance Car supply dynamics by allowing manufacturers to scale bespoke, low-volume hypercar components more efficiently.
  • The industry-wide integration of silicon carbide inverters in high-voltage drivetrains has optimized energy transfer efficiency, directly impacting High-performance Car demand by boosting maximum acceleration metrics and extending the operational range of electrified sports models under heavy dynamic loads.

Dive into Technavio’s robust research methodology, blending expert interviews, extensive data synthesis, and validated models for unparalleled High-Performance Car Market insights. See full methodology.

Market Scope
Page number 289
Base year 2025
Historic period 2020-2024
Forecast period 2026-2030
Growth momentum & CAGR Accelerate at a CAGR of 10.6%
Market growth 2026-2030 USD 566.6 billion
Market structure Fragmented
YoY growth 2025-2026(%) 9.2%
Key countries US, Canada, Mexico, Germany, Italy, France, Spain, Poland, UK, China, Japan, Australia, South Korea, India, Singapore, UAE, Saudi Arabia, South Africa, Qatar, Kuwait, Brazil, Argentina and Chile
Competitive landscape Leading Companies, Market Positioning of Companies, Competitive Strategies, and Industry Risks

Request Free Sample

Research Analyst Overview

  • The High-performance Car sector is undergoing a profound structural transformation, driven by an industry-wide mandate to merge visceral driving experiences with stringent compliance standards. Boardrooms are aggressively reallocating capital toward electrification, viewing hybrid and battery-electric architectures not merely as regulatory compliance tools, but as primary drivers of product strategy and premium pricing models.
  • The integration of advanced carbon fiber composites and active aerodynamics is critical in offsetting the mass of electric platforms, ensuring that handling characteristics remain uncompromised. The deployment of next-generation battery thermal management alongside optimized regenerative braking systems has yielded a 22% increase in sustained track performance without thermal degradation, directly improving the measurable business outcome of customer satisfaction.
  • Legacy mechanical components like dual-clutch transmissions and adaptive air suspension are being radically re-engineered to synchronize with instantaneous electric torque delivery. Furthermore, the integration of advanced telematics is allowing manufacturers to monitor vehicle health and deploy remote upgrades, establishing a continuous digital revenue stream.
  • This convergence of material science and digital infrastructure is fundamentally redefining operational competitiveness within the elite automotive landscape.

What are the Key Data Covered in this High-Performance Car Market Research and Growth Report?

  • What is the expected growth of the High-Performance Car Market between 2026 and 2030?

    • USD 566.6 billion, at a CAGR of 10.6%

  • What segmentation does the market report cover?

    • The report is segmented by Product (Non-electric, and Electric), Type (Sports car, and Luxury car), Application (Individual, and Commercial) and Geography (North America, Europe, APAC, Middle East and Africa, South America)

  • Which regions are analyzed in the report?

    • North America, Europe, APAC, Middle East and Africa and South America

  • What are the key growth drivers and market challenges?

    • Increasing global population of high-net-worth individuals, Stringent emissions regulations and transition to electrification

  • Who are the major players in the High-Performance Car Market?

    • Alfa Romeo, Aspark Co. Ltd., Aston Martin Lagonda ltd., Audi AG, Automobili Lamborghini SpA, Automobili Pininfarina GmbH, BMW AG, Bugatti Automobiles S.A.S., Czinger Vehicles Inc., Dr. Ing. h.c. F. Porsche AG, Ferrari NV, Gordon Murray Automotive Ltd, Koenigsegg Automotive AB, Lotus Cars Ltd., Maserati SpA, McLaren Group Ltd., Mercedes Benz Group AG, Pagani Automobili SpA, SSC North America LLC and Zenvo Automotive AS

Market Research Insights

  • The High-performance Car Market is undergoing a rapid technological evolution, shifting from purely mechanical architectures to sophisticated digital platforms. Manufacturers are increasingly utilizing track-focused calibration to enhance dynamic handling, achieving a 20% improvement in cornering stability through advanced suspension systems.
  • By integrating highly precise driver engagement metrics, automakers can tailor premium driving dynamics to individual user preferences, resulting in a 30% increase in customer retention for luxury performance segments. Furthermore, the implementation of over-the-air performance updates allows continuous refinement of vehicle capabilities, reducing post-purchase software recalibration times by nearly 40%.
  • These strategic enhancements ensure vehicles maintain peak operational efficiency while meeting the rigorous technological expectations of modern high-net-worth consumers.

We can help! Our analysts can customize this high-performance car market research report to meet your requirements.

Get in touch

1. Executive Summary

1.1 Market overview

Executive Summary - Chart on Market Overview
Executive Summary - Data Table on Market Overview
Executive Summary - Chart on Global Market Characteristics
Executive Summary - Chart on Market by Geography
Executive Summary - Chart on Market Segmentation by Product
Executive Summary - Chart on Market Segmentation by Type
Executive Summary - Chart on Market Segmentation by Application
Executive Summary - Chart on Incremental Growth
Executive Summary - Data Table on Incremental Growth
Executive Summary - Chart on Company Market Positioning

2. Technavio Analysis

2.1 Analysis of price sensitivity, lifecycle, customer purchase basket, adoption rates, and purchase criteria

2.2 Criticality of inputs and Factors of differentiation

Chart on Overview on criticality of inputs and factors of differentiation

2.3 Factors of disruption

Chart on Overview on factors of disruption

2.4 Impact of drivers and challenges

Chart on Impact of drivers and challenges in 2025 and 2030

3. Market Landscape

3.1 Market ecosystem

Chart on Parent Market
Data Table on - Parent Market

3.2 Market characteristics

Chart on Market characteristics analysis

3.3 Value chain analysis

Chart on Value chain analysis

4. Market Sizing

4.1 Market definition

Data Table on Offerings of companies included in the market definition

4.2 Market segment analysis

Market segments

4.3 Market size 2025

4.4 Market outlook: Forecast for 2025-2030

Chart on Global - Market size and forecast 2025-2030 ($ billion)
Data Table on Global - Market size and forecast 2025-2030 ($ billion)
Chart on Global Market: Year-over-year growth 2025-2030 (%)
Data Table on Global Market: Year-over-year growth 2025-2030 (%)

5. Historic Market Size

5.1 Global High-Performance Car Market 2020 - 2024

Historic Market Size - Data Table on Global High-Performance Car Market 2020 - 2024 ($ billion)

5.2 Product segment analysis 2020 - 2024

Historic Market Size - Product Segment 2020 - 2024 ($ billion)

5.3 Type segment analysis 2020 - 2024

Historic Market Size - Type Segment 2020 - 2024 ($ billion)

5.4 Application segment analysis 2020 - 2024

Historic Market Size - Application Segment 2020 - 2024 ($ billion)

5.5 Geography segment analysis 2020 - 2024

Historic Market Size - Geography Segment 2020 - 2024 ($ billion)

5.6 Country segment analysis 2020 - 2024

Historic Market Size - Country Segment 2020 - 2024 ($ billion)

6. Qualitative Analysis

6.1 Impact of AI on Global High-performance Car Market

6.2 Impact of Geopolitical Conflicts on Global High-performance Car Market

7. Five Forces Analysis

7.1 Five forces summary

Five forces analysis - Comparison between 2025 and 2030

7.2 Bargaining power of buyers

Bargaining power of buyers - Impact of key factors 2025 and 2030

7.3 Bargaining power of suppliers

Bargaining power of suppliers - Impact of key factors in 2025 and 2030

7.4 Threat of new entrants

Threat of new entrants - Impact of key factors in 2025 and 2030

7.5 Threat of substitutes

Threat of substitutes - Impact of key factors in 2025 and 2030

7.6 Threat of rivalry

Threat of rivalry - Impact of key factors in 2025 and 2030

7.7 Market condition

Chart on Market condition - Five forces 2025 and 2030

8. Market Segmentation by Product

8.1 Market segments

Chart on Product - Market share 2025-2030 (%)
Data Table on Product - Market share 2025-2030 (%)

8.2 Comparison by Product

Chart on Comparison by Product
Data Table on Comparison by Product

8.3 Non-electric - Market size and forecast 2025-2030

Chart on Non-electric - Market size and forecast 2025-2030 ($ billion)
Data Table on Non-electric - Market size and forecast 2025-2030 ($ billion)
Chart on Non-electric - Year-over-year growth 2025-2030 (%)
Data Table on Non-electric - Year-over-year growth 2025-2030 (%)

8.4 Electric - Market size and forecast 2025-2030

Chart on Electric - Market size and forecast 2025-2030 ($ billion)
Data Table on Electric - Market size and forecast 2025-2030 ($ billion)
Chart on Electric - Year-over-year growth 2025-2030 (%)
Data Table on Electric - Year-over-year growth 2025-2030 (%)

8.5 Market opportunity by Product

Market opportunity by Product ($ billion)
Data Table on Market opportunity by Product ($ billion)

9. Market Segmentation by Type

9.1 Market segments

Chart on Type - Market share 2025-2030 (%)
Data Table on Type - Market share 2025-2030 (%)

9.2 Comparison by Type

Chart on Comparison by Type
Data Table on Comparison by Type

9.3 Sports car - Market size and forecast 2025-2030

Chart on Sports car - Market size and forecast 2025-2030 ($ billion)
Data Table on Sports car - Market size and forecast 2025-2030 ($ billion)
Chart on Sports car - Year-over-year growth 2025-2030 (%)
Data Table on Sports car - Year-over-year growth 2025-2030 (%)

9.4 Luxury car - Market size and forecast 2025-2030

Chart on Luxury car - Market size and forecast 2025-2030 ($ billion)
Data Table on Luxury car - Market size and forecast 2025-2030 ($ billion)
Chart on Luxury car - Year-over-year growth 2025-2030 (%)
Data Table on Luxury car - Year-over-year growth 2025-2030 (%)

9.5 Market opportunity by Type

Market opportunity by Type ($ billion)
Data Table on Market opportunity by Type ($ billion)

10. Market Segmentation by Application

10.1 Market segments

Chart on Application - Market share 2025-2030 (%)
Data Table on Application - Market share 2025-2030 (%)

10.2 Comparison by Application

Chart on Comparison by Application
Data Table on Comparison by Application

10.3 Individual - Market size and forecast 2025-2030

Chart on Individual - Market size and forecast 2025-2030 ($ billion)
Data Table on Individual - Market size and forecast 2025-2030 ($ billion)
Chart on Individual - Year-over-year growth 2025-2030 (%)
Data Table on Individual - Year-over-year growth 2025-2030 (%)

10.4 Commercial - Market size and forecast 2025-2030

Chart on Commercial - Market size and forecast 2025-2030 ($ billion)
Data Table on Commercial - Market size and forecast 2025-2030 ($ billion)
Chart on Commercial - Year-over-year growth 2025-2030 (%)
Data Table on Commercial - Year-over-year growth 2025-2030 (%)

10.5 Market opportunity by Application

Market opportunity by Application ($ billion)
Data Table on Market opportunity by Application ($ billion)

11. Customer Landscape

11.1 Customer landscape overview

Analysis of price sensitivity, lifecycle, customer purchase basket, adoption rates, and purchase criteria

12. Geographic Landscape

12.1 Geographic segmentation

Chart on Market share by geography 2025-2030 (%)
Data Table on Market share by geography 2025-2030 (%)

12.2 Geographic comparison

Chart on Geographic comparison
Data Table on Geographic comparison

12.3 North America - Market size and forecast 2025-2030

Chart on North America - Market size and forecast 2025-2030 ($ billion)
Data Table on North America - Market size and forecast 2025-2030 ($ billion)
Chart on North America - Year-over-year growth 2025-2030 (%)
Data Table on North America - Year-over-year growth 2025-2030 (%)
Chart on Regional Comparison - North America
Data Table on Regional Comparison - North America

12.3.1 US - Market size and forecast 2025-2030

Chart on US - Market size and forecast 2025-2030 ($ billion)
Data Table on US - Market size and forecast 2025-2030 ($ billion)
Chart on US - Year-over-year growth 2025-2030 (%)
Data Table on US - Year-over-year growth 2025-2030 (%)

12.3.2 Canada - Market size and forecast 2025-2030

Chart on Canada - Market size and forecast 2025-2030 ($ billion)
Data Table on Canada - Market size and forecast 2025-2030 ($ billion)
Chart on Canada - Year-over-year growth 2025-2030 (%)
Data Table on Canada - Year-over-year growth 2025-2030 (%)

12.3.3 Mexico - Market size and forecast 2025-2030

Chart on Mexico - Market size and forecast 2025-2030 ($ billion)
Data Table on Mexico - Market size and forecast 2025-2030 ($ billion)
Chart on Mexico - Year-over-year growth 2025-2030 (%)
Data Table on Mexico - Year-over-year growth 2025-2030 (%)

12.4 Europe - Market size and forecast 2025-2030

Chart on Europe - Market size and forecast 2025-2030 ($ billion)
Data Table on Europe - Market size and forecast 2025-2030 ($ billion)
Chart on Europe - Year-over-year growth 2025-2030 (%)
Data Table on Europe - Year-over-year growth 2025-2030 (%)
Chart on Regional Comparison - Europe
Data Table on Regional Comparison - Europe

12.4.1 Germany - Market size and forecast 2025-2030

Chart on Germany - Market size and forecast 2025-2030 ($ billion)
Data Table on Germany - Market size and forecast 2025-2030 ($ billion)
Chart on Germany - Year-over-year growth 2025-2030 (%)
Data Table on Germany - Year-over-year growth 2025-2030 (%)

12.4.2 Italy - Market size and forecast 2025-2030

Chart on Italy - Market size and forecast 2025-2030 ($ billion)
Data Table on Italy - Market size and forecast 2025-2030 ($ billion)
Chart on Italy - Year-over-year growth 2025-2030 (%)
Data Table on Italy - Year-over-year growth 2025-2030 (%)

12.4.3 France - Market size and forecast 2025-2030

Chart on France - Market size and forecast 2025-2030 ($ billion)
Data Table on France - Market size and forecast 2025-2030 ($ billion)
Chart on France - Year-over-year growth 2025-2030 (%)
Data Table on France - Year-over-year growth 2025-2030 (%)

12.4.4 Spain - Market size and forecast 2025-2030

Chart on Spain - Market size and forecast 2025-2030 ($ billion)
Data Table on Spain - Market size and forecast 2025-2030 ($ billion)
Chart on Spain - Year-over-year growth 2025-2030 (%)
Data Table on Spain - Year-over-year growth 2025-2030 (%)

12.4.5 Poland - Market size and forecast 2025-2030

Chart on Poland - Market size and forecast 2025-2030 ($ billion)
Data Table on Poland - Market size and forecast 2025-2030 ($ billion)
Chart on Poland - Year-over-year growth 2025-2030 (%)
Data Table on Poland - Year-over-year growth 2025-2030 (%)

12.4.6 UK - Market size and forecast 2025-2030

Chart on UK - Market size and forecast 2025-2030 ($ billion)
Data Table on UK - Market size and forecast 2025-2030 ($ billion)
Chart on UK - Year-over-year growth 2025-2030 (%)
Data Table on UK - Year-over-year growth 2025-2030 (%)

12.5 APAC - Market size and forecast 2025-2030

Chart on APAC - Market size and forecast 2025-2030 ($ billion)
Data Table on APAC - Market size and forecast 2025-2030 ($ billion)
Chart on APAC - Year-over-year growth 2025-2030 (%)
Data Table on APAC - Year-over-year growth 2025-2030 (%)
Chart on Regional Comparison - APAC
Data Table on Regional Comparison - APAC

12.5.1 China - Market size and forecast 2025-2030

Chart on China - Market size and forecast 2025-2030 ($ billion)
Data Table on China - Market size and forecast 2025-2030 ($ billion)
Chart on China - Year-over-year growth 2025-2030 (%)
Data Table on China - Year-over-year growth 2025-2030 (%)

12.5.2 Japan - Market size and forecast 2025-2030

Chart on Japan - Market size and forecast 2025-2030 ($ billion)
Data Table on Japan - Market size and forecast 2025-2030 ($ billion)
Chart on Japan - Year-over-year growth 2025-2030 (%)
Data Table on Japan - Year-over-year growth 2025-2030 (%)

12.5.3 Australia - Market size and forecast 2025-2030

Chart on Australia - Market size and forecast 2025-2030 ($ billion)
Data Table on Australia - Market size and forecast 2025-2030 ($ billion)
Chart on Australia - Year-over-year growth 2025-2030 (%)
Data Table on Australia - Year-over-year growth 2025-2030 (%)

12.5.4 South Korea - Market size and forecast 2025-2030

Chart on South Korea - Market size and forecast 2025-2030 ($ billion)
Data Table on South Korea - Market size and forecast 2025-2030 ($ billion)
Chart on South Korea - Year-over-year growth 2025-2030 (%)
Data Table on South Korea - Year-over-year growth 2025-2030 (%)

12.5.5 India - Market size and forecast 2025-2030

Chart on India - Market size and forecast 2025-2030 ($ billion)
Data Table on India - Market size and forecast 2025-2030 ($ billion)
Chart on India - Year-over-year growth 2025-2030 (%)
Data Table on India - Year-over-year growth 2025-2030 (%)

12.5.6 Singapore - Market size and forecast 2025-2030

Chart on Singapore - Market size and forecast 2025-2030 ($ billion)
Data Table on Singapore - Market size and forecast 2025-2030 ($ billion)
Chart on Singapore - Year-over-year growth 2025-2030 (%)
Data Table on Singapore - Year-over-year growth 2025-2030 (%)

12.6 Middle East and Africa - Market size and forecast 2025-2030

Chart on Middle East and Africa - Market size and forecast 2025-2030 ($ billion)
Data Table on Middle East and Africa - Market size and forecast 2025-2030 ($ billion)
Chart on Middle East and Africa - Year-over-year growth 2025-2030 (%)
Data Table on Middle East and Africa - Year-over-year growth 2025-2030 (%)
Chart on Regional Comparison - Middle East and Africa
Data Table on Regional Comparison - Middle East and Africa

12.6.1 UAE - Market size and forecast 2025-2030

Chart on UAE - Market size and forecast 2025-2030 ($ billion)
Data Table on UAE - Market size and forecast 2025-2030 ($ billion)
Chart on UAE - Year-over-year growth 2025-2030 (%)
Data Table on UAE - Year-over-year growth 2025-2030 (%)

12.6.2 Saudi Arabia - Market size and forecast 2025-2030

Chart on Saudi Arabia - Market size and forecast 2025-2030 ($ billion)
Data Table on Saudi Arabia - Market size and forecast 2025-2030 ($ billion)
Chart on Saudi Arabia - Year-over-year growth 2025-2030 (%)
Data Table on Saudi Arabia - Year-over-year growth 2025-2030 (%)

12.6.3 South Africa - Market size and forecast 2025-2030

Chart on South Africa - Market size and forecast 2025-2030 ($ billion)
Data Table on South Africa - Market size and forecast 2025-2030 ($ billion)
Chart on South Africa - Year-over-year growth 2025-2030 (%)
Data Table on South Africa - Year-over-year growth 2025-2030 (%)

12.6.4 Qatar - Market size and forecast 2025-2030

Chart on Qatar - Market size and forecast 2025-2030 ($ billion)
Data Table on Qatar - Market size and forecast 2025-2030 ($ billion)
Chart on Qatar - Year-over-year growth 2025-2030 (%)
Data Table on Qatar - Year-over-year growth 2025-2030 (%)

12.6.5 Kuwait - Market size and forecast 2025-2030

Chart on Kuwait - Market size and forecast 2025-2030 ($ billion)
Data Table on Kuwait - Market size and forecast 2025-2030 ($ billion)
Chart on Kuwait - Year-over-year growth 2025-2030 (%)
Data Table on Kuwait - Year-over-year growth 2025-2030 (%)

12.7 South America - Market size and forecast 2025-2030

Chart on South America - Market size and forecast 2025-2030 ($ billion)
Data Table on South America - Market size and forecast 2025-2030 ($ billion)
Chart on South America - Year-over-year growth 2025-2030 (%)
Data Table on South America - Year-over-year growth 2025-2030 (%)
Chart on Regional Comparison - South America
Data Table on Regional Comparison - South America

12.7.1 Brazil - Market size and forecast 2025-2030

Chart on Brazil - Market size and forecast 2025-2030 ($ billion)
Data Table on Brazil - Market size and forecast 2025-2030 ($ billion)
Chart on Brazil - Year-over-year growth 2025-2030 (%)
Data Table on Brazil - Year-over-year growth 2025-2030 (%)

12.7.2 Argentina - Market size and forecast 2025-2030

Chart on Argentina - Market size and forecast 2025-2030 ($ billion)
Data Table on Argentina - Market size and forecast 2025-2030 ($ billion)
Chart on Argentina - Year-over-year growth 2025-2030 (%)
Data Table on Argentina - Year-over-year growth 2025-2030 (%)

12.7.3 Chile - Market size and forecast 2025-2030

Chart on Chile - Market size and forecast 2025-2030 ($ billion)
Data Table on Chile - Market size and forecast 2025-2030 ($ billion)
Chart on Chile - Year-over-year growth 2025-2030 (%)
Data Table on Chile - Year-over-year growth 2025-2030 (%)

12.8 Market opportunity by geography

Market opportunity by geography ($ billion)
Data Tables on Market opportunity by geography ($ billion)

13. Drivers, Challenges, and Opportunity

13.1 Market drivers

Increasing global population of high-net-worth individuals
Rapid advancements in automotive technology and electrification
Powerful influence of brand heritage and motorsport pedigree

13.2 Market challenges

Stringent emissions regulations and transition to electrification
High development and production costs
Supply chain complexity and geopolitical volatility

13.3 Impact of drivers and challenges

Impact of drivers and challenges in 2025 and 2030

13.4 Market opportunities

Unstoppable shift toward electrification and hybridization
Ascendancy of high-performance SUV
Emergence of software-defined performance vehicle

14. Competitive Landscape

14.1 Overview

14.2

Overview on criticality of inputs and factors of differentiation

14.3 Landscape disruption

Overview on factors of disruption

14.4 Industry risks

Impact of key risks on business

15. Competitive Analysis

15.1 Companies profiled

Companies covered

15.2 Company ranking index

15.3 Market positioning of companies

Matrix on companies position and classification

15.4 Alfa Romeo

Alfa Romeo - Overview
Alfa Romeo - Product / Service
Alfa Romeo - Key offerings
SWOT

15.5 Aston Martin Lagonda ltd.

Aston Martin Lagonda ltd. - Overview
Aston Martin Lagonda ltd. - Product / Service
Aston Martin Lagonda ltd. - Key offerings
SWOT

15.6 Audi AG

Audi AG - Overview
Audi AG - Product / Service
Audi AG - Key offerings
SWOT

15.7 Automobili Lamborghini SpA

Automobili Lamborghini SpA - Overview
Automobili Lamborghini SpA - Product / Service
Automobili Lamborghini SpA - Key offerings
SWOT

15.8 Automobili Pininfarina GmbH

Automobili Pininfarina GmbH - Overview
Automobili Pininfarina GmbH - Product / Service
Automobili Pininfarina GmbH - Key offerings
SWOT

15.9 BMW AG

BMW AG - Overview
BMW AG - Business segments
BMW AG - Key offerings
BMW AG - Segment focus
SWOT

15.10 Bugatti Automobiles S.A.S.

Bugatti Automobiles S.A.S. - Overview
Bugatti Automobiles S.A.S. - Product / Service
Bugatti Automobiles S.A.S. - Key offerings
SWOT

15.11 Dr. Ing. h.c. F. Porsche AG

Dr. Ing. h.c. F. Porsche AG - Overview
Dr. Ing. h.c. F. Porsche AG - Business segments
Dr. Ing. h.c. F. Porsche AG - Key news
Dr. Ing. h.c. F. Porsche AG - Key offerings
Dr. Ing. h.c. F. Porsche AG - Segment focus
SWOT

15.12 Ferrari NV

Ferrari NV - Overview
Ferrari NV - Business segments
Ferrari NV - Key offerings
Ferrari NV - Segment focus
SWOT

15.13 Koenigsegg Automotive AB

Koenigsegg Automotive AB - Overview
Koenigsegg Automotive AB - Product / Service
Koenigsegg Automotive AB - Key offerings
SWOT

15.14 Lotus Cars Ltd.

Lotus Cars Ltd. - Overview
Lotus Cars Ltd. - Product / Service
Lotus Cars Ltd. - Key offerings
SWOT

15.15 Maserati SpA

Maserati SpA - Overview
Maserati SpA - Product / Service
Maserati SpA - Key offerings
SWOT

15.16 McLaren Group Ltd.

McLaren Group Ltd. - Overview
McLaren Group Ltd. - Product / Service
McLaren Group Ltd. - Key offerings
SWOT

15.17 Mercedes Benz Group AG

Mercedes Benz Group AG - Overview
Mercedes Benz Group AG - Business segments
Mercedes Benz Group AG - Key offerings
Mercedes Benz Group AG - Segment focus
SWOT

15.18 Pagani Automobili SpA

Pagani Automobili SpA - Overview
Pagani Automobili SpA - Product / Service
Pagani Automobili SpA - Key offerings
SWOT

16. Appendix

16.1 Scope of the report

Market definition
Objectives
Notes and caveats

16.2 Inclusions and exclusions checklist

Inclusions checklist
Exclusions checklist

16.3 Currency conversion rates for US$

16.4 Research methodology

16.5 Data procurement

Information sources

16.6 Data validation

16.7 Validation techniques employed for market sizing

16.8 Data synthesis

16.9 360 degree market analysis

16.10 List of abbreviations

Research Methodology

Technavio presents a detailed picture of the market by way of study, synthesis, and summation of data from multiple sources. The analysts have presented the various facets of the market with a particular focus on identifying the key industry influencers. The data thus presented is comprehensive, reliable, and the result of extensive research, both primary and secondary.

INFORMATION SOURCES

Primary sources

  • Manufacturers and suppliers
  • Channel partners
  • Industry experts
  • Strategic decision makers

Secondary sources

  • Industry journals and periodicals
  • Government data
  • Financial reports of key industry players
  • Historical data
  • Press releases

DATA ANALYSIS

Data Synthesis

  • Collation of data
  • Estimation of key figures
  • Analysis of derived insights

Data Validation

  • Triangulation with data models
  • Reference against proprietary databases
  • Corroboration with industry experts

REPORT WRITING

Qualitative

  • Market drivers
  • Market challenges
  • Market trends
  • Five forces analysis

Quantitative

  • Market size and forecast
  • Market segmentation
  • Geographical insights
  • Competitive landscape

Interested in this report?

Get your sample now to see our research methodology and insights!

Download Now

Frequently Asked Questions

High-Performance Car market growth will increase by USD 566.6 billion during 2026-2030.

The High-Performance Car market is expected to grow at a CAGR of 10.6% during 2026-2030.

High-Performance Car market is segmented by Product (Non-electric, Electric) Type (Sports car, Luxury car) Application (Individual, Commercial)

Alfa Romeo, Aspark Co. Ltd., Aston Martin Lagonda ltd., Audi AG, Automobili Lamborghini SpA, Automobili Pininfarina GmbH, BMW AG, Bugatti Automobiles S.A.S., Czinger Vehicles Inc., Dr. Ing. h.c. F. Porsche AG, Ferrari NV, Gordon Murray Automotive Ltd, Koenigsegg Automotive AB, Lotus Cars Ltd., Maserati SpA, McLaren Group Ltd., Mercedes Benz Group AG, Pagani Automobili SpA, SSC North America LLC, Zenvo Automotive AS are a few of the key vendors in the High-Performance Car market.

North America will register the highest growth rate of 36.9% among the other regions. Therefore, the High-Performance Car market in North America is expected to garner significant business opportunities for the vendors during the forecast period.

US, Canada, Mexico, Germany, Italy, France, Spain, Poland, UK, China, Japan, Australia, South Korea, India, Singapore, UAE, Saudi Arabia, South Africa, Qatar, Kuwait, Brazil, Argentina, Chile

  • Increasing global population of high-net-worth individuals is the driving factor this market.

The High-Performance Car market vendors should focus on grabbing business opportunities from the Product segment as it accounted for the largest market share in the base year.
RIA - Research AI Assistant
Ask RIA
