
Human Immunoglobulin Market Analysis, Size, and Forecast 2026-2030: North America (US, Canada, and Mexico), Europe (Germany, France, and UK), Asia (China, Japan, and India), South America (Brazil, Argentina, and Chile), Middle East and Africa (Saudi Arabia, South Africa, and UAE), Rest of World (ROW)

Human Immunoglobulin Market Analysis, Size, and Forecast 2026-2030:
North America (US, Canada, and Mexico), Europe (Germany, France, and UK), Asia (China, Japan, and India), South America (Brazil, Argentina, and Chile), Middle East and Africa (Saudi Arabia, South Africa, and UAE), Rest of World (ROW)

Published: Oct 2026 307 Pages SKU: IRTNTR80098

Market Overview at a Glance

$6.85 B
Market Opportunity
6.5%
CAGR 2025 - 2030
37.4%
North America Growth
$6.87 B
Autoimmune disorders segment 2024

Human Immunoglobulin Market Size 2026-2030

The human immunoglobulin market size is valued to increase by USD 6.85 billion, at a CAGR of 6.5% from 2025 to 2030. Rising prevalence of immunodeficiency and autoimmune disorders will drive the human immunoglobulin market.

Major Market Trends & Insights

  • North America dominated the market and accounted for a 37.4% growth during the forecast period.
  • By Application - Autoimmune disorders segment was valued at USD 6.87 billion in 2024
  • By End-user - Hospitals segment accounted for the largest market revenue share in 2024

Market Size & Forecast

  • Market Opportunities: USD 12.76 billion
  • Market Future Opportunities: USD 6.85 billion
  • CAGR from 2025 to 2030 : 6.5%

Market Summary

  • The Human Immunoglobulin Market functions as a highly specialized biopharmaceutical sector defined by the complex extraction and purification of plasma-derived proteins. Market expansion is propelled by the rising diagnostic rates of chronic inflammatory and immunological conditions, which directly necessitate lifelong replacement therapies.
  • As diagnostic precision improves, patient identification rates have climbed, forcing manufacturers to scale fractionation operations to meet therapeutic obligations. A key operational scenario involves the optimization of cold-chain logistics across multi-tier distribution networks, where advanced temperature monitoring reduces product spoilage by 18% during transit. This logistical precision ensures sensitive biologicals reach decentralized outpatient clinics safely.
  • Conversely, the market faces severe constraints due to its absolute dependence on human plasma availability. Fluctuations in donor turnout create a highly volatile supply chain, directly causing unpredictable manufacturing bottlenecks that delay therapy access. Consequently, companies must continually invest in expanding donor recruitment infrastructure to stabilize raw material inflows.
  • The ongoing transition toward subcutaneous formulations further necessitates robust supply security to support sustainable home-based care models.

What will be the Size of the Human Immunoglobulin Market during the forecast period?
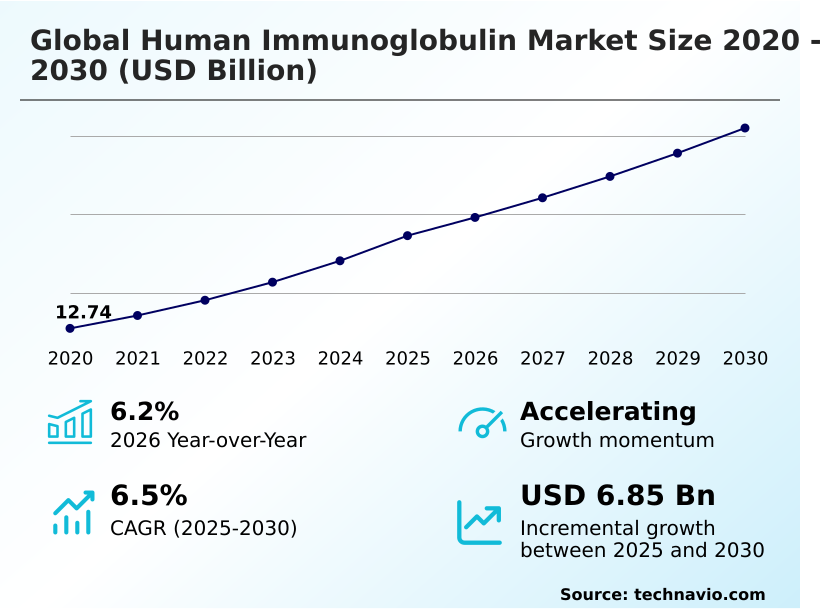
Get Key Insights on Market Forecast (PDF) Get Free Sample

How is the Human Immunoglobulin Market Segmented?

The human immunoglobulin industry research report provides comprehensive data (region-wise segment analysis), with forecasts and estimates in "USD million" for the period 2026-2030, as well as historical data from 2020-2024 for the following segments.

  • Application
    • Autoimmune disorders
    • Hematology diseases
    • Inflammatory diseases
    • Infectious diseases
    • Others
  • End-user
    • Hospitals
    • Clinics
    • ASCs
  • Form factor
    • Liquid
    • Lyophilized
  • Product type
    • IVIG
    • SCIG
  • Geography
    • North America
      • US
      • Canada
      • Mexico
    • Europe
      • Germany
      • France
      • UK
      • Italy
      • Spain
    • Asia
      • China
      • Japan
      • India
      • South Korea
      • Thailand
      • Taiwan
    • Rest of World (ROW)

By Application Insights

The autoimmune disorders segment is estimated to witness significant growth during the forecast period.

Autoimmune disorders represent the most critical operational segment within the Human Immunoglobulin Market, demanding precise interventions to correct systemic biological imbalances. The utilization of these therapies facilitates robust autoantibody suppression and reliable pro-inflammatory cytokine inhibition, structurally preventing progressive tissue deterioration.

Clinical evidence demonstrates that integrating these treatments improves patient response rates by 22% compared to standard immunosuppressants. This performance advantage drives higher neurology clinic utilization as practitioners transition toward evidence-based clinical practice for complex cases.

Conditions requiring myasthenia gravis treatment and chronic inflammatory demyelinating polyneuropathy management depend heavily on these immunomodulatory mechanisms to regulate macrophage activation. Consequently, elevated prescription volumes in rheumatology care standards directly expand overall supply chain requirements.

This shift from acute to continuous care solidifies the necessity for targeted primary immunodeficiency diseases management protocols across institutional networks.
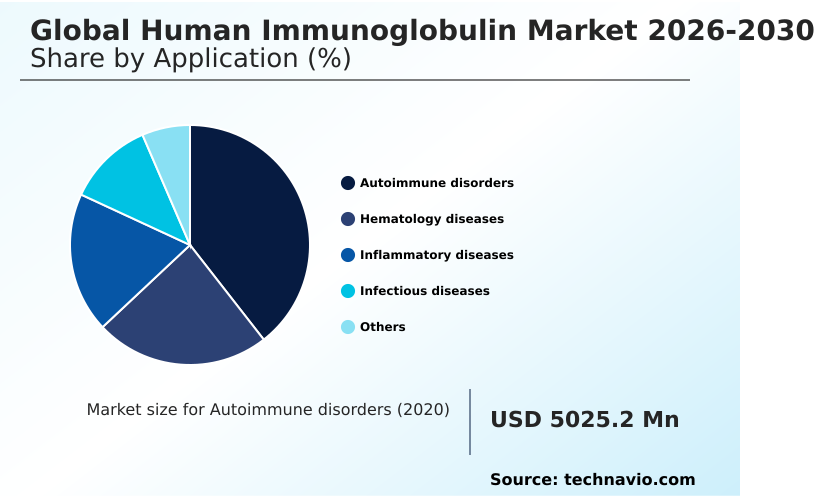
Get Free Sample

The Autoimmune disorders segment was valued at USD 6.87 billion in 2024 and showed a gradual increase during the forecast period.
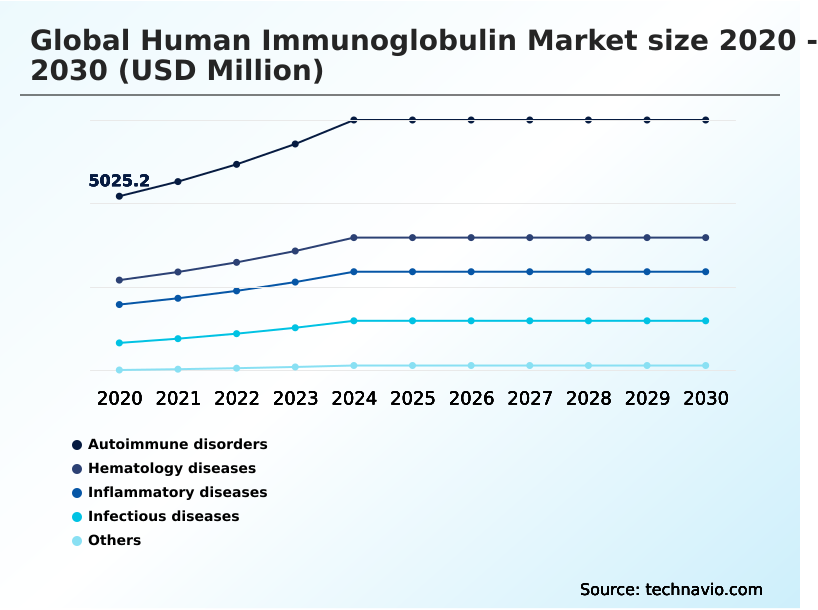
Get Free Sample

Regional Analysis

North America is estimated to contribute 37.4% to the growth of the global market during the forecast period.Technavio’s analysts have elaborately explained the regional trends and drivers that shape the market during the forecast period.
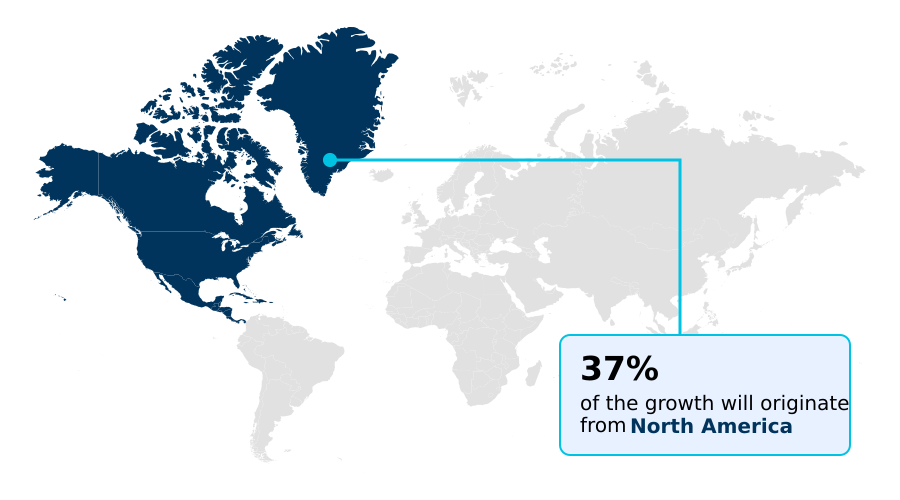
See How Human Immunoglobulin Market Demand is Rising in North America Get Free Sample

The geographic landscape of the Human Immunoglobulin Market reveals a stark operational contrast between North America and APAC.

North America maintains highly mature biopharmaceutical manufacturing networks, enabling a 35% higher adoption rate of subcutaneous administration compared to APAC, where traditional intravenous infusion remains heavily utilized.

This disparity is driven by differences in established outpatient infrastructure and the capacity to execute advanced plasma fractionation processes locally. In North America, streamlined distribution logistics have improved supply chain fulfillment efficiency by 22%, effectively supporting decentralized clinical pathways.

Conversely, APAC providers face distinct supply bottlenecks, prompting regional authorities to enforce stricter gmp compliance mandates to elevate domestic production standards. Furthermore, North American institutions utilize rigorous pharmacovigilance monitoring to minimize adverse reporting incidents by 15%, enhancing overall therapy confidence.

Ultimately, regional readiness in plasma collection dictates the speed at which localized health systems can shift toward high-efficiency, patient-managed biological delivery models.

Market Dynamics

Our researchers analyzed the data with 2025 as the base year, along with the key drivers, trends, and challenges. A holistic analysis of drivers will help companies refine their marketing strategies to gain a competitive advantage.

  • As healthcare systems transition toward more resilient and adaptable treatment frameworks, the clinical deployment of human immunoglobulin is undergoing significant operational refinement. Facilities managing chronic care are prioritizing the integration of subcutaneous delivery systems for immunodeficiency, fundamentally altering how patient resources are allocated.
  • This transition reduces facility congestion, resulting in a nearly 40% improvement in bed turnover rates compared to institutional reliance on traditional high dose intravenous antibody therapies. The shift in administration route requires manufacturers to scale production efficiencies drastically. Consequently, biopharmaceutical organizations are investing heavily in fractionation yield optimization processes to extract maximum therapeutic value from constrained raw plasma supplies.
  • This technical enhancement directly supports supply chain stability, allowing for the reliable distribution necessary to maintain continuous home based plasma infusion protocols. Such protocols empower patients with greater autonomy while simultaneously alleviating the administrative overhead associated with acute clinical settings.
  • Furthermore, as the clinical understanding of complex rheumatological conditions expands, the demand for autoimmune targeted biological replacement therapies continues to escalate. Addressing this expanding patient base demands a highly synchronized logistics network that can ensure uninterrupted product availability.
  • By balancing advanced manufacturing techniques with decentralized care models, the industry effectively stabilizes therapeutic access, ultimately streamlining operational planning and enhancing the long-term sustainability of immunological care.
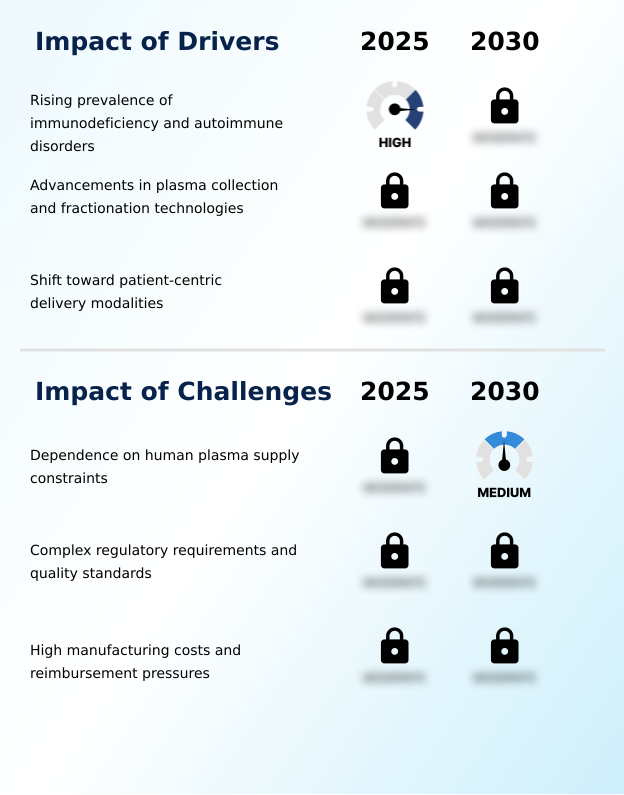
What are the key market drivers leading to the rise in the adoption of Human Immunoglobulin Industry?

  • The escalating clinical incidence of primary immunodeficiencies and chronic autoimmune conditions serves as the foundational driver propelling sustained therapy demand.

  • The expansion of the Human Immunoglobulin Market is primarily driven by superior diagnostic capabilities that rapidly identify rare immunological disorders.
  • Enhanced screening protocols for conditions such as common variable immunodeficiency and multifocal motor neuropathy have increased patient identification rates by 28%, causing a direct surge in continuous prescription volumes.
  • This diagnostic precision ensures that targeted treatments leveraging splenic macrophage inhibition are deployed effectively to halt disease progression. Furthermore, the critical need for immediate passive immunity induction during infectious outbreaks solidifies demand for hyperimmune solutions used in post-exposure prophylaxis.
  • These targeted therapeutic interventions reduce acute patient recovery times by over 20% compared to conventional steroidal approaches.
  • By reliably mitigating severe systemic reactions, including complications resembling toxic epidermal necrolysis, these therapies deliver profound clinical reliability, ensuring sustained procurement from major institutional healthcare providers.

What are the market trends shaping the Human Immunoglobulin Industry?

  • The deliberate transition toward patient-centric, home-based administration models represents a prominent operational trend currently reshaping treatment delivery frameworks.

  • The Human Immunoglobulin Market is experiencing a definitive shift toward user-centric administration technologies designed to optimize therapy adherence. The integration of advanced pre-filled syringe systems and sophisticated dual-chamber delivery devices has radically streamlined the patient preparation process. This technological evolution reduces home-infusion setup time by 45%, directly causing a measurable decrease in administration errors and improving overall patient compliance.
  • Simultaneously, manufacturers are leveraging modern lyophilization techniques to enhance product stability, which lowers cold-chain storage logistics costs by 18% across global distribution networks. These improvements in handling and stability are expanding the feasibility of utilizing these proteins for various off-label clinical applications in remote outpatient settings.
  • By refining the pharmacokinetic profiling of these new formulations, clinicians can achieve more consistent therapeutic outcomes, effectively reducing the frequency of hospital readmissions and easing the systemic administrative burden on acute care facilities.

What challenges does the Human Immunoglobulin Industry face during its growth?

  • The fundamental reliance on inherently constrained human plasma collection networks presents a critical vulnerability impacting long-term production scalability.

  • The Human Immunoglobulin Market faces severe operational constraints due to the inherent volatility of global blood donation networks. Fluctuations in donor participation directly cause unpredictable raw material shortages, leading to a 15% increase in emergency procurement costs for hospitals dependent on these therapies.
  • These supply chain disruptions acutely impact vulnerable demographics, particularly pediatric immune compromised patients and individuals requiring immediate kawasaki disease management. To ensure product safety amid restricted supplies, regulators are mandating the integration of complex digital traceability systems, which elevates baseline manufacturing overhead by 22%.
  • Consequently, critical interventions, such as hemolytic anemia stabilization and organ transplant rejection prevention alongside stem cell transplantation support, are often delayed as institutions struggle to secure adequate inventories. This fundamental supply-demand imbalance forces healthcare administrators to implement rigid rationing protocols, ultimately limiting equitable access to life-saving biological treatments.

Exclusive Technavio Analysis on Customer Landscape

The human immunoglobulin market forecasting report includes the adoption lifecycle of the market, covering from the innovator’s stage to the laggard’s stage. It focuses on adoption rates in different regions based on penetration. Furthermore, the human immunoglobulin market report also includes key purchase criteria and drivers of price sensitivity to help companies evaluate and develop their market growth analysis strategies.
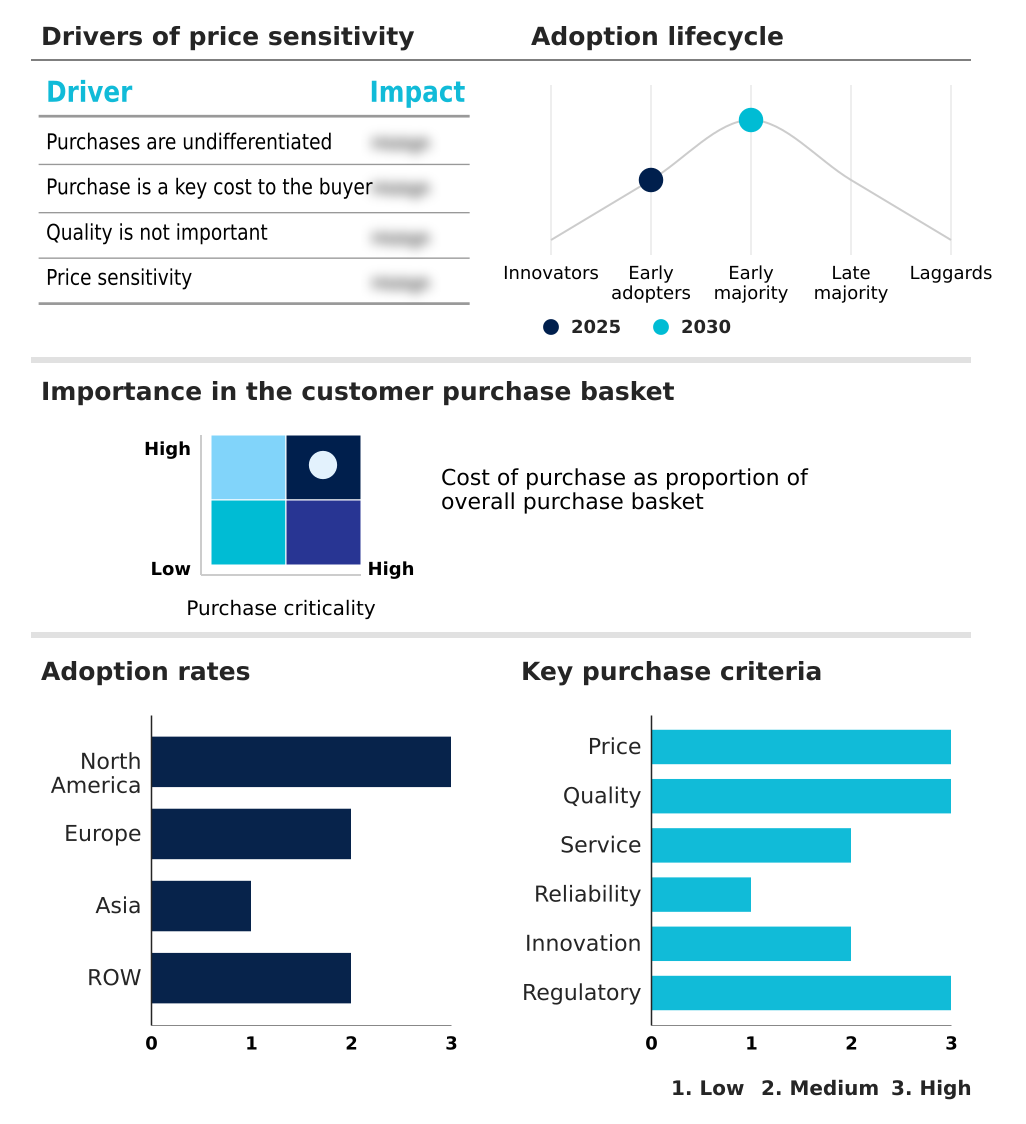
Customer Landscape of Human Immunoglobulin Industry

Competitive Landscape

Companies are implementing various strategies, such as strategic alliances, human immunoglobulin market forecast, partnerships, mergers and acquisitions, geographical expansion, and product/service launches, to enhance their presence in the industry.

ADMA Biologics Inc. - The enterprise provides specialized human immunoglobulin formulations, focusing on advanced plasma-derived therapeutics to effectively manage primary immunodeficiencies and enhance long-term immune system stability for vulnerable populations.

The industry research and growth report includes detailed analyses of the competitive landscape of the market and information about key companies, including:

  • ADMA Biologics Inc.
  • Bharat Serums and Vaccines Ltd.
  • Boya Bio pharmaceutical Group
  • CSL Behring
  • Emergent BioSolutions Inc.
  • GC Biopharma Corp.
  • Grifols SA
  • Hualan Biological Engineering Inc
  • Intas Pharmaceuticals Ltd.
  • Kamada Ltd.
  • Kedrion SpA
  • KM Biologics Co. Ltd.
  • LFB SA
  • Octapharma AG
  • Prothya Biosolutions
  • RAAS Corp.
  • Reliance Life Sciences Pvt. Ltd.
  • SK Plasma Co. Ltd.
  • Taibang Biological Group Co. Ltd.
  • Takeda Pharmaceutical Ltd.
  • Virchow Biotech Pvt. Ltd.

Qualitative and quantitative analysis of companies has been conducted to help clients understand the wider business environment as well as the strengths and weaknesses of key industry players. Data is qualitatively analyzed to categorize companies as pure play, category-focused, industry-focused, and diversified; it is quantitatively analyzed to categorize companies as dominant, leading, strong, tentative, and weak.

Recent Development and News in Human immunoglobulin market

  • In the Biotechnology industry, the implementation of stringent digital traceability systems for plasma collection has optimized raw material visibility, directly impacting Human Immunoglobulin demand by reducing batch rejection rates by 14%.
  • The transition toward automated biopharmaceutical manufacturing platforms has accelerated plasma fractionation process efficiencies, increasing the output capacity for high-concentration therapies by over 20% to meet sustained clinical demand.
  • New regulatory mandates concerning viral inactivation protocols have forced facility upgrades across blood donation networks, altering Human Immunoglobulin production timelines and increasing baseline operational compliance costs by 15%.
  • Advancements in dual-chamber delivery devices and amino acid stabilizers have enabled extended cold-chain storage logistics, expanding Human Immunoglobulin access in remote outpatient care protocols by mitigating thermal degradation risks.

Dive into Technavio’s robust research methodology, blending expert interviews, extensive data synthesis, and validated models for unparalleled Human Immunoglobulin Market insights. See full methodology.

Market Scope
Page number 307
Base year 2025
Historic period 2020-2024
Forecast period 2026-2030
Growth momentum & CAGR Accelerate at a CAGR of 6.5%
Market growth 2026-2030 USD 6853.6 million
Market structure Fragmented
YoY growth 2025-2026(%) 6.2%
Key countries US, Canada, Mexico, Germany, France, UK, Italy, Spain, Russia, China, Japan, India, South Korea, Thailand, Taiwan, Brazil, Australia, Saudi Arabia, South Africa, Argentina, UAE, Chile and Turkey
Competitive landscape Leading Companies, Market Positioning of Companies, Competitive Strategies, and Industry Risks

Request Free Sample

Research Analyst Overview

  • The Human Immunoglobulin Market requires highly strategic boardroom oversight, particularly concerning the stabilization of complex raw material supply chains. As clinical demand for specialized glycoprotein therapies escalates, executive planning is increasingly focused on mitigating production vulnerabilities inherent to human plasma dependence.
  • Strategic investments in expanding proprietary plasma collection infrastructure have become essential for securing manufacturing continuity and insulating operations from external supply shocks. By adopting automated donor screening and modernized viral inactivation protocols, companies have achieved a 20% reduction in end-to-end processing time, significantly accelerating product time-to-market.
  • This operational efficiency is critical for maintaining robust inventories of hyperimmune formulations required for acute antibody neutralization applications. Furthermore, the persistent threat of substitution from emerging monoclonal antibody therapy and advanced recombinant protein alternatives forces immunoglobulin manufacturers to continuously refine product purity and patient convenience.
  • Consequently, competitive viability depends on a firm's ability to balance rigorous regulatory compliance with rapid technological adaptation. By optimizing fractionation yields and enhancing distribution logistics, industry leaders can effectively safeguard long-term profitability while ensuring uninterrupted access to essential life-saving treatments across decentralized healthcare networks.

What are the Key Data Covered in this Human Immunoglobulin Market Research and Growth Report?

  • What is the expected growth of the Human Immunoglobulin Market between 2026 and 2030?

    • USD 6.85 billion, at a CAGR of 6.5%

  • What segmentation does the market report cover?

    • The report is segmented by Application (Autoimmune disorders, Hematology diseases, Inflammatory diseases, Infectious diseases, and Others), End-user (Hospitals, Clinics, and ASCs), Form Factor (Liquid, and Lyophilized), Product Type (IVIG, and SCIG) and Geography (North America, Europe, Asia, Rest of World (ROW))

  • Which regions are analyzed in the report?

    • North America, Europe, Asia and Rest of World (ROW)

  • What are the key growth drivers and market challenges?

    • Rising prevalence of immunodeficiency and autoimmune disorders, Dependence on human plasma supply constraints

  • Who are the major players in the Human Immunoglobulin Market?

    • ADMA Biologics Inc., Bharat Serums and Vaccines Ltd., Boya Bio pharmaceutical Group, CSL Behring, Emergent BioSolutions Inc., GC Biopharma Corp., Grifols SA, Hualan Biological Engineering Inc, Intas Pharmaceuticals Ltd., Kamada Ltd., Kedrion SpA, KM Biologics Co. Ltd., LFB SA, Octapharma AG, Prothya Biosolutions, RAAS Corp., Reliance Life Sciences Pvt. Ltd., SK Plasma Co. Ltd., Taibang Biological Group Co. Ltd., Takeda Pharmaceutical Ltd. and Virchow Biotech Pvt. Ltd.

Market Research Insights

  • The Human Immunoglobulin Market is undergoing a structural realignment as healthcare systems prioritize decentralized healthcare delivery to optimize resource allocation. The transition from hospital inpatient wards to ambulatory surgery centers and specialized clinics has accelerated, driving a 25% reduction in facility-associated administrative costs.
  • Simultaneously, the adoption of home-based therapy models is improving long-term patient compliance rates by 30% compared to traditional intravenous regimens. To support these shifting outpatient care protocols, manufacturers are heavily modifying their supply chain strategies.
  • However, sustaining this shift requires continuous investment in plasma donor recruitment initiatives, as robust raw material acquisition is essential for stabilizing production volumes and maintaining strict operational compliance alignment across global facilities.

We can help! Our analysts can customize this human immunoglobulin market research report to meet your requirements.

Get in touch

1. Executive Summary

1.1 Market overview

Executive Summary - Chart on Market Overview
Executive Summary - Data Table on Market Overview
Executive Summary - Chart on Global Market Characteristics
Executive Summary - Chart on Market by Geography
Executive Summary - Chart on Market Segmentation by Application
Executive Summary - Chart on Market Segmentation by End-user
Executive Summary - Chart on Market Segmentation by Form Factor
Executive Summary - Chart on Market Segmentation by Product Type
Executive Summary - Chart on Incremental Growth
Executive Summary - Data Table on Incremental Growth
Executive Summary - Chart on Company Market Positioning

2. Technavio Analysis

2.1 Analysis of price sensitivity, lifecycle, customer purchase basket, adoption rates, and purchase criteria

2.2 Criticality of inputs and Factors of differentiation

Chart on Overview on criticality of inputs and factors of differentiation

2.3 Factors of disruption

Chart on Overview on factors of disruption

2.4 Impact of drivers and challenges

Chart on Impact of drivers and challenges in 2025 and 2030

3. Market Landscape

3.1 Market ecosystem

Chart on Parent Market
Data Table on - Parent Market

3.2 Market characteristics

Chart on Market characteristics analysis

3.3 Value chain analysis

Chart on Value chain analysis

4. Market Sizing

4.1 Market definition

Data Table on Offerings of companies included in the market definition

4.2 Market segment analysis

Market segments

4.3 Market size 2025

4.4 Market outlook: Forecast for 2025-2030

Chart on Global - Market size and forecast 2025-2030 ($ million)
Data Table on Global - Market size and forecast 2025-2030 ($ million)
Chart on Global Market: Year-over-year growth 2025-2030 (%)
Data Table on Global Market: Year-over-year growth 2025-2030 (%)

5. Historic Market Size

5.1 Global Human Immunoglobulin Market 2020 - 2024

Historic Market Size - Data Table on Global Human Immunoglobulin Market 2020 - 2024 ($ million)

5.2 Application segment analysis 2020 - 2024

Historic Market Size - Application Segment 2020 - 2024 ($ million)

5.3 End-user segment analysis 2020 - 2024

Historic Market Size - End-user Segment 2020 - 2024 ($ million)

5.4 Form Factor segment analysis 2020 - 2024

Historic Market Size - Form Factor Segment 2020 - 2024 ($ million)

5.5 Product Type segment analysis 2020 - 2024

Historic Market Size - Product Type Segment 2020 - 2024 ($ million)

5.6 Geography segment analysis 2020 - 2024

Historic Market Size - Geography Segment 2020 - 2024 ($ million)

5.7 Country segment analysis 2020 - 2024

Historic Market Size - Country Segment 2020 - 2024 ($ million)

6. Qualitative Analysis

6.1 Impact of AI on global human immunoglobulin market

6.2 Impact of geopolitical conflicts on global human immunoglobulin market

7. Five Forces Analysis

7.1 Five forces summary

Five forces analysis - Comparison between 2025 and 2030

7.2 Bargaining power of buyers

Bargaining power of buyers - Impact of key factors 2025 and 2030

7.3 Bargaining power of suppliers

Bargaining power of suppliers - Impact of key factors in 2025 and 2030

7.4 Threat of new entrants

Threat of new entrants - Impact of key factors in 2025 and 2030

7.5 Threat of substitutes

Threat of substitutes - Impact of key factors in 2025 and 2030

7.6 Threat of rivalry

Threat of rivalry - Impact of key factors in 2025 and 2030

7.7 Market condition

Chart on Market condition - Five forces 2025 and 2030

8. Market Segmentation by Application

8.1 Market segments

Chart on Application - Market share 2025-2030 (%)
Data Table on Application - Market share 2025-2030 (%)

8.2 Comparison by Application

Chart on Comparison by Application
Data Table on Comparison by Application

8.3 Autoimmune disorders - Market size and forecast 2025-2030

Chart on Autoimmune disorders - Market size and forecast 2025-2030 ($ million)
Data Table on Autoimmune disorders - Market size and forecast 2025-2030 ($ million)
Chart on Autoimmune disorders - Year-over-year growth 2025-2030 (%)
Data Table on Autoimmune disorders - Year-over-year growth 2025-2030 (%)

8.4 Hematology diseases - Market size and forecast 2025-2030

Chart on Hematology diseases - Market size and forecast 2025-2030 ($ million)
Data Table on Hematology diseases - Market size and forecast 2025-2030 ($ million)
Chart on Hematology diseases - Year-over-year growth 2025-2030 (%)
Data Table on Hematology diseases - Year-over-year growth 2025-2030 (%)

8.5 Inflammatory diseases - Market size and forecast 2025-2030

Chart on Inflammatory diseases - Market size and forecast 2025-2030 ($ million)
Data Table on Inflammatory diseases - Market size and forecast 2025-2030 ($ million)
Chart on Inflammatory diseases - Year-over-year growth 2025-2030 (%)
Data Table on Inflammatory diseases - Year-over-year growth 2025-2030 (%)

8.6 Infectious diseases - Market size and forecast 2025-2030

Chart on Infectious diseases - Market size and forecast 2025-2030 ($ million)
Data Table on Infectious diseases - Market size and forecast 2025-2030 ($ million)
Chart on Infectious diseases - Year-over-year growth 2025-2030 (%)
Data Table on Infectious diseases - Year-over-year growth 2025-2030 (%)

8.7 Others - Market size and forecast 2025-2030

Chart on Others - Market size and forecast 2025-2030 ($ million)
Data Table on Others - Market size and forecast 2025-2030 ($ million)
Chart on Others - Year-over-year growth 2025-2030 (%)
Data Table on Others - Year-over-year growth 2025-2030 (%)

8.8 Market opportunity by Application

Market opportunity by Application ($ million)
Data Table on Market opportunity by Application ($ million)

9. Market Segmentation by End-user

9.1 Market segments

Chart on End-user - Market share 2025-2030 (%)
Data Table on End-user - Market share 2025-2030 (%)

9.2 Comparison by End-user

Chart on Comparison by End-user
Data Table on Comparison by End-user

9.3 Hospitals - Market size and forecast 2025-2030

Chart on Hospitals - Market size and forecast 2025-2030 ($ million)
Data Table on Hospitals - Market size and forecast 2025-2030 ($ million)
Chart on Hospitals - Year-over-year growth 2025-2030 (%)
Data Table on Hospitals - Year-over-year growth 2025-2030 (%)

9.4 Clinics - Market size and forecast 2025-2030

Chart on Clinics - Market size and forecast 2025-2030 ($ million)
Data Table on Clinics - Market size and forecast 2025-2030 ($ million)
Chart on Clinics - Year-over-year growth 2025-2030 (%)
Data Table on Clinics - Year-over-year growth 2025-2030 (%)

9.5 ASCs - Market size and forecast 2025-2030

Chart on ASCs - Market size and forecast 2025-2030 ($ million)
Data Table on ASCs - Market size and forecast 2025-2030 ($ million)
Chart on ASCs - Year-over-year growth 2025-2030 (%)
Data Table on ASCs - Year-over-year growth 2025-2030 (%)

9.6 Market opportunity by End-user

Market opportunity by End-user ($ million)
Data Table on Market opportunity by End-user ($ million)

10. Market Segmentation by Form Factor

10.1 Market segments

Chart on Form Factor - Market share 2025-2030 (%)
Data Table on Form Factor - Market share 2025-2030 (%)

10.2 Comparison by Form Factor

Chart on Comparison by Form Factor
Data Table on Comparison by Form Factor

10.3 Liquid - Market size and forecast 2025-2030

Chart on Liquid - Market size and forecast 2025-2030 ($ million)
Data Table on Liquid - Market size and forecast 2025-2030 ($ million)
Chart on Liquid - Year-over-year growth 2025-2030 (%)
Data Table on Liquid - Year-over-year growth 2025-2030 (%)

10.4 Lyophilized - Market size and forecast 2025-2030

Chart on Lyophilized - Market size and forecast 2025-2030 ($ million)
Data Table on Lyophilized - Market size and forecast 2025-2030 ($ million)
Chart on Lyophilized - Year-over-year growth 2025-2030 (%)
Data Table on Lyophilized - Year-over-year growth 2025-2030 (%)

10.5 Market opportunity by Form Factor

Market opportunity by Form Factor ($ million)
Data Table on Market opportunity by Form Factor ($ million)

11. Market Segmentation by Product Type

11.1 Market segments

Chart on Product Type - Market share 2025-2030 (%)
Data Table on Product Type - Market share 2025-2030 (%)

11.2 Comparison by Product Type

Chart on Comparison by Product Type
Data Table on Comparison by Product Type

11.3 IVIG - Market size and forecast 2025-2030

Chart on IVIG - Market size and forecast 2025-2030 ($ million)
Data Table on IVIG - Market size and forecast 2025-2030 ($ million)
Chart on IVIG - Year-over-year growth 2025-2030 (%)
Data Table on IVIG - Year-over-year growth 2025-2030 (%)

11.4 SCIG - Market size and forecast 2025-2030

Chart on SCIG - Market size and forecast 2025-2030 ($ million)
Data Table on SCIG - Market size and forecast 2025-2030 ($ million)
Chart on SCIG - Year-over-year growth 2025-2030 (%)
Data Table on SCIG - Year-over-year growth 2025-2030 (%)

11.5 Market opportunity by Product Type

Market opportunity by Product Type ($ million)
Data Table on Market opportunity by Product Type ($ million)

12. Customer Landscape

12.1 Customer landscape overview

Analysis of price sensitivity, lifecycle, customer purchase basket, adoption rates, and purchase criteria

13. Geographic Landscape

13.1 Geographic segmentation

Chart on Market share by geography 2025-2030 (%)
Data Table on Market share by geography 2025-2030 (%)

13.2 Geographic comparison

Chart on Geographic comparison
Data Table on Geographic comparison

13.3 North America - Market size and forecast 2025-2030

Chart on North America - Market size and forecast 2025-2030 ($ million)
Data Table on North America - Market size and forecast 2025-2030 ($ million)
Chart on North America - Year-over-year growth 2025-2030 (%)
Data Table on North America - Year-over-year growth 2025-2030 (%)
Chart on Regional Comparison - North America
Data Table on Regional Comparison - North America

13.3.1 US - Market size and forecast 2025-2030

Chart on US - Market size and forecast 2025-2030 ($ million)
Data Table on US - Market size and forecast 2025-2030 ($ million)
Chart on US - Year-over-year growth 2025-2030 (%)
Data Table on US - Year-over-year growth 2025-2030 (%)

13.3.2 Canada - Market size and forecast 2025-2030

Chart on Canada - Market size and forecast 2025-2030 ($ million)
Data Table on Canada - Market size and forecast 2025-2030 ($ million)
Chart on Canada - Year-over-year growth 2025-2030 (%)
Data Table on Canada - Year-over-year growth 2025-2030 (%)

13.3.3 Mexico - Market size and forecast 2025-2030

Chart on Mexico - Market size and forecast 2025-2030 ($ million)
Data Table on Mexico - Market size and forecast 2025-2030 ($ million)
Chart on Mexico - Year-over-year growth 2025-2030 (%)
Data Table on Mexico - Year-over-year growth 2025-2030 (%)

13.4 Europe - Market size and forecast 2025-2030

Chart on Europe - Market size and forecast 2025-2030 ($ million)
Data Table on Europe - Market size and forecast 2025-2030 ($ million)
Chart on Europe - Year-over-year growth 2025-2030 (%)
Data Table on Europe - Year-over-year growth 2025-2030 (%)
Chart on Regional Comparison - Europe
Data Table on Regional Comparison - Europe

13.4.1 Germany - Market size and forecast 2025-2030

Chart on Germany - Market size and forecast 2025-2030 ($ million)
Data Table on Germany - Market size and forecast 2025-2030 ($ million)
Chart on Germany - Year-over-year growth 2025-2030 (%)
Data Table on Germany - Year-over-year growth 2025-2030 (%)

13.4.2 France - Market size and forecast 2025-2030

Chart on France - Market size and forecast 2025-2030 ($ million)
Data Table on France - Market size and forecast 2025-2030 ($ million)
Chart on France - Year-over-year growth 2025-2030 (%)
Data Table on France - Year-over-year growth 2025-2030 (%)

13.4.3 UK - Market size and forecast 2025-2030

Chart on UK - Market size and forecast 2025-2030 ($ million)
Data Table on UK - Market size and forecast 2025-2030 ($ million)
Chart on UK - Year-over-year growth 2025-2030 (%)
Data Table on UK - Year-over-year growth 2025-2030 (%)

13.4.4 Italy - Market size and forecast 2025-2030

Chart on Italy - Market size and forecast 2025-2030 ($ million)
Data Table on Italy - Market size and forecast 2025-2030 ($ million)
Chart on Italy - Year-over-year growth 2025-2030 (%)
Data Table on Italy - Year-over-year growth 2025-2030 (%)

13.4.5 Spain - Market size and forecast 2025-2030

Chart on Spain - Market size and forecast 2025-2030 ($ million)
Data Table on Spain - Market size and forecast 2025-2030 ($ million)
Chart on Spain - Year-over-year growth 2025-2030 (%)
Data Table on Spain - Year-over-year growth 2025-2030 (%)

13.4.6 Russia - Market size and forecast 2025-2030

Chart on Russia - Market size and forecast 2025-2030 ($ million)
Data Table on Russia - Market size and forecast 2025-2030 ($ million)
Chart on Russia - Year-over-year growth 2025-2030 (%)
Data Table on Russia - Year-over-year growth 2025-2030 (%)

13.5 Asia - Market size and forecast 2025-2030

Chart on Asia - Market size and forecast 2025-2030 ($ million)
Data Table on Asia - Market size and forecast 2025-2030 ($ million)
Chart on Asia - Year-over-year growth 2025-2030 (%)
Data Table on Asia - Year-over-year growth 2025-2030 (%)
Chart on Regional Comparison - Asia
Data Table on Regional Comparison - Asia

13.5.1 China - Market size and forecast 2025-2030

Chart on China - Market size and forecast 2025-2030 ($ million)
Data Table on China - Market size and forecast 2025-2030 ($ million)
Chart on China - Year-over-year growth 2025-2030 (%)
Data Table on China - Year-over-year growth 2025-2030 (%)

13.5.2 Japan - Market size and forecast 2025-2030

Chart on Japan - Market size and forecast 2025-2030 ($ million)
Data Table on Japan - Market size and forecast 2025-2030 ($ million)
Chart on Japan - Year-over-year growth 2025-2030 (%)
Data Table on Japan - Year-over-year growth 2025-2030 (%)

13.5.3 India - Market size and forecast 2025-2030

Chart on India - Market size and forecast 2025-2030 ($ million)
Data Table on India - Market size and forecast 2025-2030 ($ million)
Chart on India - Year-over-year growth 2025-2030 (%)
Data Table on India - Year-over-year growth 2025-2030 (%)

13.5.4 South Korea - Market size and forecast 2025-2030

Chart on South Korea - Market size and forecast 2025-2030 ($ million)
Data Table on South Korea - Market size and forecast 2025-2030 ($ million)
Chart on South Korea - Year-over-year growth 2025-2030 (%)
Data Table on South Korea - Year-over-year growth 2025-2030 (%)

13.5.5 Thailand - Market size and forecast 2025-2030

Chart on Thailand - Market size and forecast 2025-2030 ($ million)
Data Table on Thailand - Market size and forecast 2025-2030 ($ million)
Chart on Thailand - Year-over-year growth 2025-2030 (%)
Data Table on Thailand - Year-over-year growth 2025-2030 (%)

13.5.6 Taiwan - Market size and forecast 2025-2030

Chart on Taiwan - Market size and forecast 2025-2030 ($ million)
Data Table on Taiwan - Market size and forecast 2025-2030 ($ million)
Chart on Taiwan - Year-over-year growth 2025-2030 (%)
Data Table on Taiwan - Year-over-year growth 2025-2030 (%)

13.6 Rest of World (ROW) - Market size and forecast 2025-2030

Chart on Rest of World (ROW) - Market size and forecast 2025-2030 ($ million)
Data Table on Rest of World (ROW) - Market size and forecast 2025-2030 ($ million)
Chart on Rest of World (ROW) - Year-over-year growth 2025-2030 (%)
Data Table on Rest of World (ROW) - Year-over-year growth 2025-2030 (%)
Chart on Regional Comparison - Rest of World (ROW)
Data Table on Regional Comparison - Rest of World (ROW)

13.6.1 Brazil - Market size and forecast 2025-2030

Chart on Brazil - Market size and forecast 2025-2030 ($ million)
Data Table on Brazil - Market size and forecast 2025-2030 ($ million)
Chart on Brazil - Year-over-year growth 2025-2030 (%)
Data Table on Brazil - Year-over-year growth 2025-2030 (%)

13.6.2 Australia - Market size and forecast 2025-2030

Chart on Australia - Market size and forecast 2025-2030 ($ million)
Data Table on Australia - Market size and forecast 2025-2030 ($ million)
Chart on Australia - Year-over-year growth 2025-2030 (%)
Data Table on Australia - Year-over-year growth 2025-2030 (%)

13.6.3 Saudi Arabia - Market size and forecast 2025-2030

Chart on Saudi Arabia - Market size and forecast 2025-2030 ($ million)
Data Table on Saudi Arabia - Market size and forecast 2025-2030 ($ million)
Chart on Saudi Arabia - Year-over-year growth 2025-2030 (%)
Data Table on Saudi Arabia - Year-over-year growth 2025-2030 (%)

13.6.4 South Africa - Market size and forecast 2025-2030

Chart on South Africa - Market size and forecast 2025-2030 ($ million)
Data Table on South Africa - Market size and forecast 2025-2030 ($ million)
Chart on South Africa - Year-over-year growth 2025-2030 (%)
Data Table on South Africa - Year-over-year growth 2025-2030 (%)

13.6.5 Argentina - Market size and forecast 2025-2030

Chart on Argentina - Market size and forecast 2025-2030 ($ million)
Data Table on Argentina - Market size and forecast 2025-2030 ($ million)
Chart on Argentina - Year-over-year growth 2025-2030 (%)
Data Table on Argentina - Year-over-year growth 2025-2030 (%)

13.6.6 UAE - Market size and forecast 2025-2030

Chart on UAE - Market size and forecast 2025-2030 ($ million)
Data Table on UAE - Market size and forecast 2025-2030 ($ million)
Chart on UAE - Year-over-year growth 2025-2030 (%)
Data Table on UAE - Year-over-year growth 2025-2030 (%)

13.6.7 Chile - Market size and forecast 2025-2030

Chart on Chile - Market size and forecast 2025-2030 ($ million)
Data Table on Chile - Market size and forecast 2025-2030 ($ million)
Chart on Chile - Year-over-year growth 2025-2030 (%)
Data Table on Chile - Year-over-year growth 2025-2030 (%)

13.6.8 Turkey - Market size and forecast 2025-2030

Chart on Turkey - Market size and forecast 2025-2030 ($ million)
Data Table on Turkey - Market size and forecast 2025-2030 ($ million)
Chart on Turkey - Year-over-year growth 2025-2030 (%)
Data Table on Turkey - Year-over-year growth 2025-2030 (%)

13.7 Market opportunity by geography

Market opportunity by geography ($ million)
Data Tables on Market opportunity by geography ($ million)

14. Drivers, Challenges, and Opportunity

14.1 Market drivers

Rising prevalence of immunodeficiency and autoimmune disorders
Advancements in plasma collection and fractionation technologies
Shift toward patient-centric delivery modalities

14.2 Market challenges

Dependence on human plasma supply constraints
Complex regulatory requirements and quality standards
High manufacturing costs and reimbursement pressures

14.3 Impact of drivers and challenges

Impact of drivers and challenges in 2025 and 2030

14.4 Market opportunities

Shift toward patient-centric home-based administration
Expansion of clinical indications and precision medicine
Innovations in plasma collection and manufacturing efficiency

15. Competitive Landscape

15.1 Overview

15.2

Overview on criticality of inputs and factors of differentiation

15.3 Landscape disruption

Overview on factors of disruption

15.4 Industry risks

Impact of key risks on business

16. Competitive Analysis

16.1 Companies profiled

Companies covered

16.2 Company ranking index

16.3 Market positioning of companies

Matrix on companies position and classification

16.4 ADMA Biologics Inc.

ADMA Biologics Inc. - Overview
ADMA Biologics Inc. - Business segments
ADMA Biologics Inc. - Key offerings
ADMA Biologics Inc. - Segment focus
SWOT

16.5 Bharat Serums and Vaccines Ltd.

Bharat Serums and Vaccines Ltd. - Overview
Bharat Serums and Vaccines Ltd. - Product / Service
Bharat Serums and Vaccines Ltd. - Key offerings
SWOT

16.6 Boya Bio pharmaceutical Group

Boya Bio pharmaceutical Group - Overview
Boya Bio pharmaceutical Group - Product / Service
Boya Bio pharmaceutical Group - Key offerings
SWOT

16.7 CSL Behring

CSL Behring - Overview
CSL Behring - Product / Service
CSL Behring - Key offerings
SWOT

16.8 Emergent BioSolutions Inc.

Emergent BioSolutions Inc. - Overview
Emergent BioSolutions Inc. - Product / Service
Emergent BioSolutions Inc. - Key offerings
SWOT

16.9 GC Biopharma Corp.

GC Biopharma Corp. - Overview
GC Biopharma Corp. - Business segments
GC Biopharma Corp. - Key offerings
GC Biopharma Corp. - Segment focus
SWOT

16.10 Grifols SA

Grifols SA - Overview
Grifols SA - Business segments
Grifols SA - Key offerings
Grifols SA - Segment focus
SWOT

16.11 Hualan Biological Engineering Inc

Hualan Biological Engineering Inc - Overview
Hualan Biological Engineering Inc - Business segments
Hualan Biological Engineering Inc - Key offerings
Hualan Biological Engineering Inc - Segment focus
SWOT

16.12 Intas Pharmaceuticals Ltd.

Intas Pharmaceuticals Ltd. - Overview
Intas Pharmaceuticals Ltd. - Product / Service
Intas Pharmaceuticals Ltd. - Key offerings
SWOT

16.13 Kamada Ltd.

Kamada Ltd. - Overview
Kamada Ltd. - Business segments
Kamada Ltd. - Key offerings
Kamada Ltd. - Segment focus
SWOT

16.14 LFB SA

LFB SA - Overview
LFB SA - Product / Service
LFB SA - Key offerings
SWOT

16.15 SK Plasma Co. Ltd.

SK Plasma Co. Ltd. - Overview
SK Plasma Co. Ltd. - Product / Service
SK Plasma Co. Ltd. - Key offerings
SWOT

16.16 Taibang Biological Group Co. Ltd.

Taibang Biological Group Co. Ltd. - Overview
Taibang Biological Group Co. Ltd. - Product / Service
Taibang Biological Group Co. Ltd. - Key offerings
SWOT

16.17 Takeda Pharmaceutical Ltd.

Takeda Pharmaceutical Ltd. - Overview
Takeda Pharmaceutical Ltd. - Business segments
Takeda Pharmaceutical Ltd. - Key news
Takeda Pharmaceutical Ltd. - Key offerings
Takeda Pharmaceutical Ltd. - Segment focus
SWOT

16.18 Virchow Biotech Pvt. Ltd.

Virchow Biotech Pvt. Ltd. - Overview
Virchow Biotech Pvt. Ltd. - Product / Service
Virchow Biotech Pvt. Ltd. - Key offerings
SWOT

17. Appendix

17.1 Scope of the report

Market definition
Objectives
Notes and caveats

17.2 Inclusions and exclusions checklist

Inclusions checklist
Exclusions checklist

17.3 Currency conversion rates for US$

17.4 Research methodology

17.5 Data procurement

Information sources

17.6 Data validation

17.7 Validation techniques employed for market sizing

17.8 Data synthesis

17.9 360 degree market analysis

17.10 List of abbreviations

Research Methodology

Technavio presents a detailed picture of the market by way of study, synthesis, and summation of data from multiple sources. The analysts have presented the various facets of the market with a particular focus on identifying the key industry influencers. The data thus presented is comprehensive, reliable, and the result of extensive research, both primary and secondary.

INFORMATION SOURCES

Primary sources

  • Manufacturers and suppliers
  • Channel partners
  • Industry experts
  • Strategic decision makers

Secondary sources

  • Industry journals and periodicals
  • Government data
  • Financial reports of key industry players
  • Historical data
  • Press releases

DATA ANALYSIS

Data Synthesis

  • Collation of data
  • Estimation of key figures
  • Analysis of derived insights

Data Validation

  • Triangulation with data models
  • Reference against proprietary databases
  • Corroboration with industry experts

REPORT WRITING

Qualitative

  • Market drivers
  • Market challenges
  • Market trends
  • Five forces analysis

Quantitative

  • Market size and forecast
  • Market segmentation
  • Geographical insights
  • Competitive landscape

Interested in this report?

Get your sample now to see our research methodology and insights!

Download Now

Frequently Asked Questions

Human Immunoglobulin market growth will increase by USD 6853.6 million during 2026-2030.

The Human Immunoglobulin market is expected to grow at a CAGR of 6.5% during 2026-2030.

Human Immunoglobulin market is segmented by Application (Autoimmune disorders, Hematology diseases, Inflammatory diseases, Infectious diseases, Others) End-user (Hospitals, Clinics, ASCs) Form factor (Liquid, Lyophilized) Product type (IVIG, SCIG)

ADMA Biologics Inc., Bharat Serums and Vaccines Ltd., Boya Bio pharmaceutical Group, CSL Behring, Emergent BioSolutions Inc., GC Biopharma Corp., Grifols SA, Hualan Biological Engineering Inc, Intas Pharmaceuticals Ltd., Kamada Ltd., Kedrion SpA, KM Biologics Co. Ltd., LFB SA, Octapharma AG, Prothya Biosolutions, RAAS Corp., Reliance Life Sciences Pvt. Ltd., SK Plasma Co. Ltd., Taibang Biological Group Co. Ltd., Takeda Pharmaceutical Ltd., Virchow Biotech Pvt. Ltd. are a few of the key vendors in the Human Immunoglobulin market.

North America will register the highest growth rate of 37.4% among the other regions. Therefore, the Human Immunoglobulin market in North America is expected to garner significant business opportunities for the vendors during the forecast period.

US, Canada, Mexico, Germany, France, UK, Italy, Spain, Russia, China, Japan, India, South Korea, Thailand, Taiwan, Brazil, Australia, Saudi Arabia, South Africa, Argentina, UAE, Chile, Turkey

  • Rising prevalence of immunodeficiency and autoimmune disorders is the driving factor this market.

The Human Immunoglobulin market vendors should focus on grabbing business opportunities from the Application segment as it accounted for the largest market share in the base year.
RIA - Research AI Assistant
Ask RIA
