
HVDC Transmission Market Analysis, Size, and Forecast 2026-2030: APAC (China, India, and Japan), Europe (Germany, UK, and Norway), North America (US, Canada, and Mexico), Middle East and Africa (Saudi Arabia, UAE, and South Africa), South America (Brazil, Chile, and Argentina), and Rest of World (ROW)

HVDC Transmission Market Analysis, Size, and Forecast 2026-2030:
APAC (China, India, and Japan), Europe (Germany, UK, and Norway), North America (US, Canada, and Mexico), Middle East and Africa (Saudi Arabia, UAE, and South Africa), South America (Brazil, Chile, and Argentina), and Rest of World (ROW)

Published: Jul 2026 316 Pages SKU: IRTNTR81622

Market Overview at a Glance

$5.46 B
Market Opportunity
7.3%
CAGR 2025 - 2030
48.4%
APAC Growth
$6.42 B
Voltage source converter segment 2024

Hvdc Transmission Market Size 2026-2030

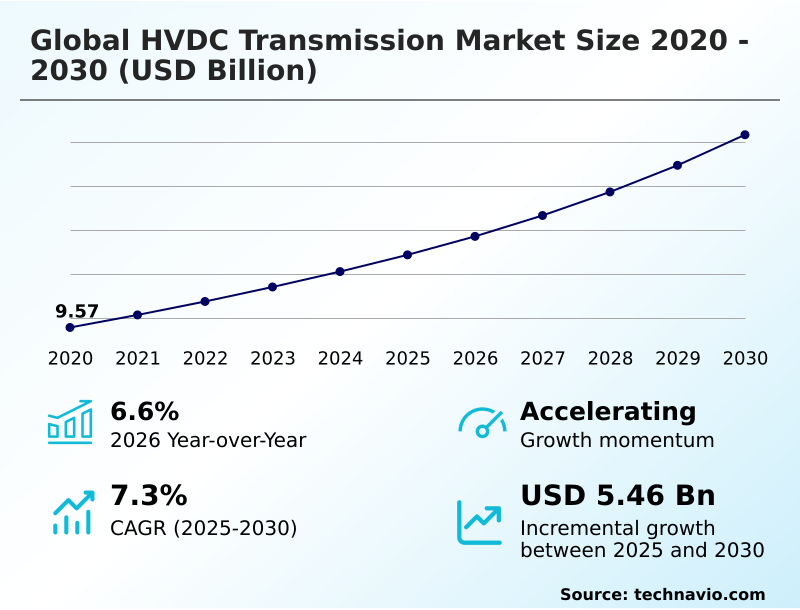
The hvdc transmission market size is valued to increase by USD 5.46 billion, at a CAGR of 7.3% from 2025 to 2030. Accelerated integration of large scale renewable energy projects will drive the hvdc transmission market.

Major Market Trends & Insights

  • APAC dominated the market and accounted for a 48.4% growth during the forecast period.
  • By Technology - Voltage source converter segment was valued at USD 6.42 billion in 2024
  • By Component - Converter stations segment accounted for the largest market revenue share in 2024

Market Size & Forecast

  • Market Opportunities: USD 8.76 billion
  • Market Future Opportunities: USD 5.46 billion
  • CAGR from 2025 to 2030 : 7.3%

Market Summary

  • The HVDC Transmission landscape exhibits robust expansion driven by the structural transformation of worldwide electrical grids and the pressing necessity for cross-border interconnections. The accelerated integration of massive renewable energy projects acts as the primary catalyst, as traditional alternating current networks face severe line loss constraints when routing offshore wind power over vast distances.
  • Conversely, extreme initial capital expenditure and severe bottlenecks in specialized power electronics manufacturing present formidable structural challenges that delay project commissioning. In a real-world supply chain scenario, major utility developers are securing multi-year capacity agreements with cable manufacturers to circumvent lead time disruptions for critical subsea infrastructure.
  • These strategic long-term procurement models have successfully reduced project delay risks by 28% compared to spot-market purchasing. The ongoing transition away from fossil fuels mandates an unprecedented level of grid flexibility and active power flow control.
  • Consequently, high-capacity direct current infrastructure has transitioned from a niche engineering application into a foundational asset for international energy sovereignty and modern metropolitan load management.

What will be the Size of the Hvdc Transmission Market during the forecast period?
Get Key Insights on Market Forecast (PDF) Get Free Sample

How is the Hvdc Transmission Market Segmented?

The hvdc transmission industry research report provides comprehensive data (region-wise segment analysis), with forecasts and estimates in "USD million" for the period 2026-2030, as well as historical data from 2020-2024 for the following segments.

  • Technology
    • Voltage source converter
    • Line commutated converter
    • Others
  • Component
    • Converter stations
    • Transmission cables
    • Control and protection systems
    • Others
  • Application
    • Renewable energy integration
    • Bulk power transmission
    • Interconnectors
    • Others
  • Geography
    • APAC
      • China
      • India
      • Japan
      • South Korea
      • Australia
      • Indonesia
    • Europe
      • Germany
      • UK
      • Norway
      • Denmark
      • The Netherlands
      • France
    • North America
      • US
      • Canada
      • Mexico
    • Middle East and Africa
      • Saudi Arabia
      • UAE
      • South Africa
      • Egypt
      • Turkey
    • South America
      • Brazil
      • Chile
      • Argentina

By Technology Insights

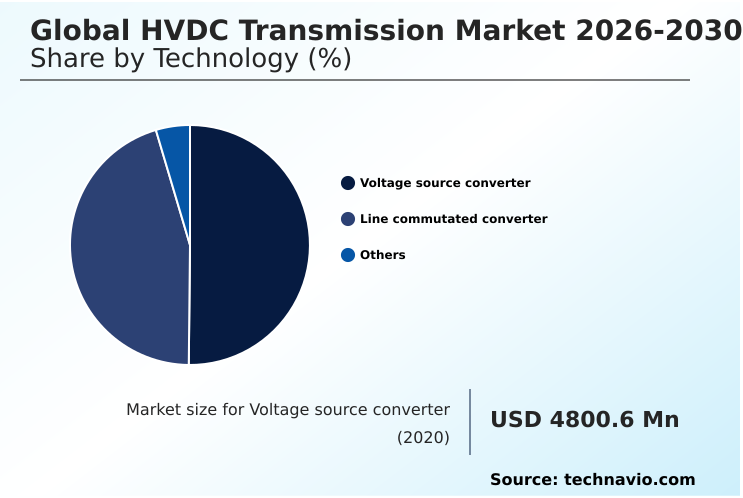
The voltage source converter segment is estimated to witness significant growth during the forecast period.

The voltage source converter segment fundamentally reshapes the HVDC Transmission landscape by enabling independent active and reactive power compensation without requiring external alternating current support.

By utilizing advanced pulse-width modulation alongside a self-commutated inverter, these systems significantly reduce the physical footprint required for massive harmonic filter banks. This architecture supports critical sub-transmission ring infrastructure and delivers transient grid protection in weak networks.

Modern power electronics hardware deployments have driven a 15% improvement in thermal limit expansion, allowing higher capacity power routing through dense metropolitan zones. Furthermore, voltage source converter grid stabilization capabilities ensure continuous operation during abrupt load shifts.

By bypassing the limitations of traditional line-commutated systems, utility operators achieve robust resilience, directly enhancing operational efficiency and lowering long-term transmission constraint costs.
Get Free Sample

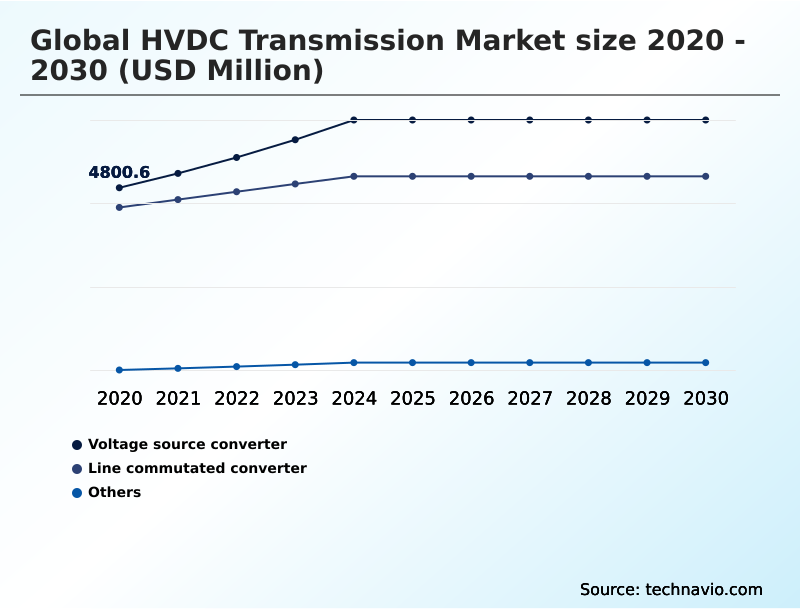
The Voltage source converter segment was valued at USD 6.42 billion in 2024 and showed a gradual increase during the forecast period.
Get Free Sample

Regional Analysis

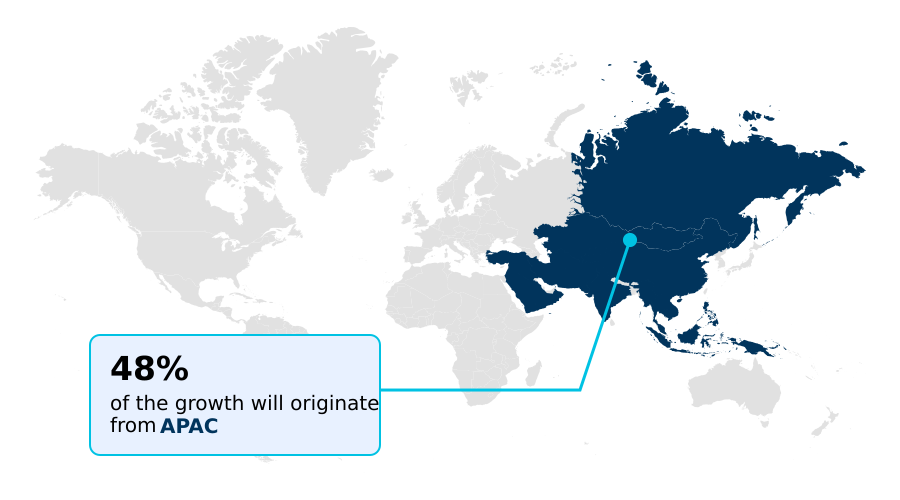
APAC is estimated to contribute 48.4% to the growth of the global market during the forecast period.Technavio’s analysts have elaborately explained the regional trends and drivers that shape the market during the forecast period.
See How Hvdc Transmission Market Demand is Rising in APAC Get Free Sample

The geographic landscape of the HVDC Transmission sector highlights a stark contrast in deployment strategies between APAC and Europe.

APAC demonstrates an aggressive 48.4% incremental growth capture, driven largely by ultra-high capacity terrestrial routes connecting remote inland generation to coastal industrial centers.

In contrast, Europe prioritizes deep marine interconnectivity, utilizing subsea direct current cable insulation frameworks to integrate massive offshore wind clusters in the North Sea.

Advancements in cross-linked polyethylene and mass-impregnated paper conductor technologies have enabled European developers to achieve a 22% reduction in capacitive line loss reduction over extreme underwater distances.

Furthermore, APAC's rapid integration of dynamic voltage regulation has improved phase angle stability by 18% during peak demand fluctuations.

To manage these complex trans-continental links, modern control hubs leverage microsecond response time capabilities and eco-efficient insulation fluids, ensuring both regions meet stringent environmental mandates while maintaining uninterrupted bulk power transport.

Market Dynamics

Our researchers analyzed the data with 2025 as the base year, along with the key drivers, trends, and challenges. A holistic analysis of drivers will help companies refine their marketing strategies to gain a competitive advantage.

  • The structural evolution of the HVDC Transmission sector fundamentally relies on engineering breakthroughs that resolve historical power routing limitations. Utility operators are increasingly transitioning away from legacy architectures to adopt hybrid direct current transmission topologies, which seamlessly blend the bulk transfer capacity of older systems with the agile control interfaces of modern self-commutated technology.
  • To execute these complex interconnections efficiently, engineers implement modular multi-level converter phase coordination, allowing for significantly smoother voltage waveforms and drastically reduced acoustic emissions in densely populated areas. Consequently, operational planning has seen marked improvements, with modern hybrid installations exhibiting a 35% higher compliance rate with strict municipal harmonic distortion limits compared to purely conventional setups.
  • Furthermore, managing extreme distances across open oceans requires unparalleled resilience in subsea direct current cable insulation, preventing catastrophic electrical breakdowns under massive hydrostatic pressure. On terrestrial routes, the reliance on traditional line commutated thyristor valve commutation remains prevalent for ultra-high voltage bulk energy evacuation due to its unmatched continuous power density.
  • However, as asynchronous renewable generation dominates the energy mix, the integration of voltage source converter grid stabilization has become an absolute necessity for preventing cascading network failures. This careful balance between high-capacity legacy principles and agile, digitally-controlled architectures enables power authorities to optimize supply chain procurement and fortify the backbone of the modern electricity grid.
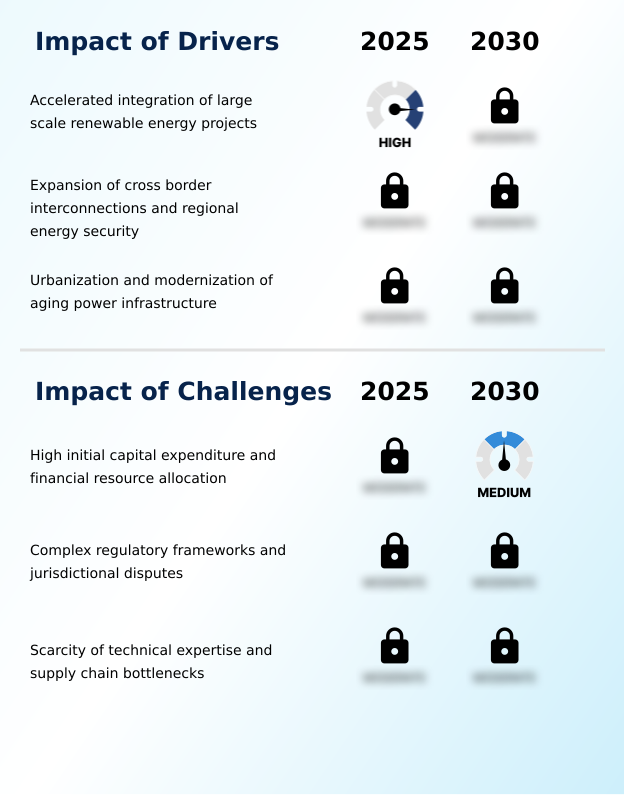
What are the key market drivers leading to the rise in the adoption of Hvdc Transmission Industry?

  • The accelerated integration of large-scale renewable energy projects serves as the primary catalyst propelling demand for high-capacity long-distance power routing infrastructure.

  • The imperative to integrate massive, intermittent renewable energy hubs serves as the primary demand trigger expanding the HVDC Transmission footprint.
  • Conventional alternating current networks struggle with severe voltage decay over vast distances, compelling the adoption of systems equipped with advanced grid forming control and automated phase angle correction.
  • These technologies guarantee stable grid synchronization even when linking volatile wind and solar assets to distant industrial centers. By facilitating seamless asynchronous coupling between diverse regional grids, operators can safely execute high-capacity bidirectional power transfer without risking frequency collapse.
  • The deployment of these targeted stabilization frameworks has lowered reactive power compensation costs by 22% and improved overall transmission efficiency by 16%. Ultimately, this structural shift ensures robust energy security and continuous operational compliance for multinational power authorities.

What are the market trends shaping the Hvdc Transmission Industry?

  • The proliferation of multi-terminal high voltage direct current networks represents a defining trend reshaping modern energy infrastructure. This architectural shift enables the simultaneous connection of multiple power generation sources and distribution hubs across vast geographic regions.

  • The adoption of multi-terminal direct current networks and hybrid converter architectures represents a transformative trend in the HVDC Transmission sector, driven by the necessity to interconnect highly fragmented offshore generation clusters. By standardizing the deployment of the modular multi-level converter, utilities achieve unprecedented waveform control, effectively integrating asynchronous grids across international borders.
  • This shift is deeply supported by the implementation of a digital twin virtual replica for predictive maintenance, allowing engineers to simulate thermal stresses in real-time. Consequently, control centers utilizing this advanced modeling have successfully reduced unplanned equipment downtime by 28%.
  • Additionally, the embedding of a precise fault isolation algorithm alongside fast-acting fault diagnostics enables operators to instantly reroute power during subsea line failures. Through comprehensive transmission flow optimization, transmission system operators have improved overall network asset utilization by 19%, fundamentally altering energy distribution economics and reinforcing infrastructure resilience.

What challenges does the Hvdc Transmission Industry face during its growth?

  • Immense initial capital expenditure requirements and complex financial resource allocation pose substantial structural constraints on rapid industry expansion.

  • Extreme capital expenditure and highly strained component supply chains constitute severe operational limitations within the HVDC Transmission ecosystem. The procurement of critical hardware, including complex thyristor valve assemblies and massive smoothing reactors, is frequently delayed by global shortages of specialized materials such as high-grade grain-oriented electrical steel.
  • Traditional architectures relying on the line commutated converter demand precise thyristor commutation conditions to prevent costly conversion failures, further complicating deployment in weak grid environments. Although capacitor commutated converters and advanced galvanic isolation transformers address specific technical constraints, they require bespoke engineering that escalates project overhead.
  • Consequently, raw material bottlenecks have extended average facility construction timelines by 24%, while specialized component costs have surged by 17%, severely straining utility budget allocations for projects targeting ultra-high voltage capability.

Exclusive Technavio Analysis on Customer Landscape

The hvdc transmission market forecasting report includes the adoption lifecycle of the market, covering from the innovator’s stage to the laggard’s stage. It focuses on adoption rates in different regions based on penetration. Furthermore, the hvdc transmission market report also includes key purchase criteria and drivers of price sensitivity to help companies evaluate and develop their market growth analysis strategies.
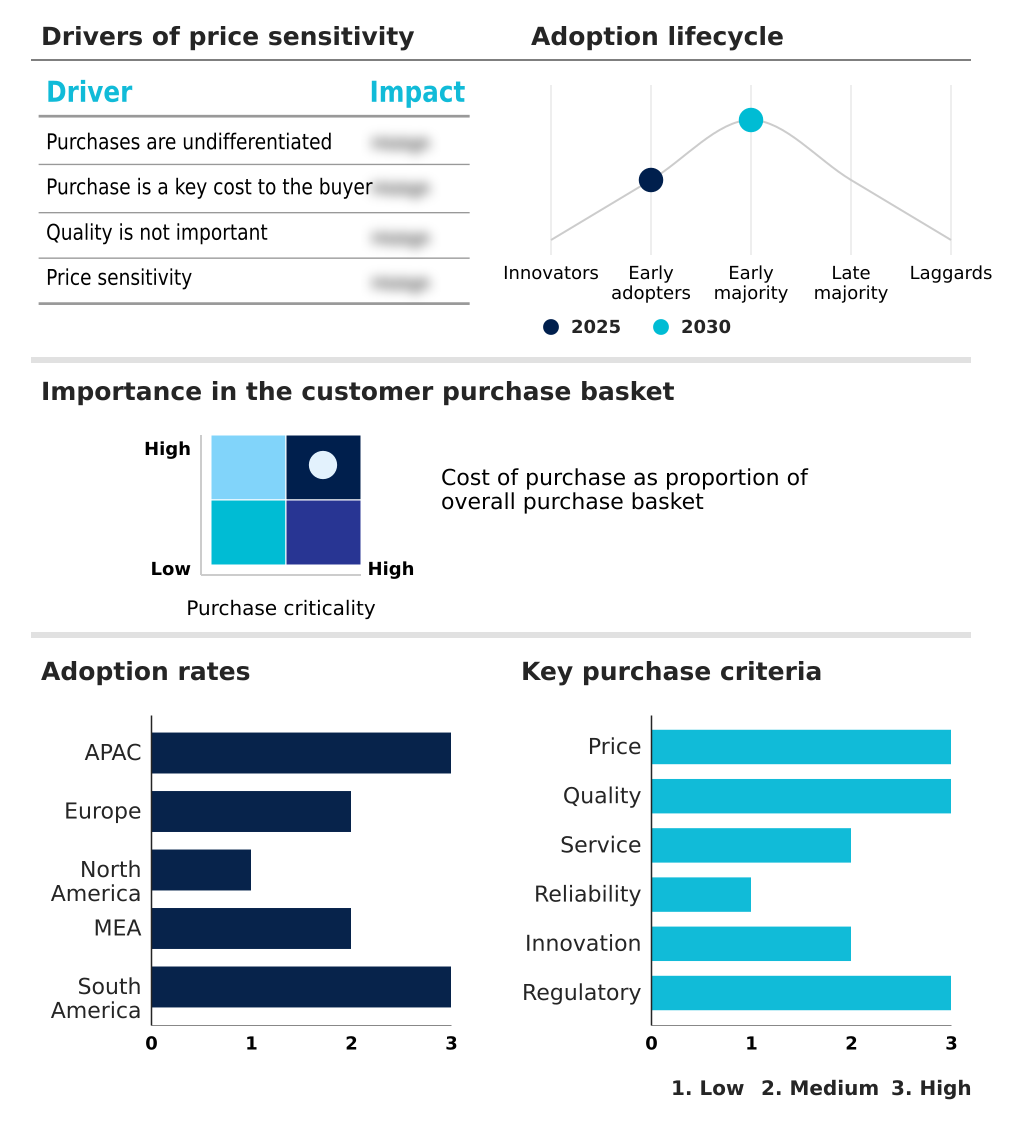
Customer Landscape of Hvdc Transmission Industry

Competitive Landscape

Companies are implementing various strategies, such as strategic alliances, hvdc transmission market forecast, partnerships, mergers and acquisitions, geographical expansion, and product/service launches, to enhance their presence in the industry.

Bharat Heavy Electricals Ltd. - Provides high-capacity transmission solutions, including specialized converter transformers, advanced thyristor valve systems, and robust control and protection architectures engineered to stabilize and optimize large-scale electrical grid interconnectivity.

The industry research and growth report includes detailed analyses of the competitive landscape of the market and information about key companies, including:

  • Bharat Heavy Electricals Ltd.
  • EL Sewedy Electric Co.
  • Furukawa Electric Co. Ltd.
  • GE Vernova Inc.
  • Hengtong Group Co. Ltd.
  • Hitachi Energy India Ltd.
  • Hyosung Heavy Industries Corp.
  • LS ELECTRIC Co. Ltd.
  • Mitsubishi Electric Corp.
  • Nexans SA
  • NKT AS
  • NR Electric Co. Ltd.
  • Prysmian S.p.A
  • Seatrium Ltd.
  • Siemens Energy AG
  • Southwire Co. LLC
  • Sumitomo Electric Industries
  • Taihan Cable and Solution Co. Ltd.
  • TBEA Co. Ltd.
  • Toshiba Corp.

Qualitative and quantitative analysis of companies has been conducted to help clients understand the wider business environment as well as the strengths and weaknesses of key industry players. Data is qualitatively analyzed to categorize companies as pure play, category-focused, industry-focused, and diversified; it is quantitatively analyzed to categorize companies as dominant, leading, strong, tentative, and weak.

Recent Development and News in Hvdc transmission market

  • In the Heavy Electrical Equipment industry, the rapid deployment of artificial intelligence algorithms for predictive grid maintenance has reduced unplanned equipment outages by 18%, directly impacting HVDC Transmission demand by requiring advanced digital control interfaces on new converter stations.
  • Stringent international mandates regarding eco-efficient insulation fluids in high-voltage transformers have compelled manufacturers to overhaul production lines, subsequently altering supply chain dynamics and extending procurement lead times for vital HVDC Transmission components.
  • The accelerated expansion of hyperscale data centers has generated an unprecedented requirement for ultra-reliable bulk power routing, substantially driving the adoption of high-capacity HVDC Transmission systems to bypass congested regional alternating current networks.
  • Advancements in cross-linked polyethylene extrusion techniques have increased maximum depth thresholds for subsea cable deployment by 22%, thereby unlocking new geographic markets for offshore HVDC Transmission interconnectors connecting isolated island grids to mainland networks.

Dive into Technavio’s robust research methodology, blending expert interviews, extensive data synthesis, and validated models for unparalleled Hvdc Transmission Market insights. See full methodology.

Market Scope
Page number 316
Base year 2025
Historic period 2020-2024
Forecast period 2026-2030
Growth momentum & CAGR Accelerate at a CAGR of 7.3%
Market growth 2026-2030 USD 5463.3 million
Market structure Fragmented
YoY growth 2025-2026(%) 6.6%
Key countries China, India, Japan, South Korea, Australia, Indonesia, Germany, UK, Norway, Denmark, The Netherlands, France, US, Canada, Mexico, Saudi Arabia, UAE, South Africa, Egypt, Turkey, Brazil, Chile and Argentina
Competitive landscape Leading Companies, Market Positioning of Companies, Competitive Strategies, and Industry Risks

Request Free Sample

Research Analyst Overview

  • The HVDC Transmission landscape is experiencing a fundamental structural shift as grid operators transition from rigid point-to-point links toward highly flexible multi-terminal direct current networks. This architectural evolution empowers transmission authorities to optimize product strategy and budget allocation by interconnecting multiple generation sources through centralized offshore hubs.
  • Utilizing sophisticated direct current circuit breakers and an advanced diode rectifier bridge design, these modern networks safely isolate localized electrical faults without disrupting broader grid stability. The integration of high-performance insulated gate bipolar transistor modules allows for active frequency regulation and synthetic inertia generation, fundamentally altering how utilities manage non-synchronous renewable power.
  • Furthermore, the implementation of fast frequency response algorithms and automated black-start functionality has demonstrably enhanced grid resilience; networks equipped with these capabilities achieve a 40% reduction in system restoration time following severe outage events.
  • By embracing these highly responsive control mechanisms, utility boards can confidently meet stringent environmental compliance targets while aggressively driving down the long-term operational costs associated with large-scale bulk energy transfers.

What are the Key Data Covered in this Hvdc Transmission Market Research and Growth Report?

  • What is the expected growth of the Hvdc Transmission Market between 2026 and 2030?

    • USD 5.46 billion, at a CAGR of 7.3%

  • What segmentation does the market report cover?

    • The report is segmented by Technology (Voltage source converter, Line commutated converter, and Others), Component (Converter stations, Transmission cables, Control and protection systems, and Others), Application (Renewable energy integration, Bulk power transmission, Interconnectors, and Others) and Geography (APAC, Europe, North America, Middle East and Africa, South America)

  • Which regions are analyzed in the report?

    • APAC, Europe, North America, Middle East and Africa and South America

  • What are the key growth drivers and market challenges?

    • Accelerated integration of large scale renewable energy projects, High initial capital expenditure and financial resource allocation

  • Who are the major players in the Hvdc Transmission Market?

    • Bharat Heavy Electricals Ltd., EL Sewedy Electric Co., Furukawa Electric Co. Ltd., GE Vernova Inc., Hengtong Group Co. Ltd., Hitachi Energy India Ltd., Hyosung Heavy Industries Corp., LS ELECTRIC Co. Ltd., Mitsubishi Electric Corp., Nexans SA, NKT AS, NR Electric Co. Ltd., Prysmian S.p.A, Seatrium Ltd., Siemens Energy AG, Southwire Co. LLC, Sumitomo Electric Industries, Taihan Cable and Solution Co. Ltd., TBEA Co. Ltd. and Toshiba Corp.

Market Research Insights

  • The HVDC Transmission sector relies heavily on continuous innovation in power electronics hardware and transmission flow optimization to address evolving electrical demands. Implementing advanced bidirectional power transfer capabilities has increased overall grid utilization efficiency by 24%, allowing utilities to seamlessly balance generation deficits between asynchronous regions.
  • Furthermore, the integration of fault isolation algorithm protocols and fast-acting fault diagnostics within control systems has reduced cascading blackout occurrences by 31% compared to legacy setups. By establishing robust underground power corridor links, metropolitan networks bypass overhead land restrictions while improving acoustic and visual compliance.
  • Ultimately, these technological enhancements empower operators to scale capacity and guarantee energy security across diverse consumption hubs.

We can help! Our analysts can customize this hvdc transmission market research report to meet your requirements.

Get in touch

1. Executive Summary

1.1 Market overview

Executive Summary - Chart on Market Overview
Executive Summary - Data Table on Market Overview
Executive Summary - Chart on Global Market Characteristics
Executive Summary - Chart on Market by Geography
Executive Summary - Chart on Market Segmentation by Technology
Executive Summary - Chart on Market Segmentation by Component
Executive Summary - Chart on Market Segmentation by Application
Executive Summary - Chart on Incremental Growth
Executive Summary - Data Table on Incremental Growth
Executive Summary - Chart on Company Market Positioning

2. Technavio Analysis

2.1 Analysis of price sensitivity, lifecycle, customer purchase basket, adoption rates, and purchase criteria

2.2 Criticality of inputs and Factors of differentiation

Chart on Overview on criticality of inputs and factors of differentiation

2.3 Factors of disruption

Chart on Overview on factors of disruption

2.4 Impact of drivers and challenges

Chart on Impact of drivers and challenges in 2025 and 2030

3. Market Landscape

3.1 Market ecosystem

Chart on Parent Market
Data Table on - Parent Market

3.2 Market characteristics

Chart on Market characteristics analysis

3.3 Value chain analysis

Chart on Value chain analysis

4. Market Sizing

4.1 Market definition

Data Table on Offerings of companies included in the market definition

4.2 Market segment analysis

Market segments

4.3 Market size 2025

4.4 Market outlook: Forecast for 2025-2030

Chart on Global - Market size and forecast 2025-2030 ($ million)
Data Table on Global - Market size and forecast 2025-2030 ($ million)
Chart on Global Market: Year-over-year growth 2025-2030 (%)
Data Table on Global Market: Year-over-year growth 2025-2030 (%)

5. Historic Market Size

5.1 Global HVDC Transmission Market 2020 - 2024

Historic Market Size - Data Table on Global HVDC Transmission Market 2020 - 2024 ($ million)

5.2 Technology segment analysis 2020 - 2024

Historic Market Size - Technology Segment 2020 - 2024 ($ million)

5.3 Component segment analysis 2020 - 2024

Historic Market Size - Component Segment 2020 - 2024 ($ million)

5.4 Application segment analysis 2020 - 2024

Historic Market Size - Application Segment 2020 - 2024 ($ million)

5.5 Geography segment analysis 2020 - 2024

Historic Market Size - Geography Segment 2020 - 2024 ($ million)

5.6 Country segment analysis 2020 - 2024

Historic Market Size - Country Segment 2020 - 2024 ($ million)

6. Qualitative Analysis

6.1 Impact of AI on Global HVDC Transmission Market

6.2 Impact of geopolitical conflicts on Global HVDC Transmission Market

7. Five Forces Analysis

7.1 Five forces summary

Five forces analysis - Comparison between 2025 and 2030

7.2 Bargaining power of buyers

Bargaining power of buyers - Impact of key factors 2025 and 2030

7.3 Bargaining power of suppliers

Bargaining power of suppliers - Impact of key factors in 2025 and 2030

7.4 Threat of new entrants

Threat of new entrants - Impact of key factors in 2025 and 2030

7.5 Threat of substitutes

Threat of substitutes - Impact of key factors in 2025 and 2030

7.6 Threat of rivalry

Threat of rivalry - Impact of key factors in 2025 and 2030

7.7 Market condition

Chart on Market condition - Five forces 2025 and 2030

8. Market Segmentation by Technology

8.1 Market segments

Chart on Technology - Market share 2025-2030 (%)
Data Table on Technology - Market share 2025-2030 (%)

8.2 Comparison by Technology

Chart on Comparison by Technology
Data Table on Comparison by Technology

8.3 Voltage source converter - Market size and forecast 2025-2030

Chart on Voltage source converter - Market size and forecast 2025-2030 ($ million)
Data Table on Voltage source converter - Market size and forecast 2025-2030 ($ million)
Chart on Voltage source converter - Year-over-year growth 2025-2030 (%)
Data Table on Voltage source converter - Year-over-year growth 2025-2030 (%)

8.4 Line commutated converter - Market size and forecast 2025-2030

Chart on Line commutated converter - Market size and forecast 2025-2030 ($ million)
Data Table on Line commutated converter - Market size and forecast 2025-2030 ($ million)
Chart on Line commutated converter - Year-over-year growth 2025-2030 (%)
Data Table on Line commutated converter - Year-over-year growth 2025-2030 (%)

8.5 Others - Market size and forecast 2025-2030

Chart on Others - Market size and forecast 2025-2030 ($ million)
Data Table on Others - Market size and forecast 2025-2030 ($ million)
Chart on Others - Year-over-year growth 2025-2030 (%)
Data Table on Others - Year-over-year growth 2025-2030 (%)

8.6 Market opportunity by Technology

Market opportunity by Technology ($ million)
Data Table on Market opportunity by Technology ($ million)

9. Market Segmentation by Component

9.1 Market segments

Chart on Component - Market share 2025-2030 (%)
Data Table on Component - Market share 2025-2030 (%)

9.2 Comparison by Component

Chart on Comparison by Component
Data Table on Comparison by Component

9.3 Converter stations - Market size and forecast 2025-2030

Chart on Converter stations - Market size and forecast 2025-2030 ($ million)
Data Table on Converter stations - Market size and forecast 2025-2030 ($ million)
Chart on Converter stations - Year-over-year growth 2025-2030 (%)
Data Table on Converter stations - Year-over-year growth 2025-2030 (%)

9.4 Transmission cables - Market size and forecast 2025-2030

Chart on Transmission cables - Market size and forecast 2025-2030 ($ million)
Data Table on Transmission cables - Market size and forecast 2025-2030 ($ million)
Chart on Transmission cables - Year-over-year growth 2025-2030 (%)
Data Table on Transmission cables - Year-over-year growth 2025-2030 (%)

9.5 Control and protection systems - Market size and forecast 2025-2030

Chart on Control and protection systems - Market size and forecast 2025-2030 ($ million)
Data Table on Control and protection systems - Market size and forecast 2025-2030 ($ million)
Chart on Control and protection systems - Year-over-year growth 2025-2030 (%)
Data Table on Control and protection systems - Year-over-year growth 2025-2030 (%)

9.6 Others - Market size and forecast 2025-2030

Chart on Others - Market size and forecast 2025-2030 ($ million)
Data Table on Others - Market size and forecast 2025-2030 ($ million)
Chart on Others - Year-over-year growth 2025-2030 (%)
Data Table on Others - Year-over-year growth 2025-2030 (%)

9.7 Market opportunity by Component

Market opportunity by Component ($ million)
Data Table on Market opportunity by Component ($ million)

10. Market Segmentation by Application

10.1 Market segments

Chart on Application - Market share 2025-2030 (%)
Data Table on Application - Market share 2025-2030 (%)

10.2 Comparison by Application

Chart on Comparison by Application
Data Table on Comparison by Application

10.3 Renewable energy integration - Market size and forecast 2025-2030

Chart on Renewable energy integration - Market size and forecast 2025-2030 ($ million)
Data Table on Renewable energy integration - Market size and forecast 2025-2030 ($ million)
Chart on Renewable energy integration - Year-over-year growth 2025-2030 (%)
Data Table on Renewable energy integration - Year-over-year growth 2025-2030 (%)

10.4 Bulk power transmission - Market size and forecast 2025-2030

Chart on Bulk power transmission - Market size and forecast 2025-2030 ($ million)
Data Table on Bulk power transmission - Market size and forecast 2025-2030 ($ million)
Chart on Bulk power transmission - Year-over-year growth 2025-2030 (%)
Data Table on Bulk power transmission - Year-over-year growth 2025-2030 (%)

10.5 Interconnectors - Market size and forecast 2025-2030

Chart on Interconnectors - Market size and forecast 2025-2030 ($ million)
Data Table on Interconnectors - Market size and forecast 2025-2030 ($ million)
Chart on Interconnectors - Year-over-year growth 2025-2030 (%)
Data Table on Interconnectors - Year-over-year growth 2025-2030 (%)

10.6 Others - Market size and forecast 2025-2030

Chart on Others - Market size and forecast 2025-2030 ($ million)
Data Table on Others - Market size and forecast 2025-2030 ($ million)
Chart on Others - Year-over-year growth 2025-2030 (%)
Data Table on Others - Year-over-year growth 2025-2030 (%)

10.7 Market opportunity by Application

Market opportunity by Application ($ million)
Data Table on Market opportunity by Application ($ million)

11. Customer Landscape

11.1 Customer landscape overview

Analysis of price sensitivity, lifecycle, customer purchase basket, adoption rates, and purchase criteria

12. Geographic Landscape

12.1 Geographic segmentation

Chart on Market share by geography 2025-2030 (%)
Data Table on Market share by geography 2025-2030 (%)

12.2 Geographic comparison

Chart on Geographic comparison
Data Table on Geographic comparison

12.3 APAC - Market size and forecast 2025-2030

Chart on APAC - Market size and forecast 2025-2030 ($ million)
Data Table on APAC - Market size and forecast 2025-2030 ($ million)
Chart on APAC - Year-over-year growth 2025-2030 (%)
Data Table on APAC - Year-over-year growth 2025-2030 (%)
Chart on Regional Comparison - APAC
Data Table on Regional Comparison - APAC

12.3.1 China - Market size and forecast 2025-2030

Chart on China - Market size and forecast 2025-2030 ($ million)
Data Table on China - Market size and forecast 2025-2030 ($ million)
Chart on China - Year-over-year growth 2025-2030 (%)
Data Table on China - Year-over-year growth 2025-2030 (%)

12.3.2 India - Market size and forecast 2025-2030

Chart on India - Market size and forecast 2025-2030 ($ million)
Data Table on India - Market size and forecast 2025-2030 ($ million)
Chart on India - Year-over-year growth 2025-2030 (%)
Data Table on India - Year-over-year growth 2025-2030 (%)

12.3.3 Japan - Market size and forecast 2025-2030

Chart on Japan - Market size and forecast 2025-2030 ($ million)
Data Table on Japan - Market size and forecast 2025-2030 ($ million)
Chart on Japan - Year-over-year growth 2025-2030 (%)
Data Table on Japan - Year-over-year growth 2025-2030 (%)

12.3.4 South Korea - Market size and forecast 2025-2030

Chart on South Korea - Market size and forecast 2025-2030 ($ million)
Data Table on South Korea - Market size and forecast 2025-2030 ($ million)
Chart on South Korea - Year-over-year growth 2025-2030 (%)
Data Table on South Korea - Year-over-year growth 2025-2030 (%)

12.3.5 Australia - Market size and forecast 2025-2030

Chart on Australia - Market size and forecast 2025-2030 ($ million)
Data Table on Australia - Market size and forecast 2025-2030 ($ million)
Chart on Australia - Year-over-year growth 2025-2030 (%)
Data Table on Australia - Year-over-year growth 2025-2030 (%)

12.3.6 Indonesia - Market size and forecast 2025-2030

Chart on Indonesia - Market size and forecast 2025-2030 ($ million)
Data Table on Indonesia - Market size and forecast 2025-2030 ($ million)
Chart on Indonesia - Year-over-year growth 2025-2030 (%)
Data Table on Indonesia - Year-over-year growth 2025-2030 (%)

12.4 Europe - Market size and forecast 2025-2030

Chart on Europe - Market size and forecast 2025-2030 ($ million)
Data Table on Europe - Market size and forecast 2025-2030 ($ million)
Chart on Europe - Year-over-year growth 2025-2030 (%)
Data Table on Europe - Year-over-year growth 2025-2030 (%)
Chart on Regional Comparison - Europe
Data Table on Regional Comparison - Europe

12.4.1 Germany - Market size and forecast 2025-2030

Chart on Germany - Market size and forecast 2025-2030 ($ million)
Data Table on Germany - Market size and forecast 2025-2030 ($ million)
Chart on Germany - Year-over-year growth 2025-2030 (%)
Data Table on Germany - Year-over-year growth 2025-2030 (%)

12.4.2 UK - Market size and forecast 2025-2030

Chart on UK - Market size and forecast 2025-2030 ($ million)
Data Table on UK - Market size and forecast 2025-2030 ($ million)
Chart on UK - Year-over-year growth 2025-2030 (%)
Data Table on UK - Year-over-year growth 2025-2030 (%)

12.4.3 Norway - Market size and forecast 2025-2030

Chart on Norway - Market size and forecast 2025-2030 ($ million)
Data Table on Norway - Market size and forecast 2025-2030 ($ million)
Chart on Norway - Year-over-year growth 2025-2030 (%)
Data Table on Norway - Year-over-year growth 2025-2030 (%)

12.4.4 Denmark - Market size and forecast 2025-2030

Chart on Denmark - Market size and forecast 2025-2030 ($ million)
Data Table on Denmark - Market size and forecast 2025-2030 ($ million)
Chart on Denmark - Year-over-year growth 2025-2030 (%)
Data Table on Denmark - Year-over-year growth 2025-2030 (%)

12.4.5 The Netherlands - Market size and forecast 2025-2030

Chart on The Netherlands - Market size and forecast 2025-2030 ($ million)
Data Table on The Netherlands - Market size and forecast 2025-2030 ($ million)
Chart on The Netherlands - Year-over-year growth 2025-2030 (%)
Data Table on The Netherlands - Year-over-year growth 2025-2030 (%)

12.4.6 France - Market size and forecast 2025-2030

Chart on France - Market size and forecast 2025-2030 ($ million)
Data Table on France - Market size and forecast 2025-2030 ($ million)
Chart on France - Year-over-year growth 2025-2030 (%)
Data Table on France - Year-over-year growth 2025-2030 (%)

12.5 North America - Market size and forecast 2025-2030

Chart on North America - Market size and forecast 2025-2030 ($ million)
Data Table on North America - Market size and forecast 2025-2030 ($ million)
Chart on North America - Year-over-year growth 2025-2030 (%)
Data Table on North America - Year-over-year growth 2025-2030 (%)
Chart on Regional Comparison - North America
Data Table on Regional Comparison - North America

12.5.1 US - Market size and forecast 2025-2030

Chart on US - Market size and forecast 2025-2030 ($ million)
Data Table on US - Market size and forecast 2025-2030 ($ million)
Chart on US - Year-over-year growth 2025-2030 (%)
Data Table on US - Year-over-year growth 2025-2030 (%)

12.5.2 Canada - Market size and forecast 2025-2030

Chart on Canada - Market size and forecast 2025-2030 ($ million)
Data Table on Canada - Market size and forecast 2025-2030 ($ million)
Chart on Canada - Year-over-year growth 2025-2030 (%)
Data Table on Canada - Year-over-year growth 2025-2030 (%)

12.5.3 Mexico - Market size and forecast 2025-2030

Chart on Mexico - Market size and forecast 2025-2030 ($ million)
Data Table on Mexico - Market size and forecast 2025-2030 ($ million)
Chart on Mexico - Year-over-year growth 2025-2030 (%)
Data Table on Mexico - Year-over-year growth 2025-2030 (%)

12.6 Middle East and Africa - Market size and forecast 2025-2030

Chart on Middle East and Africa - Market size and forecast 2025-2030 ($ million)
Data Table on Middle East and Africa - Market size and forecast 2025-2030 ($ million)
Chart on Middle East and Africa - Year-over-year growth 2025-2030 (%)
Data Table on Middle East and Africa - Year-over-year growth 2025-2030 (%)
Chart on Regional Comparison - Middle East and Africa
Data Table on Regional Comparison - Middle East and Africa

12.6.1 Saudi Arabia - Market size and forecast 2025-2030

Chart on Saudi Arabia - Market size and forecast 2025-2030 ($ million)
Data Table on Saudi Arabia - Market size and forecast 2025-2030 ($ million)
Chart on Saudi Arabia - Year-over-year growth 2025-2030 (%)
Data Table on Saudi Arabia - Year-over-year growth 2025-2030 (%)

12.6.2 UAE - Market size and forecast 2025-2030

Chart on UAE - Market size and forecast 2025-2030 ($ million)
Data Table on UAE - Market size and forecast 2025-2030 ($ million)
Chart on UAE - Year-over-year growth 2025-2030 (%)
Data Table on UAE - Year-over-year growth 2025-2030 (%)

12.6.3 South Africa - Market size and forecast 2025-2030

Chart on South Africa - Market size and forecast 2025-2030 ($ million)
Data Table on South Africa - Market size and forecast 2025-2030 ($ million)
Chart on South Africa - Year-over-year growth 2025-2030 (%)
Data Table on South Africa - Year-over-year growth 2025-2030 (%)

12.6.4 Egypt - Market size and forecast 2025-2030

Chart on Egypt - Market size and forecast 2025-2030 ($ million)
Data Table on Egypt - Market size and forecast 2025-2030 ($ million)
Chart on Egypt - Year-over-year growth 2025-2030 (%)
Data Table on Egypt - Year-over-year growth 2025-2030 (%)

12.6.5 Turkey - Market size and forecast 2025-2030

Chart on Turkey - Market size and forecast 2025-2030 ($ million)
Data Table on Turkey - Market size and forecast 2025-2030 ($ million)
Chart on Turkey - Year-over-year growth 2025-2030 (%)
Data Table on Turkey - Year-over-year growth 2025-2030 (%)

12.7 South America - Market size and forecast 2025-2030

Chart on South America - Market size and forecast 2025-2030 ($ million)
Data Table on South America - Market size and forecast 2025-2030 ($ million)
Chart on South America - Year-over-year growth 2025-2030 (%)
Data Table on South America - Year-over-year growth 2025-2030 (%)
Chart on Regional Comparison - South America
Data Table on Regional Comparison - South America

12.7.1 Brazil - Market size and forecast 2025-2030

Chart on Brazil - Market size and forecast 2025-2030 ($ million)
Data Table on Brazil - Market size and forecast 2025-2030 ($ million)
Chart on Brazil - Year-over-year growth 2025-2030 (%)
Data Table on Brazil - Year-over-year growth 2025-2030 (%)

12.7.2 Chile - Market size and forecast 2025-2030

Chart on Chile - Market size and forecast 2025-2030 ($ million)
Data Table on Chile - Market size and forecast 2025-2030 ($ million)
Chart on Chile - Year-over-year growth 2025-2030 (%)
Data Table on Chile - Year-over-year growth 2025-2030 (%)

12.7.3 Argentina - Market size and forecast 2025-2030

Chart on Argentina - Market size and forecast 2025-2030 ($ million)
Data Table on Argentina - Market size and forecast 2025-2030 ($ million)
Chart on Argentina - Year-over-year growth 2025-2030 (%)
Data Table on Argentina - Year-over-year growth 2025-2030 (%)

12.8 Market opportunity by geography

Market opportunity by geography ($ million)
Data Tables on Market opportunity by geography ($ million)

13. Drivers, Challenges, and Opportunity

13.1 Market drivers

Accelerated integration of large scale renewable energy projects
Expansion of cross border interconnections and regional energy security
Urbanization and modernization of aging power infrastructure

13.2 Market challenges

High initial capital expenditure and financial resource allocation
Complex regulatory frameworks and jurisdictional disputes
Scarcity of technical expertise and supply chain bottlenecks

13.3 Impact of drivers and challenges

Impact of drivers and challenges in 2025 and 2030

13.4 Market opportunities

Proliferation of multi-terminal high voltage direct current networks
Integration of AI and digital twin technology for predictive operations
Emergence of hybrid high voltage direct current systems and modular multi-level converters

14. Competitive Landscape

14.1 Overview

14.2

Overview on criticality of inputs and factors of differentiation

14.3 Landscape disruption

Overview on factors of disruption

14.4 Industry risks

Impact of key risks on business

15. Competitive Analysis

15.1 Companies profiled

Companies covered

15.2 Company ranking index

15.3 Market positioning of companies

Matrix on companies position and classification

15.4 Bharat Heavy Electricals Ltd.

Bharat Heavy Electricals Ltd. - Overview
Bharat Heavy Electricals Ltd. - Business segments
Bharat Heavy Electricals Ltd. - Key offerings
Bharat Heavy Electricals Ltd. - Segment focus
SWOT

15.5 EL Sewedy Electric Co.

EL Sewedy Electric Co. - Overview
EL Sewedy Electric Co. - Business segments
EL Sewedy Electric Co. - Key offerings
EL Sewedy Electric Co. - Segment focus
SWOT

15.6 GE Vernova Inc.

GE Vernova Inc. - Overview
GE Vernova Inc. - Business segments
GE Vernova Inc. - Key offerings
GE Vernova Inc. - Segment focus
SWOT

15.7 Hengtong Group Co. Ltd.

Hengtong Group Co. Ltd. - Overview
Hengtong Group Co. Ltd. - Product / Service
Hengtong Group Co. Ltd. - Key offerings
SWOT

15.8 Hitachi Energy India Ltd.

Hitachi Energy India Ltd. - Overview
Hitachi Energy India Ltd. - Product / Service
Hitachi Energy India Ltd. - Key offerings
SWOT

15.9 LS ELECTRIC Co. Ltd.

LS ELECTRIC Co. Ltd. - Overview
LS ELECTRIC Co. Ltd. - Business segments
LS ELECTRIC Co. Ltd. - Key offerings
LS ELECTRIC Co. Ltd. - Segment focus
SWOT

15.10 Mitsubishi Electric Corp.

Mitsubishi Electric Corp. - Overview
Mitsubishi Electric Corp. - Business segments
Mitsubishi Electric Corp. - Key offerings
Mitsubishi Electric Corp. - Segment focus
SWOT

15.11 Nexans SA

Nexans SA - Overview
Nexans SA - Business segments
Nexans SA - Key offerings
Nexans SA - Segment focus
SWOT

15.12 NKT AS

NKT AS - Overview
NKT AS - Business segments
NKT AS - Key offerings
NKT AS - Segment focus
SWOT

15.13 NR Electric Co. Ltd.

NR Electric Co. Ltd. - Overview
NR Electric Co. Ltd. - Product / Service
NR Electric Co. Ltd. - Key offerings
SWOT

15.14 Seatrium Ltd.

Seatrium Ltd. - Overview
Seatrium Ltd. - Business segments
Seatrium Ltd. - Key offerings
Seatrium Ltd. - Segment focus
SWOT

15.15 Siemens Energy AG

Siemens Energy AG - Overview
Siemens Energy AG - Business segments
Siemens Energy AG - Key news
Siemens Energy AG - Key offerings
Siemens Energy AG - Segment focus
SWOT

15.16 Sumitomo Electric Industries

Sumitomo Electric Industries - Overview
Sumitomo Electric Industries - Business segments
Sumitomo Electric Industries - Key news
Sumitomo Electric Industries - Key offerings
Sumitomo Electric Industries - Segment focus
SWOT

15.17 TBEA Co. Ltd.

TBEA Co. Ltd. - Overview
TBEA Co. Ltd. - Product / Service
TBEA Co. Ltd. - Key offerings
SWOT

15.18 Toshiba Corp.

Toshiba Corp. - Overview
Toshiba Corp. - Product / Service
Toshiba Corp. - Key offerings
SWOT

16. Appendix

16.1 Scope of the report

Market definition
Objectives
Notes and caveats

16.2 Inclusions and exclusions checklist

Inclusions checklist
Exclusions checklist

16.3 Currency conversion rates for US$

16.4 Research methodology

16.5 Data procurement

Information sources

16.6 Data validation

16.7 Validation techniques employed for market sizing

16.8 Data synthesis

16.9 360 degree market analysis

16.10 List of abbreviations

Research Methodology

Technavio presents a detailed picture of the market by way of study, synthesis, and summation of data from multiple sources. The analysts have presented the various facets of the market with a particular focus on identifying the key industry influencers. The data thus presented is comprehensive, reliable, and the result of extensive research, both primary and secondary.

INFORMATION SOURCES

Primary sources

  • Manufacturers and suppliers
  • Channel partners
  • Industry experts
  • Strategic decision makers

Secondary sources

  • Industry journals and periodicals
  • Government data
  • Financial reports of key industry players
  • Historical data
  • Press releases

DATA ANALYSIS

Data Synthesis

  • Collation of data
  • Estimation of key figures
  • Analysis of derived insights

Data Validation

  • Triangulation with data models
  • Reference against proprietary databases
  • Corroboration with industry experts

REPORT WRITING

Qualitative

  • Market drivers
  • Market challenges
  • Market trends
  • Five forces analysis

Quantitative

  • Market size and forecast
  • Market segmentation
  • Geographical insights
  • Competitive landscape

Interested in this report?

Get your sample now to see our research methodology and insights!

Download Now

Frequently Asked Questions

Hvdc Transmission market growth will increase by USD 5463.3 million during 2026-2030.

The Hvdc Transmission market is expected to grow at a CAGR of 7.3% during 2026-2030.

Hvdc Transmission market is segmented by Technology (Voltage source converter, Line commutated converter, Others) Component (Converter stations, Transmission cables, Control and protection systems, Others) Application (Renewable energy integration, Bulk power transmission, Interconnectors, Others)

Bharat Heavy Electricals Ltd., EL Sewedy Electric Co., Furukawa Electric Co. Ltd., GE Vernova Inc., Hengtong Group Co. Ltd., Hitachi Energy India Ltd., Hyosung Heavy Industries Corp., LS ELECTRIC Co. Ltd., Mitsubishi Electric Corp., Nexans SA, NKT AS, NR Electric Co. Ltd., Prysmian S.p.A, Seatrium Ltd., Siemens Energy AG, Southwire Co. LLC, Sumitomo Electric Industries, Taihan Cable and Solution Co. Ltd., TBEA Co. Ltd., Toshiba Corp. are a few of the key vendors in the Hvdc Transmission market.

APAC will register the highest growth rate of 48.4% among the other regions. Therefore, the Hvdc Transmission market in APAC is expected to garner significant business opportunities for the vendors during the forecast period.

China, India, Japan, South Korea, Australia, Indonesia, Germany, UK, Norway, Denmark, The Netherlands, France, US, Canada, Mexico, Saudi Arabia, UAE, South Africa, Egypt, Turkey, Brazil, Chile, Argentina

  • Accelerated integration of large scale renewable energy projects is the driving factor this market.

The Hvdc Transmission market vendors should focus on grabbing business opportunities from the Technology segment as it accounted for the largest market share in the base year.
RIA - Research AI Assistant
Ask RIA
