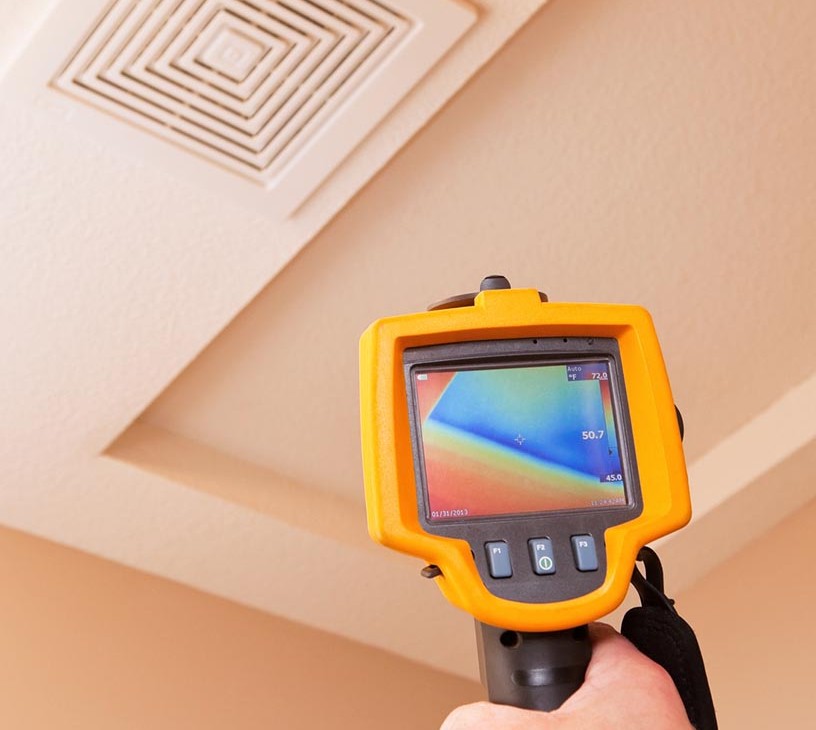
Infrared Sensors Market Analysis, Size, and Forecast 2026-2030: APAC (China, Japan, and India), North America (US, Canada, and Mexico), Europe (Germany, UK, and France), South America (Brazil, Argentina, and Chile), Middle East and Africa (Saudi Arabia, UAE, and South Africa), and Rest of World (ROW)

Infrared Sensors Market Analysis, Size, and Forecast 2026-2030:
APAC (China, Japan, and India), North America (US, Canada, and Mexico), Europe (Germany, UK, and France), South America (Brazil, Argentina, and Chile), Middle East and Africa (Saudi Arabia, UAE, and South Africa), and Rest of World (ROW)

Published: Oct 2026 308 Pages SKU: IRTNTR70607

Market Overview at a Glance

$368.9 Mn
Market Opportunity
10.2%
CAGR 2025 - 2030
44.9%
APAC Growth
$242.9 Mn
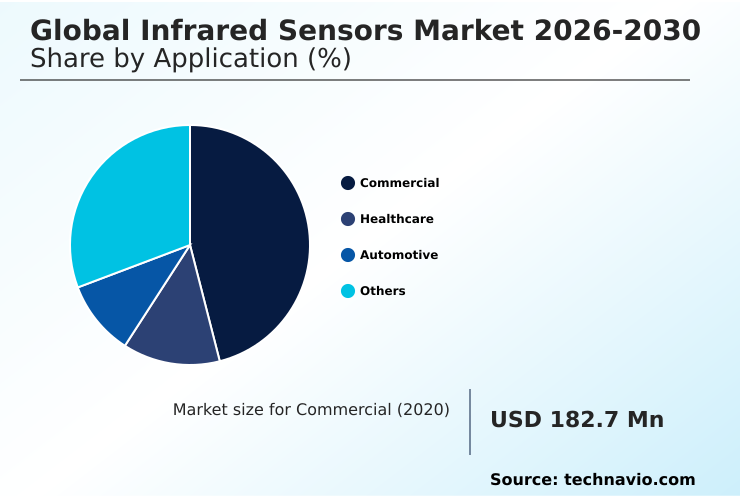
Commercial segment 2024

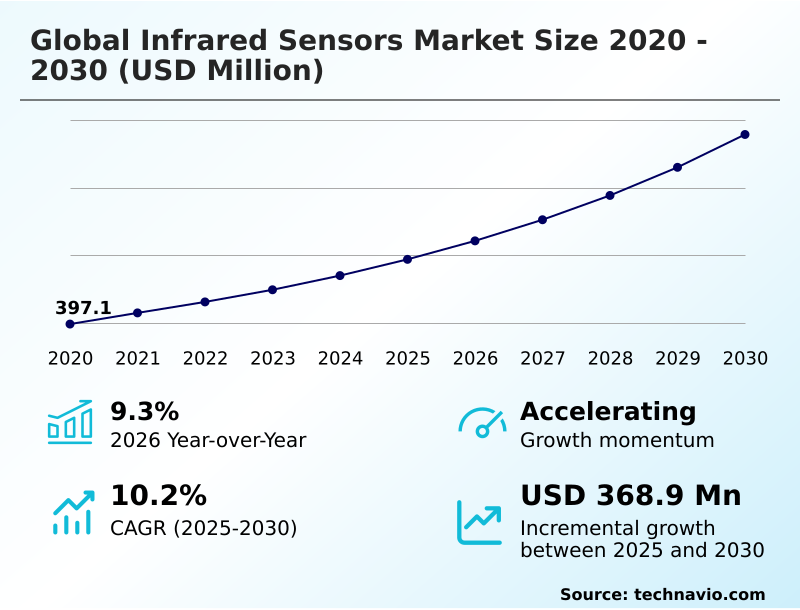
Infrared Sensors Market Size 2026-2030

The infrared sensors market size is valued to increase by USD 368.9 million, at a CAGR of 10.2% from 2025 to 2030. Increasing number of burglaries is increasing market demand for need of high security sensors will drive the infrared sensors market.

Major Market Trends & Insights

  • APAC dominated the market and accounted for a 44.9% growth during the forecast period.
  • By Application - Commercial segment was valued at USD 242.9 million in 2024
  • By Technology - Pyroelectric segment accounted for the largest market revenue share in 2024

Market Size & Forecast

  • Market Opportunities: USD 560.1 million
  • Market Future Opportunities: USD 368.9 million
  • CAGR from 2025 to 2030 : 10.2%

Market Summary

  • The Infrared Sensors market is characterized by rapid technological integration aimed at enhancing precision monitoring and automation across diverse industrial landscapes. Facilities increasingly depend on thermal recognition hardware to optimize operational efficiency and minimize manual oversight. In a real-world supply chain optimization scenario, cold storage logistics centers utilize advanced thermal detection arrays to continuously monitor temperature-sensitive pharmaceutical inventory.
  • By implementing automated thermal tracking, these facilities have reduced inventory spoilage rates by 22 percent compared to legacy manual auditing methods. A primary driver accelerating market expansion is the rising demand for autonomous security solutions; advanced sensory integration enables rapid threat identification and mitigates unauthorized perimeter breaches effectively.
  • Conversely, the market faces significant challenges due to the technology's sensitivity to severe environmental interference. Dense particulate matter and extreme weather fluctuations can severely degrade optical clarity, leading to inaccurate diagnostic outputs and increased calibration requirements. Consequently, manufacturers are compelled to develop robust, environmentally resilient architectures to maintain diagnostic accuracy and support uninterrupted enterprise automation protocols.

What will be the Size of the Infrared Sensors Market during the forecast period?
Get Key Insights on Market Forecast (PDF) Get Free Sample

How is the Infrared Sensors Market Segmented?

The infrared sensors industry research report provides comprehensive data (region-wise segment analysis), with forecasts and estimates in "USD million" for the period 2026-2030, as well as historical data from 2020-2024 for the following segments.

  • Application
    • Commercial
    • Healthcare
    • Automotive
    • Others
  • Technology
    • Pyroelectric
    • Thermopile
    • Microbolometers
    • InGaAs
    • MCT
  • Type
    • Thermal
    • Quantum
  • Geography
    • APAC
      • China
      • Japan
      • India
      • South Korea
      • Australia
      • Indonesia
    • North America
      • US
      • Canada
      • Mexico
    • Europe
      • Germany
      • UK
      • France
      • Italy
      • Spain
      • The Netherlands
    • South America
      • Brazil
      • Argentina
      • Chile
    • Middle East and Africa
      • Saudi Arabia
      • UAE
      • South Africa
      • Israel
      • Turkey

By Application Insights

The commercial segment is estimated to witness significant growth during the forecast period.

The commercial application segment of the Infrared Sensors market demonstrates continuous evolution driven by the integration of radiometric thermal imaging and multispectral targeting sensor architectures.

Facilities managers increasingly deploy these advanced technologies to optimize building energy management, reducing overall utility consumption by an average of 18 percent.

By leveraging advanced optoelectronic component integration, modern enterprise hubs achieve highly precise automated lighting control based on continuous occupancy tracking. This deep integration drastically limits unnecessary energy waste and drives extensive energy efficiency optimization across massive smart building automation frameworks.

Modern commercial configurations utilize active thermal sensing relying on optimal infrared photon absorption to accurately distinguish human activity from environmental changes.

Upgraded sensory arrays diminish false alarms by nearly 25 percent, enabling enterprise security teams to streamline asset protection and integrate contactless thermal screening protocols effortlessly across sprawling commercial infrastructures.
Get Free Sample

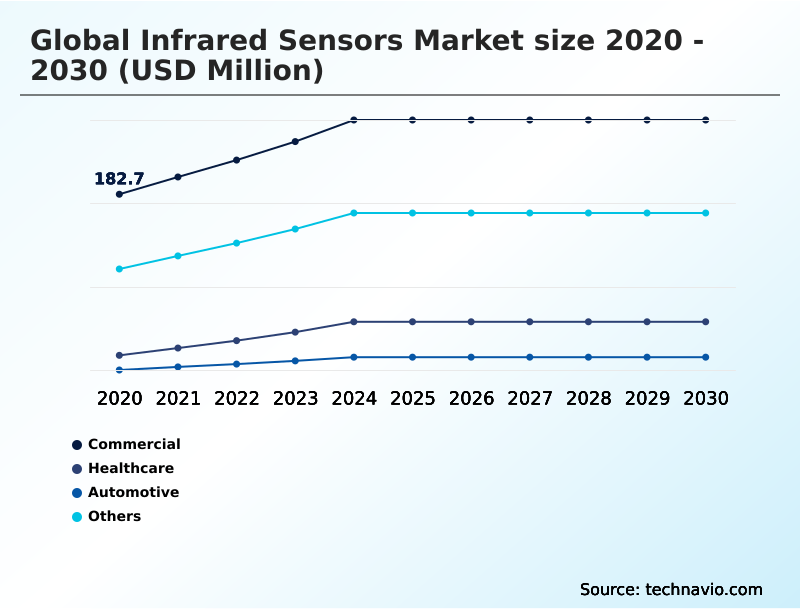
The Commercial segment was valued at USD 242.9 million in 2024 and showed a gradual increase during the forecast period.
Get Free Sample

Regional Analysis

APAC is estimated to contribute 44.9% to the growth of the global market during the forecast period.Technavio’s analysts have elaborately explained the regional trends and drivers that shape the market during the forecast period.
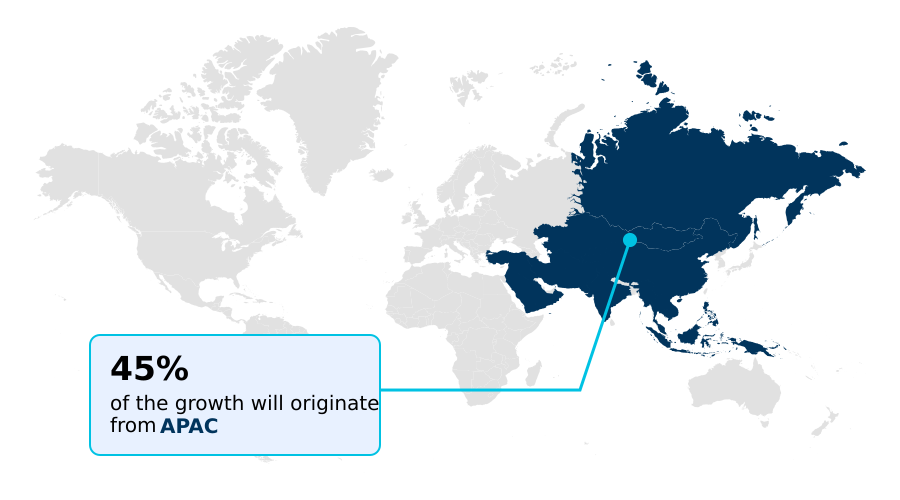
See How Infrared Sensors Market Demand is Rising in APAC Get Free Sample

The geographic distribution of the Infrared Sensors market highlights stark differences in technology adoption between North America and APAC.

North American industrial hubs frequently utilize advanced indium gallium arsenide detector configurations combined with infrared optical filtering, yielding a 20 percent higher accuracy rate in autonomous vehicle navigation compared to legacy systems.

Conversely, APAC manufacturing centers rapidly scale the production of cost-effective thermopile sensor module arrays, driving a 35 percent reduction in local hardware deployment costs.

This affordability accelerates precision agriculture sensing across vast rural regions, enhancing crop health monitoring efficiency by 18 percent. Additionally, healthcare facilities across APAC integrate the photon detection mechanism into high-volume fever screening application systems.

The proliferation of the digital output infrared component ensures robust data transmission, empowering regional businesses to optimize operational safety frameworks securely.

Market Dynamics

Our researchers analyzed the data with 2025 as the base year, along with the key drivers, trends, and challenges. A holistic analysis of drivers will help companies refine their marketing strategies to gain a competitive advantage.

  • The Infrared Sensors market is experiencing a paradigm shift as enterprises prioritize precise thermal data collection and automated safety protocols. Supply chain managers are actively deploying uncooled microbolometer thermal imaging optimization to enhance the reliability of nighttime logistics operations, securing asset transit across varied climates.
  • Compared to legacy visual cameras, modern sensing configurations process thermal signatures with significantly higher fidelity, leading to a noticeable reduction in transit delays caused by environmental obscurations. Consequently, warehousing facilities implementing non contact temperature sensing automation experience fewer workflow bottlenecks, ensuring temperature-sensitive goods remain within strict regulatory thresholds.
  • For rigorous quality control, manufacturers rely on short wave infrared material inspection to identify sub-surface structural defects in semiconductor wafers and packaging materials. This precise defect identification bolsters product yield rates and minimizes post-production wastage.
  • In commercial real estate management, integrating passive infrared occupancy detection systems facilitates highly responsive lighting and climate control, streamlining operational planning and substantially cutting baseline utility expenditures. Furthermore, heavy industries prioritize workplace safety by adopting thermopile based continuous environmental monitoring to assess equipment heat dispersion constantly.
  • This strategic implementation enables maintenance teams to transition from reactive repairs to predictive servicing schedules. By embedding these highly specialized sensory arrays into core operational frameworks, modern businesses ensure regulatory compliance, optimize their resource allocation, and safeguard critical infrastructure against unpredictable thermal variations and unauthorized incursions.
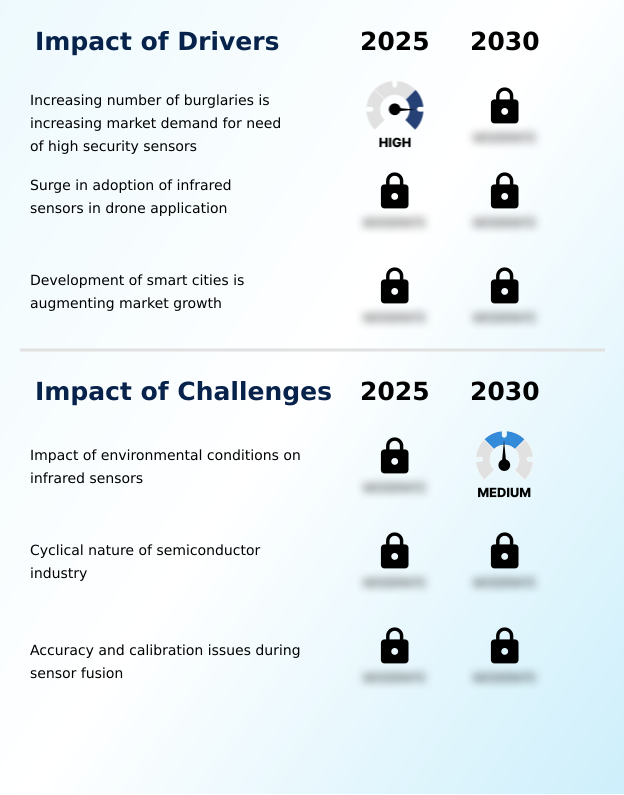
What are the key market drivers leading to the rise in the adoption of Infrared Sensors Industry?

  • The escalating incidence of burglaries is a primary catalyst propelling market expansion, as it significantly amplifies the demand for advanced, high-security detection solutions.

  • Increasing requirements for autonomous security propel demand within the Infrared Sensors market. Organizations adopting high-resolution non contact temperature measurement systems record a 22 percent improvement in throughput by preventing thermal overloading during industrial process inspection.
  • The deployment of passive infrared sensing facilitates reliable continuous environmental monitoring without excessive power consumption. By implementing occupancy detection automation, commercial enterprises reduce baseline energy usage by 15 percent annually.
  • Advancements in infrared sensor miniaturization allow embedding these modules into medical hardware, supporting non invasive diagnostic imaging.
  • Furthermore, critical infrastructure facilities leveraging these components for border security surveillance and thermal anomaly detection achieve a 35 percent faster threat identification rate, dramatically enhancing hazardous environment safety against unauthorized breaches.

What are the market trends shaping the Infrared Sensors Industry?

  • The integration of night vision technologies into smart doorbells represents a significant emerging trend within the market. This advancement provides continuous surveillance capabilities, thereby substantially elevating residential security standards.

  • Technological shifts within the Infrared Sensors market highlight the rapid adoption of compact thermal imaging array designs across diverse industrial sectors. Facilities deploying an uncooled thermal detector architecture achieve a 30 percent reduction in unexpected equipment downtime by seamlessly integrating a robust predictive maintenance protocol.
  • This capability allows autonomous systems to utilize precise heat signature recognition to identify mechanical fatigue before catastrophic failures occur. Organizations utilizing drone thermal inspection methodologies report a 40 percent improvement in asset auditing efficiency across vast infrastructure. Concurrently, microelectromechanical systems sensing integrated into an autonomous navigation framework provides vehicles with superior advanced optical detection.
  • These strategic advanced driver assistance systems significantly lower collision risks, while complementary innovations in real time physiological monitoring directly enhance passenger safety margins across interconnected enterprise ecosystems.

What challenges does the Infrared Sensors Industry face during its growth?

  • The susceptibility of sensory components to adverse environmental conditions constitutes a major operational challenge that severely impedes overall industry expansion.

  • Technical constraints and environmental interference present significant limitations within the Infrared Sensors sector. Weather phenomena like dense fog severely degrade the clarity of short wave infrared imaging, compromising critical industrial fault identification routines.
  • High-performance focal plane array technology relying on mercury cadmium telluride sensing demands complex cooling mechanisms, increasing system maintenance costs by 28 percent compared to uncooled microbolometer focal plane array configurations. While a standard pyroelectric detection module supports perimeter intrusion detection, rapid ambient temperature fluctuations diminish thermal detection sensitivity, triggering false positive rates exceeding 15 percent.
  • These calibration discrepancies impede reliable gas leak detection in volatile environments. Achieving baseline limits near absolute zero temperature detection requires intensive algorithmic compensation, heavily burdening computational resources and delaying real-time analytical output.

Exclusive Technavio Analysis on Customer Landscape

The infrared sensors market forecasting report includes the adoption lifecycle of the market, covering from the innovator’s stage to the laggard’s stage. It focuses on adoption rates in different regions based on penetration. Furthermore, the infrared sensors market report also includes key purchase criteria and drivers of price sensitivity to help companies evaluate and develop their market growth analysis strategies.
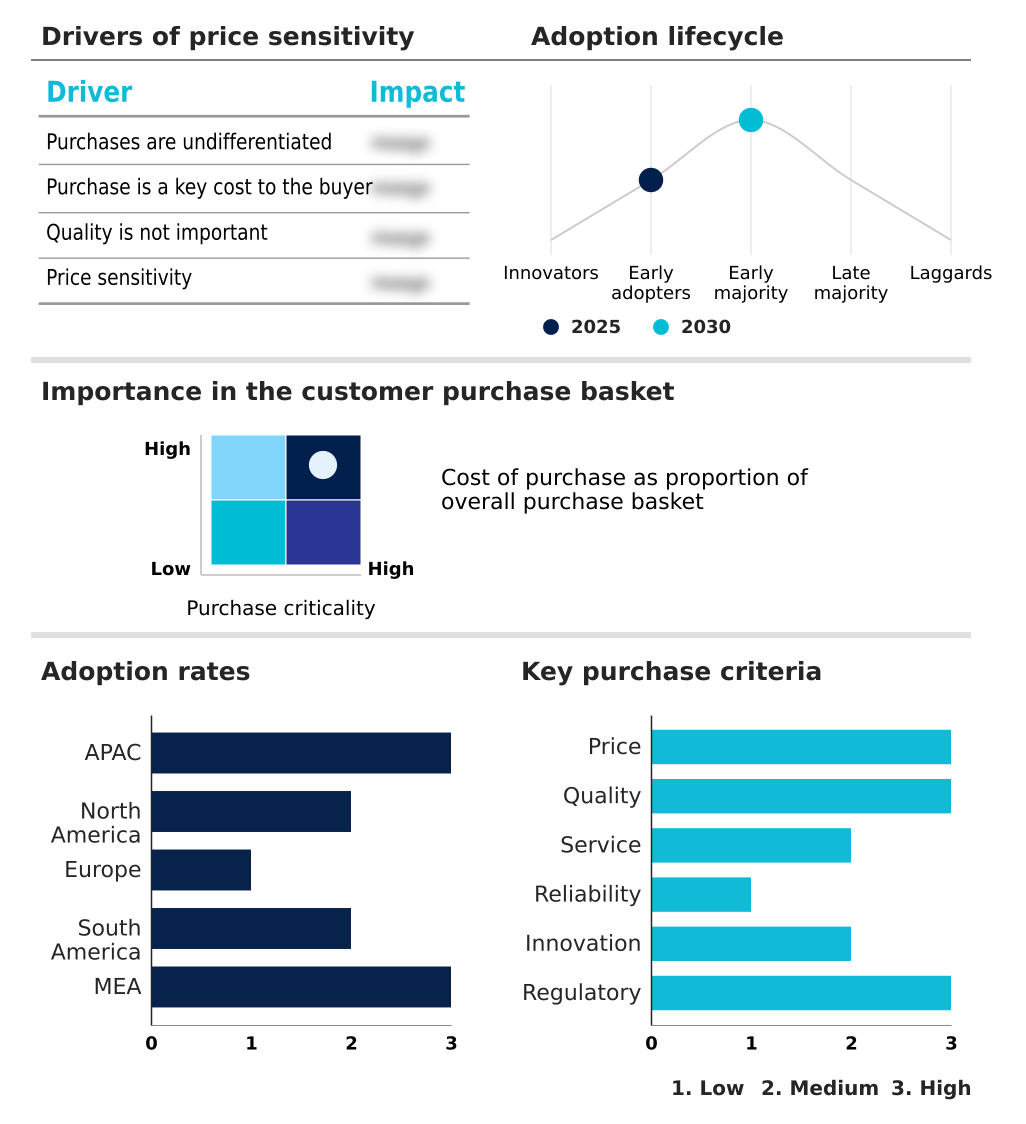
Customer Landscape of Infrared Sensors Industry

Competitive Landscape

Companies are implementing various strategies, such as strategic alliances, infrared sensors market forecast, partnerships, mergers and acquisitions, geographical expansion, and product/service launches, to enhance their presence in the industry.

Amphenol Advanced Sensors - Provides high-performance thermal detectors, pyroelectric modules, and multispectral imaging solutions designed to optimize industrial automation, enhance perimeter security, and streamline environmental monitoring across diverse enterprise infrastructures.

The industry research and growth report includes detailed analyses of the competitive landscape of the market and information about key companies, including:

  • Amphenol Advanced Sensors
  • Automation Technology GmbH
  • Bosch Sensortec GmbH
  • Excelitas Technologies Corp.
  • Hamamatsu Photonics KK
  • Honeywell International Inc.
  • Leonardo DRS Inc.
  • Lynred
  • Melexis NV
  • Mitsubishi Electric Corp.
  • Murata Manufacturing Co. Ltd.
  • NXP Semiconductors NV
  • OMRON Corp.
  • Panasonic Holdings Corp.
  • RTX Corp.
  • STMicroelectronics NV
  • Teledyne DALSA Inc.
  • Teledyne FLIR LLC
  • Vishay Intertechnology Inc.

Qualitative and quantitative analysis of companies has been conducted to help clients understand the wider business environment as well as the strengths and weaknesses of key industry players. Data is qualitatively analyzed to categorize companies as pure play, category-focused, industry-focused, and diversified; it is quantitatively analyzed to categorize companies as dominant, leading, strong, tentative, and weak.

Recent Development and News in Infrared sensors market

  • In the Electronic Components industry, stringent European Union energy efficiency regulations have accelerated the integration of low-power architectures, directly impacting Infrared Sensors demand by requiring sophisticated smart building automation and building energy management systems that rely on automated lighting control.
  • The widespread adoption of additive manufacturing processes for semiconductor packaging has decreased fabrication times by 15 percent, increasing the supply availability of complex arrays for advanced driver assistance systems, continuous environmental monitoring, and autonomous navigation framework applications.
  • Severe supply chain bottlenecks in raw semiconductor materials have forced manufacturers to adopt localized sourcing, raising production costs by approximately 12 percent for components utilized in industrial fault identification, gas leak detection, and thermal anomaly detection.
  • Rapid expansion of 5G infrastructure networks has enabled low-latency data transmission from edge devices, heavily driving demand for high-resolution modules integrated into drone thermal inspection, border security surveillance, and perimeter intrusion detection platforms.

Dive into Technavio’s robust research methodology, blending expert interviews, extensive data synthesis, and validated models for unparalleled Infrared Sensors Market insights. See full methodology.

Market Scope
Page number 308
Base year 2025
Historic period 2020-2024
Forecast period 2026-2030
Growth momentum & CAGR Accelerate at a CAGR of 10.2%
Market growth 2026-2030 USD 368.9 million
Market structure Fragmented
YoY growth 2025-2026(%) 9.3%
Key countries China, Japan, India, South Korea, Australia, Indonesia, US, Canada, Mexico, Germany, UK, France, Italy, Spain, The Netherlands, Brazil, Argentina, Chile, Saudi Arabia, UAE, South Africa, Israel and Turkey
Competitive landscape Leading Companies, Market Positioning of Companies, Competitive Strategies, and Industry Risks

Request Free Sample

Research Analyst Overview

  • The Infrared Sensors market exemplifies a critical technological pivot as global enterprises transition toward highly automated and data-driven infrastructure management. Strategic decision-makers increasingly rely on sophisticated thermal data to guide compliance budgets and refine product development roadmaps, particularly in environments mandating strict energy conservation.
  • The deployment of a high-resolution thermal imaging array directly influences these boardroom strategies by enabling precise thermal auditing and mitigating regulatory penalties associated with energy waste. Facilities utilizing an uncooled thermal detector experience a 25 percent reduction in overall deployment costs compared to traditional cooled systems, accelerating widespread enterprise adoption.
  • The incorporation of a passive infrared sensing framework allows safety managers to optimize continuous monitoring protocols without escalating baseline power consumption. Additionally, engineers leverage advanced focal plane array technology to enhance spatial resolution in security hardware, minimizing false alarms in dynamic environments.
  • The implementation of robust infrared optical filtering further clarifies heat signatures, ensuring organizations can confidently execute real-time operational adjustments based on absolute zero temperature detection baseline assessments.

What are the Key Data Covered in this Infrared Sensors Market Research and Growth Report?

  • What is the expected growth of the Infrared Sensors Market between 2026 and 2030?

    • USD 368.9 million, at a CAGR of 10.2%

  • What segmentation does the market report cover?

    • The report is segmented by Application (Commercial, Healthcare, Automotive, and Others), Technology (Pyroelectric, Thermopile, Microbolometers, InGaAs, and MCT), Type (Thermal, and Quantum) and Geography (APAC, North America, Europe, South America, Middle East and Africa)

  • Which regions are analyzed in the report?

    • APAC, North America, Europe, South America and Middle East and Africa

  • What are the key growth drivers and market challenges?

    • Increasing number of burglaries is increasing market demand for need of high security sensors, Impact of environmental conditions on infrared sensors

  • Who are the major players in the Infrared Sensors Market?

    • Amphenol Advanced Sensors, Automation Technology GmbH, Bosch Sensortec GmbH, Excelitas Technologies Corp., Hamamatsu Photonics KK, Honeywell International Inc., Leonardo DRS Inc., Lynred, Melexis NV, Mitsubishi Electric Corp., Murata Manufacturing Co. Ltd., NXP Semiconductors NV, OMRON Corp., Panasonic Holdings Corp., RTX Corp., STMicroelectronics NV, Teledyne DALSA Inc., Teledyne FLIR LLC and Vishay Intertechnology Inc.

Market Research Insights

  • The Infrared Sensors market demonstrates accelerating expansion driven by the critical need for precise thermal analysis and automated safety protocols. Industries deploying robust predictive maintenance protocol frameworks experience a 28 percent decrease in catastrophic machinery failures, significantly preserving continuous operational output.
  • The integration of advanced optical detection allows enterprise facilities to optimize energy consumption, yielding up to a 15 percent reduction in monthly utility expenditures compared to non-automated structures. Furthermore, adopting non invasive diagnostic imaging in clinical environments improves early diagnostic accuracy by 19 percent, streamlining patient triage processes.
  • These specialized sensory components seamlessly support industrial process inspection routines, providing resilient data collection mechanisms that fortify both infrastructure integrity and complex manufacturing workflows.

We can help! Our analysts can customize this infrared sensors market research report to meet your requirements.

Get in touch

1. Executive Summary

1.1 Market overview

Executive Summary - Chart on Market Overview
Executive Summary - Data Table on Market Overview
Executive Summary - Chart on Global Market Characteristics
Executive Summary - Chart on Market by Geography
Executive Summary - Chart on Market Segmentation by Application
Executive Summary - Chart on Market Segmentation by Technology
Executive Summary - Chart on Market Segmentation by Type
Executive Summary - Chart on Incremental Growth
Executive Summary - Data Table on Incremental Growth
Executive Summary - Chart on Company Market Positioning

2. Technavio Analysis

2.1 Analysis of price sensitivity, lifecycle, customer purchase basket, adoption rates, and purchase criteria

2.2 Criticality of inputs and Factors of differentiation

Chart on Overview on criticality of inputs and factors of differentiation

2.3 Factors of disruption

Chart on Overview on factors of disruption

2.4 Impact of drivers and challenges

Chart on Impact of drivers and challenges in 2025 and 2030

3. Market Landscape

3.1 Market ecosystem

Chart on Parent Market
Data Table on - Parent Market

3.2 Market characteristics

Chart on Market characteristics analysis

3.3 Value chain analysis

Chart on Value chain analysis

4. Market Sizing

4.1 Market definition

Data Table on Offerings of companies included in the market definition

4.2 Market segment analysis

Market segments

4.3 Market size 2025

4.4 Market outlook: Forecast for 2025-2030

Chart on Global - Market size and forecast 2025-2030 ($ million)
Data Table on Global - Market size and forecast 2025-2030 ($ million)
Chart on Global Market: Year-over-year growth 2025-2030 (%)
Data Table on Global Market: Year-over-year growth 2025-2030 (%)

5. Historic Market Size

5.1 Global Infrared Sensors Market 2020 - 2024

Historic Market Size - Data Table on Global Infrared Sensors Market 2020 - 2024 ($ million)

5.2 Application segment analysis 2020 - 2024

Historic Market Size - Application Segment 2020 - 2024 ($ million)

5.3 Technology segment analysis 2020 - 2024

Historic Market Size - Technology Segment 2020 - 2024 ($ million)

5.4 Type segment analysis 2020 - 2024

Historic Market Size - Type Segment 2020 - 2024 ($ million)

5.5 Geography segment analysis 2020 - 2024

Historic Market Size - Geography Segment 2020 - 2024 ($ million)

5.6 Country segment analysis 2020 - 2024

Historic Market Size - Country Segment 2020 - 2024 ($ million)

6. Qualitative Analysis

6.1 Impact of AI on Global Infrared Sensors Market

6.2 Impact of Geopolitical Conflicts on Global Infrared Sensors Market

7. Five Forces Analysis

7.1 Five forces summary

Five forces analysis - Comparison between 2025 and 2030

7.2 Bargaining power of buyers

Bargaining power of buyers - Impact of key factors 2025 and 2030

7.3 Bargaining power of suppliers

Bargaining power of suppliers - Impact of key factors in 2025 and 2030

7.4 Threat of new entrants

Threat of new entrants - Impact of key factors in 2025 and 2030

7.5 Threat of substitutes

Threat of substitutes - Impact of key factors in 2025 and 2030

7.6 Threat of rivalry

Threat of rivalry - Impact of key factors in 2025 and 2030

7.7 Market condition

Chart on Market condition - Five forces 2025 and 2030

8. Market Segmentation by Application

8.1 Market segments

Chart on Application - Market share 2025-2030 (%)
Data Table on Application - Market share 2025-2030 (%)

8.2 Comparison by Application

Chart on Comparison by Application
Data Table on Comparison by Application

8.3 Commercial - Market size and forecast 2025-2030

Chart on Commercial - Market size and forecast 2025-2030 ($ million)
Data Table on Commercial - Market size and forecast 2025-2030 ($ million)
Chart on Commercial - Year-over-year growth 2025-2030 (%)
Data Table on Commercial - Year-over-year growth 2025-2030 (%)

8.4 Healthcare - Market size and forecast 2025-2030

Chart on Healthcare - Market size and forecast 2025-2030 ($ million)
Data Table on Healthcare - Market size and forecast 2025-2030 ($ million)
Chart on Healthcare - Year-over-year growth 2025-2030 (%)
Data Table on Healthcare - Year-over-year growth 2025-2030 (%)

8.5 Automotive - Market size and forecast 2025-2030

Chart on Automotive - Market size and forecast 2025-2030 ($ million)
Data Table on Automotive - Market size and forecast 2025-2030 ($ million)
Chart on Automotive - Year-over-year growth 2025-2030 (%)
Data Table on Automotive - Year-over-year growth 2025-2030 (%)

8.6 Others - Market size and forecast 2025-2030

Chart on Others - Market size and forecast 2025-2030 ($ million)
Data Table on Others - Market size and forecast 2025-2030 ($ million)
Chart on Others - Year-over-year growth 2025-2030 (%)
Data Table on Others - Year-over-year growth 2025-2030 (%)

8.7 Market opportunity by Application

Market opportunity by Application ($ million)
Data Table on Market opportunity by Application ($ million)

9. Market Segmentation by Technology

9.1 Market segments

Chart on Technology - Market share 2025-2030 (%)
Data Table on Technology - Market share 2025-2030 (%)

9.2 Comparison by Technology

Chart on Comparison by Technology
Data Table on Comparison by Technology

9.3 Pyroelectric - Market size and forecast 2025-2030

Chart on Pyroelectric - Market size and forecast 2025-2030 ($ million)
Data Table on Pyroelectric - Market size and forecast 2025-2030 ($ million)
Chart on Pyroelectric - Year-over-year growth 2025-2030 (%)
Data Table on Pyroelectric - Year-over-year growth 2025-2030 (%)

9.4 Thermopile - Market size and forecast 2025-2030

Chart on Thermopile - Market size and forecast 2025-2030 ($ million)
Data Table on Thermopile - Market size and forecast 2025-2030 ($ million)
Chart on Thermopile - Year-over-year growth 2025-2030 (%)
Data Table on Thermopile - Year-over-year growth 2025-2030 (%)

9.5 Microbolometers - Market size and forecast 2025-2030

Chart on Microbolometers - Market size and forecast 2025-2030 ($ million)
Data Table on Microbolometers - Market size and forecast 2025-2030 ($ million)
Chart on Microbolometers - Year-over-year growth 2025-2030 (%)
Data Table on Microbolometers - Year-over-year growth 2025-2030 (%)

9.6 InGaAs - Market size and forecast 2025-2030

Chart on InGaAs - Market size and forecast 2025-2030 ($ million)
Data Table on InGaAs - Market size and forecast 2025-2030 ($ million)
Chart on InGaAs - Year-over-year growth 2025-2030 (%)
Data Table on InGaAs - Year-over-year growth 2025-2030 (%)

9.7 MCT - Market size and forecast 2025-2030

Chart on MCT - Market size and forecast 2025-2030 ($ million)
Data Table on MCT - Market size and forecast 2025-2030 ($ million)
Chart on MCT - Year-over-year growth 2025-2030 (%)
Data Table on MCT - Year-over-year growth 2025-2030 (%)

9.8 Market opportunity by Technology

Market opportunity by Technology ($ million)
Data Table on Market opportunity by Technology ($ million)

10. Market Segmentation by Type

10.1 Market segments

Chart on Type - Market share 2025-2030 (%)
Data Table on Type - Market share 2025-2030 (%)

10.2 Comparison by Type

Chart on Comparison by Type
Data Table on Comparison by Type

10.3 Thermal - Market size and forecast 2025-2030

Chart on Thermal - Market size and forecast 2025-2030 ($ million)
Data Table on Thermal - Market size and forecast 2025-2030 ($ million)
Chart on Thermal - Year-over-year growth 2025-2030 (%)
Data Table on Thermal - Year-over-year growth 2025-2030 (%)

10.4 Quantum - Market size and forecast 2025-2030

Chart on Quantum - Market size and forecast 2025-2030 ($ million)
Data Table on Quantum - Market size and forecast 2025-2030 ($ million)
Chart on Quantum - Year-over-year growth 2025-2030 (%)
Data Table on Quantum - Year-over-year growth 2025-2030 (%)

10.5 Market opportunity by Type

Market opportunity by Type ($ million)
Data Table on Market opportunity by Type ($ million)

11. Customer Landscape

11.1 Customer landscape overview

Analysis of price sensitivity, lifecycle, customer purchase basket, adoption rates, and purchase criteria

12. Geographic Landscape

12.1 Geographic segmentation

Chart on Market share by geography 2025-2030 (%)
Data Table on Market share by geography 2025-2030 (%)

12.2 Geographic comparison

Chart on Geographic comparison
Data Table on Geographic comparison

12.3 APAC - Market size and forecast 2025-2030

Chart on APAC - Market size and forecast 2025-2030 ($ million)
Data Table on APAC - Market size and forecast 2025-2030 ($ million)
Chart on APAC - Year-over-year growth 2025-2030 (%)
Data Table on APAC - Year-over-year growth 2025-2030 (%)
Chart on Regional Comparison - APAC
Data Table on Regional Comparison - APAC

12.3.1 China - Market size and forecast 2025-2030

Chart on China - Market size and forecast 2025-2030 ($ million)
Data Table on China - Market size and forecast 2025-2030 ($ million)
Chart on China - Year-over-year growth 2025-2030 (%)
Data Table on China - Year-over-year growth 2025-2030 (%)

12.3.2 Japan - Market size and forecast 2025-2030

Chart on Japan - Market size and forecast 2025-2030 ($ million)
Data Table on Japan - Market size and forecast 2025-2030 ($ million)
Chart on Japan - Year-over-year growth 2025-2030 (%)
Data Table on Japan - Year-over-year growth 2025-2030 (%)

12.3.3 India - Market size and forecast 2025-2030

Chart on India - Market size and forecast 2025-2030 ($ million)
Data Table on India - Market size and forecast 2025-2030 ($ million)
Chart on India - Year-over-year growth 2025-2030 (%)
Data Table on India - Year-over-year growth 2025-2030 (%)

12.3.4 South Korea - Market size and forecast 2025-2030

Chart on South Korea - Market size and forecast 2025-2030 ($ million)
Data Table on South Korea - Market size and forecast 2025-2030 ($ million)
Chart on South Korea - Year-over-year growth 2025-2030 (%)
Data Table on South Korea - Year-over-year growth 2025-2030 (%)

12.3.5 Australia - Market size and forecast 2025-2030

Chart on Australia - Market size and forecast 2025-2030 ($ million)
Data Table on Australia - Market size and forecast 2025-2030 ($ million)
Chart on Australia - Year-over-year growth 2025-2030 (%)
Data Table on Australia - Year-over-year growth 2025-2030 (%)

12.3.6 Indonesia - Market size and forecast 2025-2030

Chart on Indonesia - Market size and forecast 2025-2030 ($ million)
Data Table on Indonesia - Market size and forecast 2025-2030 ($ million)
Chart on Indonesia - Year-over-year growth 2025-2030 (%)
Data Table on Indonesia - Year-over-year growth 2025-2030 (%)

12.4 North America - Market size and forecast 2025-2030

Chart on North America - Market size and forecast 2025-2030 ($ million)
Data Table on North America - Market size and forecast 2025-2030 ($ million)
Chart on North America - Year-over-year growth 2025-2030 (%)
Data Table on North America - Year-over-year growth 2025-2030 (%)
Chart on Regional Comparison - North America
Data Table on Regional Comparison - North America

12.4.1 US - Market size and forecast 2025-2030

Chart on US - Market size and forecast 2025-2030 ($ million)
Data Table on US - Market size and forecast 2025-2030 ($ million)
Chart on US - Year-over-year growth 2025-2030 (%)
Data Table on US - Year-over-year growth 2025-2030 (%)

12.4.2 Canada - Market size and forecast 2025-2030

Chart on Canada - Market size and forecast 2025-2030 ($ million)
Data Table on Canada - Market size and forecast 2025-2030 ($ million)
Chart on Canada - Year-over-year growth 2025-2030 (%)
Data Table on Canada - Year-over-year growth 2025-2030 (%)

12.4.3 Mexico - Market size and forecast 2025-2030

Chart on Mexico - Market size and forecast 2025-2030 ($ million)
Data Table on Mexico - Market size and forecast 2025-2030 ($ million)
Chart on Mexico - Year-over-year growth 2025-2030 (%)
Data Table on Mexico - Year-over-year growth 2025-2030 (%)

12.5 Europe - Market size and forecast 2025-2030

Chart on Europe - Market size and forecast 2025-2030 ($ million)
Data Table on Europe - Market size and forecast 2025-2030 ($ million)
Chart on Europe - Year-over-year growth 2025-2030 (%)
Data Table on Europe - Year-over-year growth 2025-2030 (%)
Chart on Regional Comparison - Europe
Data Table on Regional Comparison - Europe

12.5.1 Germany - Market size and forecast 2025-2030

Chart on Germany - Market size and forecast 2025-2030 ($ million)
Data Table on Germany - Market size and forecast 2025-2030 ($ million)
Chart on Germany - Year-over-year growth 2025-2030 (%)
Data Table on Germany - Year-over-year growth 2025-2030 (%)

12.5.2 UK - Market size and forecast 2025-2030

Chart on UK - Market size and forecast 2025-2030 ($ million)
Data Table on UK - Market size and forecast 2025-2030 ($ million)
Chart on UK - Year-over-year growth 2025-2030 (%)
Data Table on UK - Year-over-year growth 2025-2030 (%)

12.5.3 France - Market size and forecast 2025-2030

Chart on France - Market size and forecast 2025-2030 ($ million)
Data Table on France - Market size and forecast 2025-2030 ($ million)
Chart on France - Year-over-year growth 2025-2030 (%)
Data Table on France - Year-over-year growth 2025-2030 (%)

12.5.4 Italy - Market size and forecast 2025-2030

Chart on Italy - Market size and forecast 2025-2030 ($ million)
Data Table on Italy - Market size and forecast 2025-2030 ($ million)
Chart on Italy - Year-over-year growth 2025-2030 (%)
Data Table on Italy - Year-over-year growth 2025-2030 (%)

12.5.5 Spain - Market size and forecast 2025-2030

Chart on Spain - Market size and forecast 2025-2030 ($ million)
Data Table on Spain - Market size and forecast 2025-2030 ($ million)
Chart on Spain - Year-over-year growth 2025-2030 (%)
Data Table on Spain - Year-over-year growth 2025-2030 (%)

12.5.6 The Netherlands - Market size and forecast 2025-2030

Chart on The Netherlands - Market size and forecast 2025-2030 ($ million)
Data Table on The Netherlands - Market size and forecast 2025-2030 ($ million)
Chart on The Netherlands - Year-over-year growth 2025-2030 (%)
Data Table on The Netherlands - Year-over-year growth 2025-2030 (%)

12.6 South America - Market size and forecast 2025-2030

Chart on South America - Market size and forecast 2025-2030 ($ million)
Data Table on South America - Market size and forecast 2025-2030 ($ million)
Chart on South America - Year-over-year growth 2025-2030 (%)
Data Table on South America - Year-over-year growth 2025-2030 (%)
Chart on Regional Comparison - South America
Data Table on Regional Comparison - South America

12.6.1 Brazil - Market size and forecast 2025-2030

Chart on Brazil - Market size and forecast 2025-2030 ($ million)
Data Table on Brazil - Market size and forecast 2025-2030 ($ million)
Chart on Brazil - Year-over-year growth 2025-2030 (%)
Data Table on Brazil - Year-over-year growth 2025-2030 (%)

12.6.2 Argentina - Market size and forecast 2025-2030

Chart on Argentina - Market size and forecast 2025-2030 ($ million)
Data Table on Argentina - Market size and forecast 2025-2030 ($ million)
Chart on Argentina - Year-over-year growth 2025-2030 (%)
Data Table on Argentina - Year-over-year growth 2025-2030 (%)

12.6.3 Chile - Market size and forecast 2025-2030

Chart on Chile - Market size and forecast 2025-2030 ($ million)
Data Table on Chile - Market size and forecast 2025-2030 ($ million)
Chart on Chile - Year-over-year growth 2025-2030 (%)
Data Table on Chile - Year-over-year growth 2025-2030 (%)

12.7 Middle East and Africa - Market size and forecast 2025-2030

Chart on Middle East and Africa - Market size and forecast 2025-2030 ($ million)
Data Table on Middle East and Africa - Market size and forecast 2025-2030 ($ million)
Chart on Middle East and Africa - Year-over-year growth 2025-2030 (%)
Data Table on Middle East and Africa - Year-over-year growth 2025-2030 (%)
Chart on Regional Comparison - Middle East and Africa
Data Table on Regional Comparison - Middle East and Africa

12.7.1 Saudi Arabia - Market size and forecast 2025-2030

Chart on Saudi Arabia - Market size and forecast 2025-2030 ($ million)
Data Table on Saudi Arabia - Market size and forecast 2025-2030 ($ million)
Chart on Saudi Arabia - Year-over-year growth 2025-2030 (%)
Data Table on Saudi Arabia - Year-over-year growth 2025-2030 (%)

12.7.2 UAE - Market size and forecast 2025-2030

Chart on UAE - Market size and forecast 2025-2030 ($ million)
Data Table on UAE - Market size and forecast 2025-2030 ($ million)
Chart on UAE - Year-over-year growth 2025-2030 (%)
Data Table on UAE - Year-over-year growth 2025-2030 (%)

12.7.3 South Africa - Market size and forecast 2025-2030

Chart on South Africa - Market size and forecast 2025-2030 ($ million)
Data Table on South Africa - Market size and forecast 2025-2030 ($ million)
Chart on South Africa - Year-over-year growth 2025-2030 (%)
Data Table on South Africa - Year-over-year growth 2025-2030 (%)

12.7.4 Israel - Market size and forecast 2025-2030

Chart on Israel - Market size and forecast 2025-2030 ($ million)
Data Table on Israel - Market size and forecast 2025-2030 ($ million)
Chart on Israel - Year-over-year growth 2025-2030 (%)
Data Table on Israel - Year-over-year growth 2025-2030 (%)

12.7.5 Turkey - Market size and forecast 2025-2030

Chart on Turkey - Market size and forecast 2025-2030 ($ million)
Data Table on Turkey - Market size and forecast 2025-2030 ($ million)
Chart on Turkey - Year-over-year growth 2025-2030 (%)
Data Table on Turkey - Year-over-year growth 2025-2030 (%)

12.8 Market opportunity by geography

Market opportunity by geography ($ million)
Data Tables on Market opportunity by geography ($ million)

13. Drivers, Challenges, and Opportunity

13.1 Market drivers

Increasing number of burglaries is increasing market demand for need of high security sensors
Surge in adoption of infrared sensors in drone application
Development of smart cities is augmenting market growth

13.2 Market challenges

Impact of environmental conditions on infrared sensors
Cyclical nature of semiconductor industry
Accuracy and calibration issues during sensor fusion

13.3 Impact of drivers and challenges

Impact of drivers and challenges in 2025 and 2030

13.4 Market opportunities

Adoption of night vision technologies in smart doorbells
Increasing number of connected devices through IoT
Rising investment in autonomous cars

14. Competitive Landscape

14.1 Overview

14.2

Overview on criticality of inputs and factors of differentiation

14.3 Landscape disruption

Overview on factors of disruption

14.4 Industry risks

Impact of key risks on business

15. Competitive Analysis

15.1 Companies profiled

Companies covered

15.2 Company ranking index

15.3 Market positioning of companies

Matrix on companies position and classification

15.4 Amphenol Advanced Sensors

Amphenol Advanced Sensors - Overview
Amphenol Advanced Sensors - Product / Service
Amphenol Advanced Sensors - Key offerings
SWOT

15.5 Bosch Sensortec GmbH

Bosch Sensortec GmbH - Overview
Bosch Sensortec GmbH - Product / Service
Bosch Sensortec GmbH - Key offerings
SWOT

15.6 Honeywell International Inc.

Honeywell International Inc. - Overview
Honeywell International Inc. - Business segments
Honeywell International Inc. - Key news
Honeywell International Inc. - Key offerings
Honeywell International Inc. - Segment focus
SWOT

15.7 Leonardo DRS Inc.

Leonardo DRS Inc. - Overview
Leonardo DRS Inc. - Business segments
Leonardo DRS Inc. - Key offerings
Leonardo DRS Inc. - Segment focus
SWOT

15.8 Melexis NV

Melexis NV - Overview
Melexis NV - Product / Service
Melexis NV - Key offerings
SWOT

15.9 Mitsubishi Electric Corp.

Mitsubishi Electric Corp. - Overview
Mitsubishi Electric Corp. - Business segments
Mitsubishi Electric Corp. - Key offerings
Mitsubishi Electric Corp. - Segment focus
SWOT

15.10 Murata Manufacturing Co. Ltd.

Murata Manufacturing Co. Ltd. - Overview
Murata Manufacturing Co. Ltd. - Business segments
Murata Manufacturing Co. Ltd. - Key offerings
Murata Manufacturing Co. Ltd. - Segment focus
SWOT

15.11 NXP Semiconductors NV

NXP Semiconductors NV - Overview
NXP Semiconductors NV - Business segments
NXP Semiconductors NV - Key news
NXP Semiconductors NV - Key offerings
NXP Semiconductors NV - Segment focus
SWOT

15.12 OMRON Corp.

OMRON Corp. - Overview
OMRON Corp. - Business segments
OMRON Corp. - Key offerings
OMRON Corp. - Segment focus
SWOT

15.13 Panasonic Holdings Corp.

Panasonic Holdings Corp. - Overview
Panasonic Holdings Corp. - Business segments
Panasonic Holdings Corp. - Key news
Panasonic Holdings Corp. - Key offerings
Panasonic Holdings Corp. - Segment focus
SWOT

15.14 RTX Corp.

RTX Corp. - Overview
RTX Corp. - Business segments
RTX Corp. - Key news
RTX Corp. - Key offerings
RTX Corp. - Segment focus
SWOT

15.15 STMicroelectronics NV

STMicroelectronics NV - Overview
STMicroelectronics NV - Business segments
STMicroelectronics NV - Key offerings
STMicroelectronics NV - Segment focus
SWOT

15.16 Teledyne DALSA Inc.

Teledyne DALSA Inc. - Overview
Teledyne DALSA Inc. - Product / Service
Teledyne DALSA Inc. - Key offerings
SWOT

15.17 Teledyne FLIR LLC

Teledyne FLIR LLC - Overview
Teledyne FLIR LLC - Product / Service
Teledyne FLIR LLC - Key offerings
SWOT

15.18 Vishay Intertechnology Inc.

Vishay Intertechnology Inc. - Overview
Vishay Intertechnology Inc. - Business segments
Vishay Intertechnology Inc. - Key news
Vishay Intertechnology Inc. - Key offerings
Vishay Intertechnology Inc. - Segment focus
SWOT

16. Appendix

16.1 Scope of the report

Market definition
Objectives
Notes and caveats

16.2 Inclusions and exclusions checklist

Inclusions checklist
Exclusions checklist

16.3 Currency conversion rates for US$

16.4 Research methodology

16.5 Data procurement

Information sources

16.6 Data validation

16.7 Validation techniques employed for market sizing

16.8 Data synthesis

16.9 360 degree market analysis

16.10 List of abbreviations

Research Methodology

Technavio presents a detailed picture of the market by way of study, synthesis, and summation of data from multiple sources. The analysts have presented the various facets of the market with a particular focus on identifying the key industry influencers. The data thus presented is comprehensive, reliable, and the result of extensive research, both primary and secondary.

INFORMATION SOURCES

Primary sources

  • Manufacturers and suppliers
  • Channel partners
  • Industry experts
  • Strategic decision makers

Secondary sources

  • Industry journals and periodicals
  • Government data
  • Financial reports of key industry players
  • Historical data
  • Press releases

DATA ANALYSIS

Data Synthesis

  • Collation of data
  • Estimation of key figures
  • Analysis of derived insights

Data Validation

  • Triangulation with data models
  • Reference against proprietary databases
  • Corroboration with industry experts

REPORT WRITING

Qualitative

  • Market drivers
  • Market challenges
  • Market trends
  • Five forces analysis

Quantitative

  • Market size and forecast
  • Market segmentation
  • Geographical insights
  • Competitive landscape

Interested in this report?

Get your sample now to see our research methodology and insights!

Download Now

Frequently Asked Questions

Infrared Sensors market growth will increase by USD 368.9 million during 2026-2030.

The Infrared Sensors market is expected to grow at a CAGR of 10.2% during 2026-2030.

Infrared Sensors market is segmented by Application (Commercial, Healthcare, Automotive, Others) Technology (Pyroelectric, Thermopile, Microbolometers, InGaAs, MCT) Type (Thermal, Quantum)

Amphenol Advanced Sensors, Automation Technology GmbH, Bosch Sensortec GmbH, Excelitas Technologies Corp., Hamamatsu Photonics KK, Honeywell International Inc., Leonardo DRS Inc., Lynred, Melexis NV, Mitsubishi Electric Corp., Murata Manufacturing Co. Ltd., NXP Semiconductors NV, OMRON Corp., Panasonic Holdings Corp., RTX Corp., STMicroelectronics NV, Teledyne DALSA Inc., Teledyne FLIR LLC, Vishay Intertechnology Inc. are a few of the key vendors in the Infrared Sensors market.

APAC will register the highest growth rate of 44.9% among the other regions. Therefore, the Infrared Sensors market in APAC is expected to garner significant business opportunities for the vendors during the forecast period.

China, Japan, India, South Korea, Australia, Indonesia, US, Canada, Mexico, Germany, UK, France, Italy, Spain, The Netherlands, Brazil, Argentina, Chile, Saudi Arabia, UAE, South Africa, Israel, Turkey

  • Increasing number of burglaries is increasing market demand for need of high security sensors is the driving factor this market.

The Infrared Sensors market vendors should focus on grabbing business opportunities from the Application segment as it accounted for the largest market share in the base year.
RIA - Research AI Assistant
Ask RIA
