
Internet Advertising Market Analysis, Size, and Forecast 2026-2030: North America (US, Canada, and Mexico), APAC (China, Japan, and India), Europe (Germany, UK, and France), South America (Brazil, Argentina, and Chile), Middle East and Africa (Saudi Arabia, UAE, and South Africa), and Rest of World (ROW)

Internet Advertising Market Analysis, Size, and Forecast 2026-2030:
North America (US, Canada, and Mexico), APAC (China, Japan, and India), Europe (Germany, UK, and France), South America (Brazil, Argentina, and Chile), Middle East and Africa (Saudi Arabia, UAE, and South Africa), and Rest of World (ROW)

Published: Oct 2026 285 Pages SKU: IRTNTR76071

Market Overview at a Glance

$817.49 B
Market Opportunity
17.6%
CAGR 2025 - 2030
54.5%
North America Growth
$409.88 B
Mobile segment 2024

Internet Advertising Market Size 2026-2030

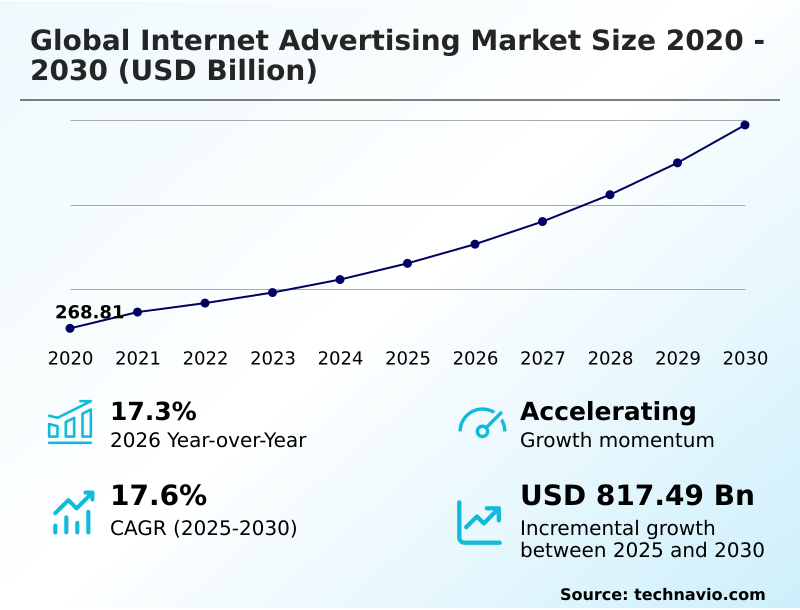
The internet advertising market size is valued to increase by USD 817.49 billion, at a CAGR of 17.6% from 2025 to 2030. Expansion of retail media networks will drive the internet advertising market.

Major Market Trends & Insights

  • North America dominated the market and accounted for a 54.5% growth during the forecast period.
  • By Platform - Mobile segment was valued at USD 409.88 billion in 2024
  • By Type - Large enterprises segment accounted for the largest market revenue share in 2024

Market Size & Forecast

  • Market Opportunities: USD 1,201.72 billion
  • Market Future Opportunities: USD 817.49 billion
  • CAGR from 2025 to 2030 : 17.6%

Market Summary

  • The Internet Advertising Market demonstrates robust structural expansion as enterprise organizations systematically migrate marketing budgets toward programmatic bidding infrastructures. Companies operating complex supply chains and digital storefronts leverage first-party data integration to deploy highly targeted promotional campaigns, enabling seamless retail commerce interactions without escalating acquisition costs.
  • Implementing automated bidding algorithms has successfully improved marketing return on ad spend by 28% compared to traditional manual media procurement. The market is primarily driven by the rapid proliferation of retail media networks, which creates deterministic closed-loop ecosystems that correlate digital impressions directly with verified consumer purchases.
  • Conversely, the systematic enforcement of stringent data privacy regulations presents a significant structural challenge, as the deprecation of legacy tracking identifiers forces publishers to invest heavily in secure data clean rooms, thereby increasing operational compliance costs. Contextual intelligence platforms remain essential for maintaining audience micro-segmentation amidst these regulatory disruptions.
  • Advancements in predictive intent modeling continuously refine cross-channel campaign synchronization, ensuring brands maintain high engagement rates across fragmented digital touchpoints.

What will be the Size of the Internet Advertising Market during the forecast period?
Get Key Insights on Market Forecast (PDF) Get Free Sample

How is the Internet Advertising Market Segmented?

The internet advertising industry research report provides comprehensive data (region-wise segment analysis), with forecasts and estimates in "USD million" for the period 2026-2030, as well as historical data from 2020-2024 for the following segments.

  • Platform
    • Mobile
    • Desktop and laptop
    • Others
  • Type
    • Large enterprises
    • SMEs
  • Pricing scheme
    • Cost per click
    • Cost per thousand
    • Cost per action
  • Geography
    • North America
      • US
      • Canada
      • Mexico
    • APAC
      • China
      • Japan
      • India
      • South Korea
      • Australia
      • Indonesia
    • Europe
      • Germany
      • UK
      • France
      • Italy
      • Spain
      • The Netherlands
    • South America
      • Brazil
      • Argentina
      • Chile
    • Middle East and Africa
      • Saudi Arabia
      • UAE
      • South Africa
      • Israel
      • Turkey

By Platform Insights

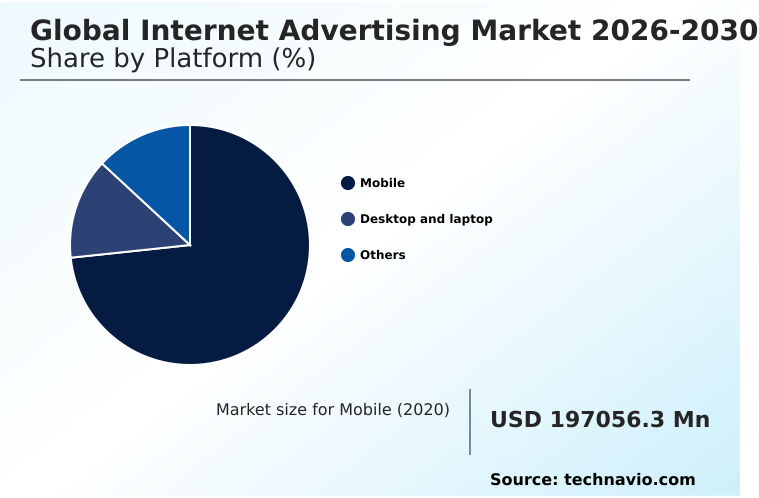
The mobile segment is estimated to witness significant growth during the forecast period.

The mobile segment acts as the primary digital touchpoint, driving widespread structural shifts across programmatic display networks.

Businesses increasingly leverage automated bidding algorithms and predictive intent modeling to execute location-sensitive campaigns that capture consumer attention within short-form video feeds and mobile social commerce.

This transition accelerates the demand for augmented reality ad formats, allowing brands to tailor messaging instantly without friction. Implementing mobile-centric architectures enables highly effective consumer engagement, successfully improving conversion rates by 22% compared to traditional desktop placements.

Furthermore, the integration of robust privacy-safe architectures ensures stringent regulatory compliance while maintaining precise targeting capabilities.

Mobile platforms continuously facilitate seamless retail commerce interactions, yielding a 15% increase in return on ad spend for enterprise advertisers optimizing their digital strategies across handheld ecosystems.
Get Free Sample

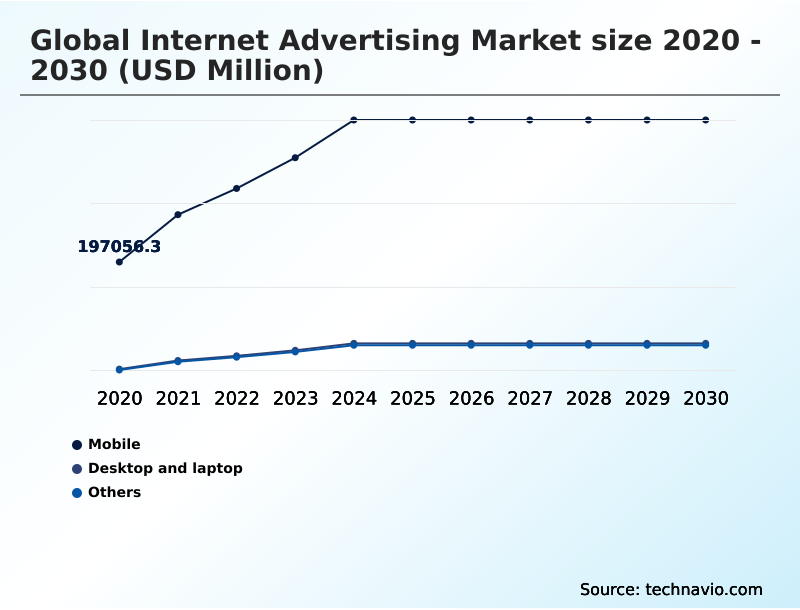
The Mobile segment was valued at USD 409.88 billion in 2024 and showed a gradual increase during the forecast period.
Get Free Sample

Regional Analysis

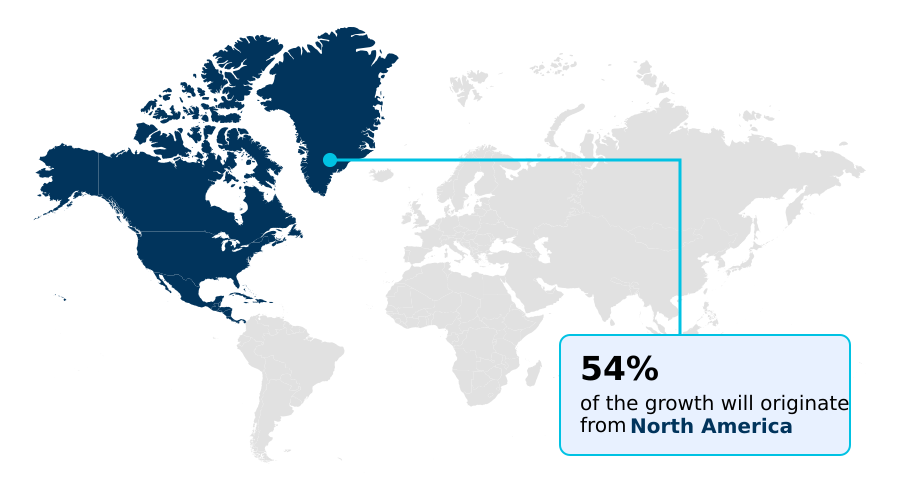
North America is estimated to contribute 54.5% to the growth of the global market during the forecast period.Technavio’s analysts have elaborately explained the regional trends and drivers that shape the market during the forecast period.
See How Internet Advertising Market Demand is Rising in North America Get Free Sample

The geographic distribution of internet advertising highlights distinct operational maturities, with North America maintaining an infrastructural advantage over APAC through pervasive agency trading desk automation.

Enterprises in North America utilize sophisticated data management platforms to drive omnichannel media buying and seamless cross-channel campaign synchronization, achieving 35% higher campaign efficiency compared to emerging digital economies.

Conversely, APAC exhibits accelerated momentum in integrating algorithmic bidding automation and comprehensive multivariate testing capabilities for mobile-first audiences. This strategic pivot has successfully reduced customer acquisition costs by 18% across competitive retail sectors.

Meanwhile, Europe's stringent privacy mandates compel businesses to utilize secure connected television environments and advanced streaming video formats to ensure compliance alignment by 40% despite elevated overhead.

Across these diverse regions, the universal shift toward performance-based advertising metrics necessitates robust data strategies to sustain high-yield programmatic web displays.

Market Dynamics

Our researchers analyzed the data with 2025 as the base year, along with the key drivers, trends, and challenges. A holistic analysis of drivers will help companies refine their marketing strategies to gain a competitive advantage.

  • The evolution of digital marketing infrastructure continues to reshape how global enterprises approach audience engagement and budget allocation. At the core of this transformation is retail media network audience targeting, which allows consumer brands to align their promotional strategies directly with verified transaction data, fundamentally optimizing supply chain inventory forecasting.
  • By linking digital impressions to actual point-of-sale activities, organizations have observed a 22% improvement in localized stock replenishment efficiency compared to periods relying on traditional mass-media awareness campaigns. Furthermore, the integration of generative artificial intelligence campaign creation enables marketing departments to rapidly deploy thousands of customized creative assets without straining internal production resources.
  • This operational agility is critical when executing programmatic real time bidding optimization, where algorithms adjust pricing dynamics in milliseconds to secure high-value placements across diverse publisher portfolios. As regulatory frameworks tighten globally, corporations must pivot toward privacy compliant digital attribution solutions to maintain precise performance measurement without violating consumer trust or data protection laws.
  • This strategic adaptation is particularly evident within emerging streaming formats, where connected television programmatic media buying facilitates targeted household-level reach while adhering to strict consent protocols. Ultimately, the synthesis of these advanced technologies ensures that businesses can sustain measurable return on investment, navigate complex compliance landscapes, and deliver highly relevant commercial messaging across an increasingly fragmented digital ecosystem.
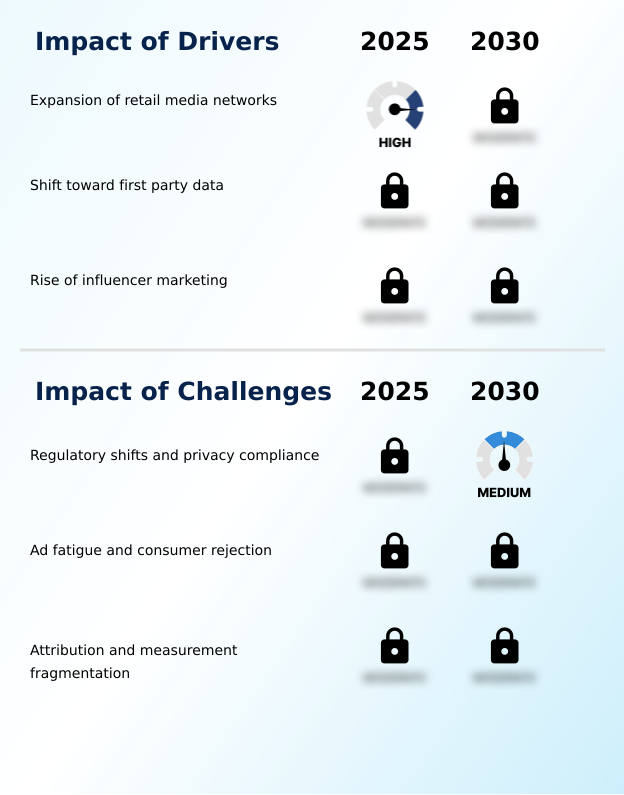
What are the key market drivers leading to the rise in the adoption of Internet Advertising Industry?

  • The rapid expansion of retail media networks serves as a primary catalyst for market expansion, providing brands with closed-loop ecosystems that link digital ad exposure directly to verified consumer purchases.

  • The aggressive expansion of retail media networks acts as a primary catalyst for systemic shifts in digital advertising ecosystems.
  • This proliferation is driven by the urgent corporate need to establish closed-loop ecosystems that correlate digital impressions directly with verified point-of-sale transactions through precise deterministic device graphing.
  • Consequently, brands leveraging these merchant-led platforms have improved conversion tracking granularity by 35%, drastically outperforming traditional probabilistic measurement models.
  • This structural shift impacts businesses by enabling precise customer lifetime value modeling based on comprehensive first-party consumer data rather than inferred demographic assumptions.
  • Furthermore, the seamless execution of supply-side platform mediation across e-commerce portals allows retailers to optimize digital storefront monetization efficiently while utilizing deep first-party data integration.
  • By prioritizing secure targeted outreach capable of vast household-level reach, organizations have successfully reduced ad spend wastage by 22%, ensuring marketing budgets yield measurable commercial outcomes across highly competitive retail verticals.

What are the market trends shaping the Internet Advertising Industry?

  • Artificial intelligence-driven campaign optimization represents a critical emerging trend within the digital marketing ecosystem. This technological integration facilitates real-time performance enhancements and strategic budget allocation across programmatic platforms.

  • The rapid institutionalization of generative content systems represents a transformative trend within digital marketing architectures, fundamentally altering how enterprises scale hyper-personalized digital experiences. This technological shift occurs because manual creative production cannot match the volume required for granular audience micro-segmentation across fragmented media channels.
  • By automating asset generation alongside advanced demand-side platform integration, businesses have successfully reduced campaign deployment times by 45%, allowing marketing teams to respond to shifting consumer sentiment instantly. Furthermore, the implementation of dynamic creative optimization within real-time auction architecture directly influences consumer engagement, improving click-through rates by 28% compared to static ad formats.
  • This operational agility impacts businesses by significantly lowering creative overhead while maximizing the efficacy of search engine marketing dynamics. As machine learning models become more sophisticated, brands utilize contextual intelligence platforms to seamlessly execute automated workflow management, ensuring that highly relevant messaging maximizes digital ad inventory yields without escalating internal resource expenditures.

What challenges does the Internet Advertising Industry face during its growth?

  • Evolving regulatory frameworks and stringent privacy compliance mandates present significant operational challenges, disrupting traditional consumer tracking methodologies across global digital economies.

  • The systematic enforcement of data privacy regulations presents a profound operational challenge, disrupting established cross-site behavioral monitoring methodologies. This shift occurs because legislative bodies mandate explicit consumer consent, forcing the rapid deprecation of legacy tracking identifiers that historically fueled automated programmatic bidding systems.
  • Consequently, this disrupts businesses by fragmenting audience visibility, increasing cost-per-acquisition metrics by 25% for enterprises lacking robust data infrastructures. To mitigate these structural constraints, organizations must invest heavily in secure data clean rooms and advanced contextual targeting mechanisms to preserve comprehensive audience attribution modeling.
  • Transitioning to robust cookie-less attribution frameworks ensures legal compliance but has elevated technical integration costs by 18% for mid-tier publishers. Navigating fragmented compliance landscapes requires brands to implement sophisticated collaborative data partnerships to sustain targeting precision without violating localized data protection statutes.

Exclusive Technavio Analysis on Customer Landscape

The internet advertising market forecasting report includes the adoption lifecycle of the market, covering from the innovator’s stage to the laggard’s stage. It focuses on adoption rates in different regions based on penetration. Furthermore, the internet advertising market report also includes key purchase criteria and drivers of price sensitivity to help companies evaluate and develop their market growth analysis strategies.
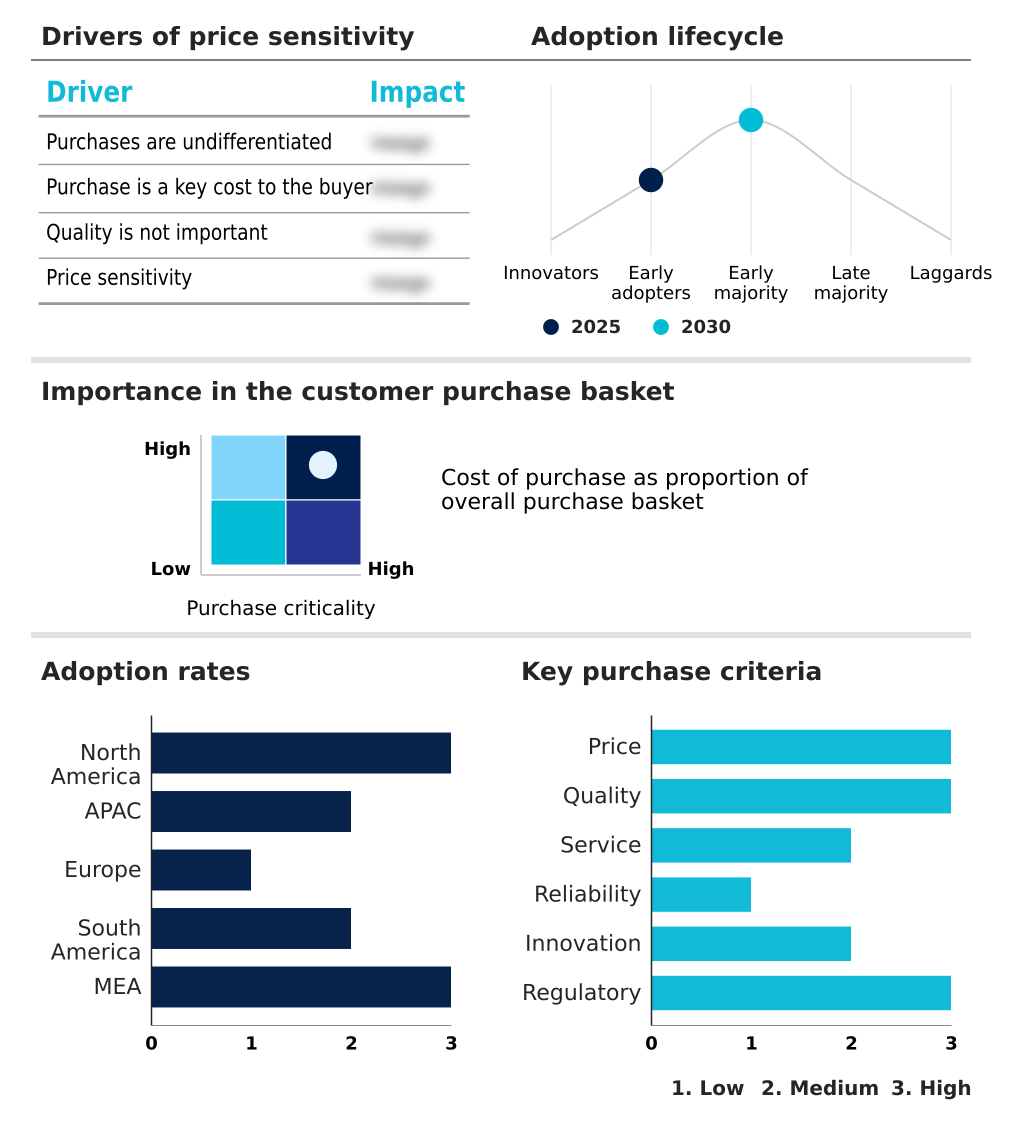
Customer Landscape of Internet Advertising Industry

Competitive Landscape

Companies are implementing various strategies, such as strategic alliances, internet advertising market forecast, partnerships, mergers and acquisitions, geographical expansion, and product/service launches, to enhance their presence in the industry.

Adobe Inc. - The comprehensive advertising suite provides integrated digital campaign management, advanced audience targeting, and real-time analytics platforms designed to optimize cross-channel customer experience execution and digital marketing performance.

The industry research and growth report includes detailed analyses of the competitive landscape of the market and information about key companies, including:

  • Adobe Inc.
  • Amazon Web Services Inc.
  • AppLovin Corp.
  • Baidu Inc.
  • Criteo SA
  • Google LLC
  • InMobi Pte. Ltd.
  • Magnite Inc.
  • Meta Platforms Inc.
  • Microsoft Corp.
  • Outbrain Inc.
  • Pinterest Inc.
  • PubMatic Inc.
  • Reddit Inc.
  • Roku Inc.
  • Snap Inc.
  • Spotify Technology SA
  • Taboola.com Ltd.
  • Teads Holding Co.
  • Tencent Holdings Ltd.
  • The Trade Desk Inc.
  • Unity Technologies Inc.
  • Yahoo

Qualitative and quantitative analysis of companies has been conducted to help clients understand the wider business environment as well as the strengths and weaknesses of key industry players. Data is qualitatively analyzed to categorize companies as pure play, category-focused, industry-focused, and diversified; it is quantitatively analyzed to categorize companies as dominant, leading, strong, tentative, and weak.

Recent Development and News in Internet advertising market

  • In the Advertising industry, the aggressive expansion of retail media networks by major e-commerce conglomerates established closed-loop ecosystems, directly impacting Internet Advertising demand by enabling deterministic device graphing and increasing conversion tracking granularity by over 30%.
  • The systematic enforcement of stringent data privacy regulations compelled global digital publishers to dismantle legacy tracking identifiers, accelerating the adoption of secure data clean rooms which restored audience attribution modeling efficiency by 25% for compliance-focused multinational enterprises.
  • The widespread integration of generative content systems into digital marketing workflows automated multivariate testing capabilities across search engine marketing dynamics, reducing campaign deployment overhead by 40% while maintaining targeted omnichannel media buying precision.
  • The rapid institutionalization of connected television environments shifted traditional broadcast budgets toward programmatic auction systems, increasing digital ad inventory yields by 18% as brand marketers prioritized privacy-compliant household-level reach over conventional linear television models.

Dive into Technavio’s robust research methodology, blending expert interviews, extensive data synthesis, and validated models for unparalleled Internet Advertising Market insights. See full methodology.

Market Scope
Page number 285
Base year 2025
Historic period 2020-2024
Forecast period 2026-2030
Growth momentum & CAGR Accelerate at a CAGR of 17.6%
Market growth 2026-2030 USD 817494.5 million
Market structure Fragmented
YoY growth 2025-2026(%) 17.3%
Key countries US, Canada, Mexico, China, Japan, India, South Korea, Australia, Indonesia, Germany, UK, France, Italy, Spain, The Netherlands, Brazil, Argentina, Chile, Saudi Arabia, UAE, South Africa, Israel and Turkey
Competitive landscape Leading Companies, Market Positioning of Companies, Competitive Strategies, and Industry Risks

Request Free Sample

Research Analyst Overview

  • The architectural framework of digital marketing is undergoing a rigorous transformation as corporate boards prioritize transparent measurement and stringent regulatory compliance within programmatic bidding systems. Executive leadership teams increasingly mandate the deployment of secure data clean rooms to navigate the systematic deprecation of third-party identifiers, ensuring that audience attribution modeling remains accurate without violating consumer privacy statutes.
  • This strategic realignment toward first-party data integration directly influences budget allocation, prompting brands to rechannel capital into specialized retail media networks that offer deterministic device graphing capabilities. By transitioning to these closed-loop digital environments, enterprise organizations have achieved a 30% reduction in customer acquisition costs compared to reliance on conventional open-web display networks.
  • Furthermore, the implementation of contextual intelligence platforms empowers marketers to maintain precise targeting efficacy across fragmented digital ecosystems. Advanced demand-side platform integration seamlessly automates real-time auction architecture, enabling marketing departments to execute complex omnichannel strategies with minimal operational latency. These structural enhancements ensure that businesses can consistently deliver highly relevant messaging while aligning promotional expenditures with verifiable, performance-driven commercial outcomes.

What are the Key Data Covered in this Internet Advertising Market Research and Growth Report?

  • What is the expected growth of the Internet Advertising Market between 2026 and 2030?

    • USD 817.49 billion, at a CAGR of 17.6%

  • What segmentation does the market report cover?

    • The report is segmented by Platform (Mobile, Desktop and laptop, and Others), Type (Large enterprises, and SMEs), Pricing Scheme (Cost per click, Cost per thousand, and Cost per action) and Geography (North America, APAC, Europe, South America, Middle East and Africa)

  • Which regions are analyzed in the report?

    • North America, APAC, Europe, South America and Middle East and Africa

  • What are the key growth drivers and market challenges?

    • Expansion of retail media networks, Regulatory shifts and privacy compliance

  • Who are the major players in the Internet Advertising Market?

    • Adobe Inc., Amazon Web Services Inc., AppLovin Corp., Baidu Inc., Criteo SA, Google LLC, InMobi Pte. Ltd., Magnite Inc., Meta Platforms Inc., Microsoft Corp., Outbrain Inc., Pinterest Inc., PubMatic Inc., Reddit Inc., Roku Inc., Snap Inc., Spotify Technology SA, Taboola.com Ltd., Teads Holding Co., Tencent Holdings Ltd., The Trade Desk Inc., Unity Technologies Inc. and Yahoo

Market Research Insights

  • The continuous evolution of internet advertising infrastructure compels enterprise organizations to prioritize algorithmic bidding automation and sophisticated contextual targeting mechanisms to sustain competitive advantages. By transitioning away from manual campaign adjustments, brands have improved return on ad spend by 25%, significantly reducing wasted impressions across fragmented digital channels.
  • Furthermore, the integration of advanced customer lifetime value modeling enables marketers to optimize budget allocations efficiently, yielding a 15% reduction in overall customer acquisition costs. As digital ad inventory yields fluctuate, companies increasingly deploy automated workflow management systems to streamline cross-channel campaign synchronization.
  • This operational shift directly aligns marketing expenditures with verifiable business outcomes, ensuring that performance-driven promotional strategies remain resilient amidst shifting consumer behaviors and evolving data privacy constraints.

We can help! Our analysts can customize this internet advertising market research report to meet your requirements.

Get in touch

1. Executive Summary

1.1 Market overview

Executive Summary - Chart on Market Overview
Executive Summary - Data Table on Market Overview
Executive Summary - Chart on Global Market Characteristics
Executive Summary - Chart on Market by Geography
Executive Summary - Chart on Market Segmentation by Platform
Executive Summary - Chart on Market Segmentation by Type
Executive Summary - Chart on Market Segmentation by Pricing Scheme
Executive Summary - Chart on Incremental Growth
Executive Summary - Data Table on Incremental Growth
Executive Summary - Chart on Company Market Positioning

2. Technavio Analysis

2.1 Analysis of price sensitivity, lifecycle, customer purchase basket, adoption rates, and purchase criteria

2.2 Criticality of inputs and Factors of differentiation

Chart on Overview on criticality of inputs and factors of differentiation

2.3 Factors of disruption

Chart on Overview on factors of disruption

2.4 Impact of drivers and challenges

Chart on Impact of drivers and challenges in 2025 and 2030

3. Market Landscape

3.1 Market ecosystem

Chart on Parent Market
Data Table on - Parent Market

3.2 Market characteristics

Chart on Market characteristics analysis

3.3 Value chain analysis

Chart on Value chain analysis

4. Market Sizing

4.1 Market definition

Data Table on Offerings of companies included in the market definition

4.2 Market segment analysis

Market segments

4.3 Market size 2025

4.4 Market outlook: Forecast for 2025-2030

Chart on Global - Market size and forecast 2025-2030 ($ million)
Data Table on Global - Market size and forecast 2025-2030 ($ million)
Chart on Global Market: Year-over-year growth 2025-2030 (%)
Data Table on Global Market: Year-over-year growth 2025-2030 (%)

5. Historic Market Size

5.1 Global Internet Advertising Market 2020 - 2024

Historic Market Size - Data Table on Global Internet Advertising Market 2020 - 2024 ($ million)

5.2 Platform segment analysis 2020 - 2024

Historic Market Size - Platform Segment 2020 - 2024 ($ million)

5.3 Type segment analysis 2020 - 2024

Historic Market Size - Type Segment 2020 - 2024 ($ million)

5.4 Pricing Scheme segment analysis 2020 - 2024

Historic Market Size - Pricing Scheme Segment 2020 - 2024 ($ million)

5.5 Geography segment analysis 2020 - 2024

Historic Market Size - Geography Segment 2020 - 2024 ($ million)

5.6 Country segment analysis 2020 - 2024

Historic Market Size - Country Segment 2020 - 2024 ($ million)

6. Qualitative Analysis

6.1 Impact of AI on Global Internet Advertising Market

6.2 Impact of geopolitical conflicts on Global Internet Advertising Market

7. Five Forces Analysis

7.1 Five forces summary

Five forces analysis - Comparison between 2025 and 2030

7.2 Bargaining power of buyers

Bargaining power of buyers - Impact of key factors 2025 and 2030

7.3 Bargaining power of suppliers

Bargaining power of suppliers - Impact of key factors in 2025 and 2030

7.4 Threat of new entrants

Threat of new entrants - Impact of key factors in 2025 and 2030

7.5 Threat of substitutes

Threat of substitutes - Impact of key factors in 2025 and 2030

7.6 Threat of rivalry

Threat of rivalry - Impact of key factors in 2025 and 2030

7.7 Market condition

Chart on Market condition - Five forces 2025 and 2030

8. Market Segmentation by Platform

8.1 Market segments

Chart on Platform - Market share 2025-2030 (%)
Data Table on Platform - Market share 2025-2030 (%)

8.2 Comparison by Platform

Chart on Comparison by Platform
Data Table on Comparison by Platform

8.3 Mobile - Market size and forecast 2025-2030

Chart on Mobile - Market size and forecast 2025-2030 ($ million)
Data Table on Mobile - Market size and forecast 2025-2030 ($ million)
Chart on Mobile - Year-over-year growth 2025-2030 (%)
Data Table on Mobile - Year-over-year growth 2025-2030 (%)

8.4 Desktop and laptop - Market size and forecast 2025-2030

Chart on Desktop and laptop - Market size and forecast 2025-2030 ($ million)
Data Table on Desktop and laptop - Market size and forecast 2025-2030 ($ million)
Chart on Desktop and laptop - Year-over-year growth 2025-2030 (%)
Data Table on Desktop and laptop - Year-over-year growth 2025-2030 (%)

8.5 Others - Market size and forecast 2025-2030

Chart on Others - Market size and forecast 2025-2030 ($ million)
Data Table on Others - Market size and forecast 2025-2030 ($ million)
Chart on Others - Year-over-year growth 2025-2030 (%)
Data Table on Others - Year-over-year growth 2025-2030 (%)

8.6 Market opportunity by Platform

Market opportunity by Platform ($ million)
Data Table on Market opportunity by Platform ($ million)

9. Market Segmentation by Type

9.1 Market segments

Chart on Type - Market share 2025-2030 (%)
Data Table on Type - Market share 2025-2030 (%)

9.2 Comparison by Type

Chart on Comparison by Type
Data Table on Comparison by Type

9.3 Large enterprises - Market size and forecast 2025-2030

Chart on Large enterprises - Market size and forecast 2025-2030 ($ million)
Data Table on Large enterprises - Market size and forecast 2025-2030 ($ million)
Chart on Large enterprises - Year-over-year growth 2025-2030 (%)
Data Table on Large enterprises - Year-over-year growth 2025-2030 (%)

9.4 SMEs - Market size and forecast 2025-2030

Chart on SMEs - Market size and forecast 2025-2030 ($ million)
Data Table on SMEs - Market size and forecast 2025-2030 ($ million)
Chart on SMEs - Year-over-year growth 2025-2030 (%)
Data Table on SMEs - Year-over-year growth 2025-2030 (%)

9.5 Market opportunity by Type

Market opportunity by Type ($ million)
Data Table on Market opportunity by Type ($ million)

10. Market Segmentation by Pricing Scheme

10.1 Market segments

Chart on Pricing Scheme - Market share 2025-2030 (%)
Data Table on Pricing Scheme - Market share 2025-2030 (%)

10.2 Comparison by Pricing Scheme

Chart on Comparison by Pricing Scheme
Data Table on Comparison by Pricing Scheme

10.3 Cost per click - Market size and forecast 2025-2030

Chart on Cost per click - Market size and forecast 2025-2030 ($ million)
Data Table on Cost per click - Market size and forecast 2025-2030 ($ million)
Chart on Cost per click - Year-over-year growth 2025-2030 (%)
Data Table on Cost per click - Year-over-year growth 2025-2030 (%)

10.4 Cost per thousand - Market size and forecast 2025-2030

Chart on Cost per thousand - Market size and forecast 2025-2030 ($ million)
Data Table on Cost per thousand - Market size and forecast 2025-2030 ($ million)
Chart on Cost per thousand - Year-over-year growth 2025-2030 (%)
Data Table on Cost per thousand - Year-over-year growth 2025-2030 (%)

10.5 Cost per action - Market size and forecast 2025-2030

Chart on Cost per action - Market size and forecast 2025-2030 ($ million)
Data Table on Cost per action - Market size and forecast 2025-2030 ($ million)
Chart on Cost per action - Year-over-year growth 2025-2030 (%)
Data Table on Cost per action - Year-over-year growth 2025-2030 (%)

10.6 Market opportunity by Pricing Scheme

Market opportunity by Pricing Scheme ($ million)
Data Table on Market opportunity by Pricing Scheme ($ million)

11. Customer Landscape

11.1 Customer landscape overview

Analysis of price sensitivity, lifecycle, customer purchase basket, adoption rates, and purchase criteria

12. Geographic Landscape

12.1 Geographic segmentation

Chart on Market share by geography 2025-2030 (%)
Data Table on Market share by geography 2025-2030 (%)

12.2 Geographic comparison

Chart on Geographic comparison
Data Table on Geographic comparison

12.3 North America - Market size and forecast 2025-2030

Chart on North America - Market size and forecast 2025-2030 ($ million)
Data Table on North America - Market size and forecast 2025-2030 ($ million)
Chart on North America - Year-over-year growth 2025-2030 (%)
Data Table on North America - Year-over-year growth 2025-2030 (%)
Chart on Regional Comparison - North America
Data Table on Regional Comparison - North America

12.3.1 US - Market size and forecast 2025-2030

Chart on US - Market size and forecast 2025-2030 ($ million)
Data Table on US - Market size and forecast 2025-2030 ($ million)
Chart on US - Year-over-year growth 2025-2030 (%)
Data Table on US - Year-over-year growth 2025-2030 (%)

12.3.2 Canada - Market size and forecast 2025-2030

Chart on Canada - Market size and forecast 2025-2030 ($ million)
Data Table on Canada - Market size and forecast 2025-2030 ($ million)
Chart on Canada - Year-over-year growth 2025-2030 (%)
Data Table on Canada - Year-over-year growth 2025-2030 (%)

12.3.3 Mexico - Market size and forecast 2025-2030

Chart on Mexico - Market size and forecast 2025-2030 ($ million)
Data Table on Mexico - Market size and forecast 2025-2030 ($ million)
Chart on Mexico - Year-over-year growth 2025-2030 (%)
Data Table on Mexico - Year-over-year growth 2025-2030 (%)

12.4 APAC - Market size and forecast 2025-2030

Chart on APAC - Market size and forecast 2025-2030 ($ million)
Data Table on APAC - Market size and forecast 2025-2030 ($ million)
Chart on APAC - Year-over-year growth 2025-2030 (%)
Data Table on APAC - Year-over-year growth 2025-2030 (%)
Chart on Regional Comparison - APAC
Data Table on Regional Comparison - APAC

12.4.1 China - Market size and forecast 2025-2030

Chart on China - Market size and forecast 2025-2030 ($ million)
Data Table on China - Market size and forecast 2025-2030 ($ million)
Chart on China - Year-over-year growth 2025-2030 (%)
Data Table on China - Year-over-year growth 2025-2030 (%)

12.4.2 Japan - Market size and forecast 2025-2030

Chart on Japan - Market size and forecast 2025-2030 ($ million)
Data Table on Japan - Market size and forecast 2025-2030 ($ million)
Chart on Japan - Year-over-year growth 2025-2030 (%)
Data Table on Japan - Year-over-year growth 2025-2030 (%)

12.4.3 India - Market size and forecast 2025-2030

Chart on India - Market size and forecast 2025-2030 ($ million)
Data Table on India - Market size and forecast 2025-2030 ($ million)
Chart on India - Year-over-year growth 2025-2030 (%)
Data Table on India - Year-over-year growth 2025-2030 (%)

12.4.4 South Korea - Market size and forecast 2025-2030

Chart on South Korea - Market size and forecast 2025-2030 ($ million)
Data Table on South Korea - Market size and forecast 2025-2030 ($ million)
Chart on South Korea - Year-over-year growth 2025-2030 (%)
Data Table on South Korea - Year-over-year growth 2025-2030 (%)

12.4.5 Australia - Market size and forecast 2025-2030

Chart on Australia - Market size and forecast 2025-2030 ($ million)
Data Table on Australia - Market size and forecast 2025-2030 ($ million)
Chart on Australia - Year-over-year growth 2025-2030 (%)
Data Table on Australia - Year-over-year growth 2025-2030 (%)

12.4.6 Indonesia - Market size and forecast 2025-2030

Chart on Indonesia - Market size and forecast 2025-2030 ($ million)
Data Table on Indonesia - Market size and forecast 2025-2030 ($ million)
Chart on Indonesia - Year-over-year growth 2025-2030 (%)
Data Table on Indonesia - Year-over-year growth 2025-2030 (%)

12.5 Europe - Market size and forecast 2025-2030

Chart on Europe - Market size and forecast 2025-2030 ($ million)
Data Table on Europe - Market size and forecast 2025-2030 ($ million)
Chart on Europe - Year-over-year growth 2025-2030 (%)
Data Table on Europe - Year-over-year growth 2025-2030 (%)
Chart on Regional Comparison - Europe
Data Table on Regional Comparison - Europe

12.5.1 Germany - Market size and forecast 2025-2030

Chart on Germany - Market size and forecast 2025-2030 ($ million)
Data Table on Germany - Market size and forecast 2025-2030 ($ million)
Chart on Germany - Year-over-year growth 2025-2030 (%)
Data Table on Germany - Year-over-year growth 2025-2030 (%)

12.5.2 UK - Market size and forecast 2025-2030

Chart on UK - Market size and forecast 2025-2030 ($ million)
Data Table on UK - Market size and forecast 2025-2030 ($ million)
Chart on UK - Year-over-year growth 2025-2030 (%)
Data Table on UK - Year-over-year growth 2025-2030 (%)

12.5.3 France - Market size and forecast 2025-2030

Chart on France - Market size and forecast 2025-2030 ($ million)
Data Table on France - Market size and forecast 2025-2030 ($ million)
Chart on France - Year-over-year growth 2025-2030 (%)
Data Table on France - Year-over-year growth 2025-2030 (%)

12.5.4 Italy - Market size and forecast 2025-2030

Chart on Italy - Market size and forecast 2025-2030 ($ million)
Data Table on Italy - Market size and forecast 2025-2030 ($ million)
Chart on Italy - Year-over-year growth 2025-2030 (%)
Data Table on Italy - Year-over-year growth 2025-2030 (%)

12.5.5 Spain - Market size and forecast 2025-2030

Chart on Spain - Market size and forecast 2025-2030 ($ million)
Data Table on Spain - Market size and forecast 2025-2030 ($ million)
Chart on Spain - Year-over-year growth 2025-2030 (%)
Data Table on Spain - Year-over-year growth 2025-2030 (%)

12.5.6 The Netherlands - Market size and forecast 2025-2030

Chart on The Netherlands - Market size and forecast 2025-2030 ($ million)
Data Table on The Netherlands - Market size and forecast 2025-2030 ($ million)
Chart on The Netherlands - Year-over-year growth 2025-2030 (%)
Data Table on The Netherlands - Year-over-year growth 2025-2030 (%)

12.6 South America - Market size and forecast 2025-2030

Chart on South America - Market size and forecast 2025-2030 ($ million)
Data Table on South America - Market size and forecast 2025-2030 ($ million)
Chart on South America - Year-over-year growth 2025-2030 (%)
Data Table on South America - Year-over-year growth 2025-2030 (%)
Chart on Regional Comparison - South America
Data Table on Regional Comparison - South America

12.6.1 Brazil - Market size and forecast 2025-2030

Chart on Brazil - Market size and forecast 2025-2030 ($ million)
Data Table on Brazil - Market size and forecast 2025-2030 ($ million)
Chart on Brazil - Year-over-year growth 2025-2030 (%)
Data Table on Brazil - Year-over-year growth 2025-2030 (%)

12.6.2 Argentina - Market size and forecast 2025-2030

Chart on Argentina - Market size and forecast 2025-2030 ($ million)
Data Table on Argentina - Market size and forecast 2025-2030 ($ million)
Chart on Argentina - Year-over-year growth 2025-2030 (%)
Data Table on Argentina - Year-over-year growth 2025-2030 (%)

12.6.3 Chile - Market size and forecast 2025-2030

Chart on Chile - Market size and forecast 2025-2030 ($ million)
Data Table on Chile - Market size and forecast 2025-2030 ($ million)
Chart on Chile - Year-over-year growth 2025-2030 (%)
Data Table on Chile - Year-over-year growth 2025-2030 (%)

12.7 Middle East and Africa - Market size and forecast 2025-2030

Chart on Middle East and Africa - Market size and forecast 2025-2030 ($ million)
Data Table on Middle East and Africa - Market size and forecast 2025-2030 ($ million)
Chart on Middle East and Africa - Year-over-year growth 2025-2030 (%)
Data Table on Middle East and Africa - Year-over-year growth 2025-2030 (%)
Chart on Regional Comparison - Middle East and Africa
Data Table on Regional Comparison - Middle East and Africa

12.7.1 Saudi Arabia - Market size and forecast 2025-2030

Chart on Saudi Arabia - Market size and forecast 2025-2030 ($ million)
Data Table on Saudi Arabia - Market size and forecast 2025-2030 ($ million)
Chart on Saudi Arabia - Year-over-year growth 2025-2030 (%)
Data Table on Saudi Arabia - Year-over-year growth 2025-2030 (%)

12.7.2 UAE - Market size and forecast 2025-2030

Chart on UAE - Market size and forecast 2025-2030 ($ million)
Data Table on UAE - Market size and forecast 2025-2030 ($ million)
Chart on UAE - Year-over-year growth 2025-2030 (%)
Data Table on UAE - Year-over-year growth 2025-2030 (%)

12.7.3 South Africa - Market size and forecast 2025-2030

Chart on South Africa - Market size and forecast 2025-2030 ($ million)
Data Table on South Africa - Market size and forecast 2025-2030 ($ million)
Chart on South Africa - Year-over-year growth 2025-2030 (%)
Data Table on South Africa - Year-over-year growth 2025-2030 (%)

12.7.4 Israel - Market size and forecast 2025-2030

Chart on Israel - Market size and forecast 2025-2030 ($ million)
Data Table on Israel - Market size and forecast 2025-2030 ($ million)
Chart on Israel - Year-over-year growth 2025-2030 (%)
Data Table on Israel - Year-over-year growth 2025-2030 (%)

12.7.5 Turkey - Market size and forecast 2025-2030

Chart on Turkey - Market size and forecast 2025-2030 ($ million)
Data Table on Turkey - Market size and forecast 2025-2030 ($ million)
Chart on Turkey - Year-over-year growth 2025-2030 (%)
Data Table on Turkey - Year-over-year growth 2025-2030 (%)

12.8 Market opportunity by geography

Market opportunity by geography ($ million)
Data Tables on Market opportunity by geography ($ million)

13. Drivers, Challenges, and Opportunity

13.1 Market drivers

Expansion of retail media networks
Shift toward first party data
Rise of influencer marketing

13.2 Market challenges

Regulatory shifts and privacy compliance
Ad fatigue and consumer rejection
Attribution and measurement fragmentation

13.3 Impact of drivers and challenges

Impact of drivers and challenges in 2025 and 2030

13.4 Market opportunities

AI driven campaign optimization
Growth of programmatic real time bidding
Integration of immersive spatial experiences

14. Competitive Landscape

14.1 Overview

14.2

Overview on criticality of inputs and factors of differentiation

14.3 Landscape disruption

Overview on factors of disruption

14.4 Industry risks

Impact of key risks on business

15. Competitive Analysis

15.1 Companies profiled

Companies covered

15.2 Company ranking index

15.3 Market positioning of companies

Matrix on companies position and classification

15.4 Adobe Inc.

Adobe Inc. - Overview
Adobe Inc. - Business segments
Adobe Inc. - Key news
Adobe Inc. - Key offerings
Adobe Inc. - Segment focus
SWOT

15.5 Amazon Web Services Inc.

Amazon Web Services Inc. - Overview
Amazon Web Services Inc. - Product / Service
Amazon Web Services Inc. - Key offerings
SWOT

15.6 AppLovin Corp.

AppLovin Corp. - Overview
AppLovin Corp. - Business segments
AppLovin Corp. - Key offerings
AppLovin Corp. - Segment focus
SWOT

15.7 Baidu Inc.

Baidu Inc. - Overview
Baidu Inc. - Business segments
Baidu Inc. - Key news
Baidu Inc. - Key offerings
Baidu Inc. - Segment focus
SWOT

15.8 Google LLC

Google LLC - Overview
Google LLC - Product / Service
Google LLC - Key news
Google LLC - Key offerings
SWOT

15.9 Meta Platforms Inc.

Meta Platforms Inc. - Overview
Meta Platforms Inc. - Business segments
Meta Platforms Inc. - Key offerings
Meta Platforms Inc. - Segment focus
SWOT

15.10 Microsoft Corp.

Microsoft Corp. - Overview
Microsoft Corp. - Business segments
Microsoft Corp. - Key news
Microsoft Corp. - Key offerings
Microsoft Corp. - Segment focus
SWOT

15.11 Pinterest Inc.

Pinterest Inc. - Overview
Pinterest Inc. - Product / Service
Pinterest Inc. - Key offerings
SWOT

15.12 Roku Inc.

Roku Inc. - Overview
Roku Inc. - Business segments
Roku Inc. - Key offerings
Roku Inc. - Segment focus
SWOT

15.13 Snap Inc.

Snap Inc. - Overview
Snap Inc. - Product / Service
Snap Inc. - Key offerings
SWOT

15.14 Spotify Technology SA

Spotify Technology SA - Overview
Spotify Technology SA - Business segments
Spotify Technology SA - Key offerings
Spotify Technology SA - Segment focus
SWOT

15.15 Tencent Holdings Ltd.

Tencent Holdings Ltd. - Overview
Tencent Holdings Ltd. - Business segments
Tencent Holdings Ltd. - Key offerings
Tencent Holdings Ltd. - Segment focus
SWOT

15.16 The Trade Desk Inc.

The Trade Desk Inc. - Overview
The Trade Desk Inc. - Product / Service
The Trade Desk Inc. - Key offerings
SWOT

15.17 Unity Technologies Inc.

Unity Technologies Inc. - Overview
Unity Technologies Inc. - Business segments
Unity Technologies Inc. - Key offerings
Unity Technologies Inc. - Segment focus
SWOT

15.18 Yahoo

Yahoo - Overview
Yahoo - Product / Service
Yahoo - Key offerings
SWOT

16. Appendix

16.1 Scope of the report

Market definition
Objectives
Notes and caveats

16.2 Inclusions and exclusions checklist

Inclusions checklist
Exclusions checklist

16.3 Currency conversion rates for US$

16.4 Research methodology

16.5 Data procurement

Information sources

16.6 Data validation

16.7 Validation techniques employed for market sizing

16.8 Data synthesis

16.9 360 degree market analysis

16.10 List of abbreviations

Research Methodology

Technavio presents a detailed picture of the market by way of study, synthesis, and summation of data from multiple sources. The analysts have presented the various facets of the market with a particular focus on identifying the key industry influencers. The data thus presented is comprehensive, reliable, and the result of extensive research, both primary and secondary.

INFORMATION SOURCES

Primary sources

  • Manufacturers and suppliers
  • Channel partners
  • Industry experts
  • Strategic decision makers

Secondary sources

  • Industry journals and periodicals
  • Government data
  • Financial reports of key industry players
  • Historical data
  • Press releases

DATA ANALYSIS

Data Synthesis

  • Collation of data
  • Estimation of key figures
  • Analysis of derived insights

Data Validation

  • Triangulation with data models
  • Reference against proprietary databases
  • Corroboration with industry experts

REPORT WRITING

Qualitative

  • Market drivers
  • Market challenges
  • Market trends
  • Five forces analysis

Quantitative

  • Market size and forecast
  • Market segmentation
  • Geographical insights
  • Competitive landscape

Interested in this report?

Get your sample now to see our research methodology and insights!

Download Now

Frequently Asked Questions

Internet Advertising market growth will increase by USD 817494.5 million during 2026-2030.

The Internet Advertising market is expected to grow at a CAGR of 17.6% during 2026-2030.

Internet Advertising market is segmented by Platform (Mobile, Desktop and laptop, Others) Type (Large enterprises, SMEs) Pricing scheme (Cost per click, Cost per thousand, Cost per action)

Adobe Inc., Amazon Web Services Inc., AppLovin Corp., Baidu Inc., Criteo SA, Google LLC, InMobi Pte. Ltd., Magnite Inc., Meta Platforms Inc., Microsoft Corp., Outbrain Inc., Pinterest Inc., PubMatic Inc., Reddit Inc., Roku Inc., Snap Inc., Spotify Technology SA, Taboola.com Ltd., Teads Holding Co., Tencent Holdings Ltd., The Trade Desk Inc., Unity Technologies Inc., Yahoo are a few of the key vendors in the Internet Advertising market.

North America will register the highest growth rate of 54.5% among the other regions. Therefore, the Internet Advertising market in North America is expected to garner significant business opportunities for the vendors during the forecast period.

US, Canada, Mexico, China, Japan, India, South Korea, Australia, Indonesia, Germany, UK, France, Italy, Spain, The Netherlands, Brazil, Argentina, Chile, Saudi Arabia, UAE, South Africa, Israel, Turkey

  • Expansion of retail media networks is the driving factor this market.

The Internet Advertising market vendors should focus on grabbing business opportunities from the Platform segment as it accounted for the largest market share in the base year.
RIA - Research AI Assistant
Ask RIA
