
K-12 Arts And Crafts Material Market Analysis, Size, and Forecast 2026-2030: APAC (China, Japan, and India), Europe (Germany, UK, and France), North America (US, Canada, and Mexico), Middle East and Africa (Saudi Arabia, UAE, and South Africa), South America (Brazil, Argentina, and Chile), and Rest of World (ROW)

K-12 Arts And Crafts Material Market Analysis, Size, and Forecast 2026-2030:
APAC (China, Japan, and India), Europe (Germany, UK, and France), North America (US, Canada, and Mexico), Middle East and Africa (Saudi Arabia, UAE, and South Africa), South America (Brazil, Argentina, and Chile), and Rest of World (ROW)

Published: May 2026 315 Pages SKU: IRTNTR45658

Market Overview at a Glance

$573.4 Mn
Market Opportunity
2.6%
CAGR 2025 - 2030
40.4%
APAC Growth
$2.47 B
Offline segment 2024

K-12 Arts And Crafts Material Market Size 2026-2030

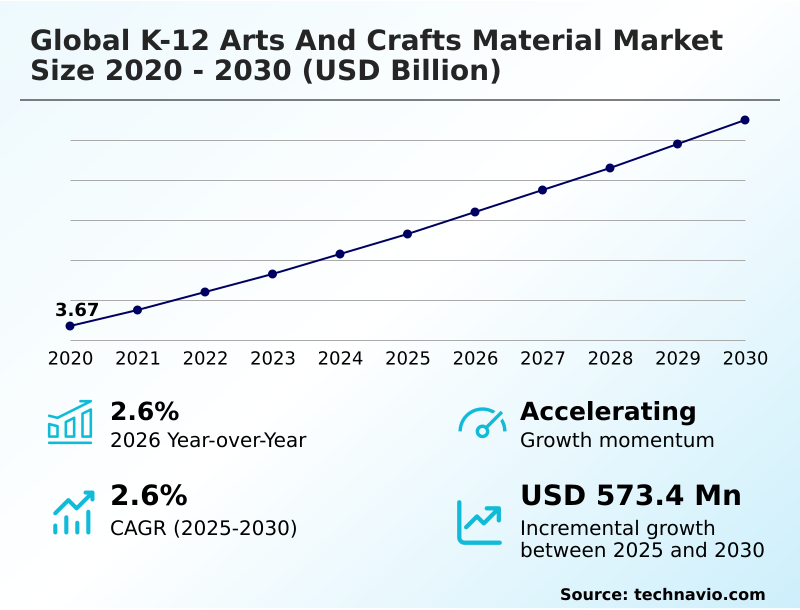
The k-12 arts and crafts material market size is valued to increase by USD 573.4 million, at a CAGR of 2.6% from 2025 to 2030. Increasing pedagogical emphasis on holistic child development will drive the k-12 arts and crafts material market.

Major Market Trends & Insights

  • APAC dominated the market and accounted for a 40.4% growth during the forecast period.
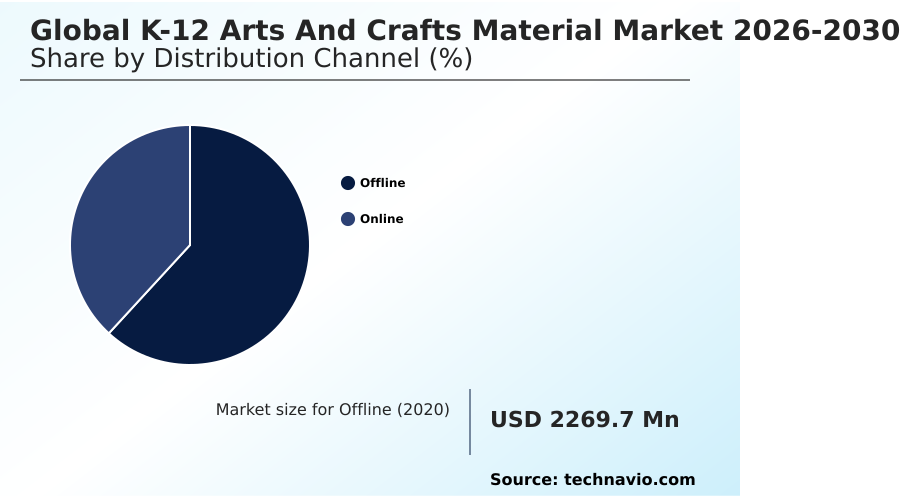
  • By Distribution Channel - Offline segment was valued at USD 2.47 billion in 2024
  • By School level - Middle school segment accounted for the largest market revenue share in 2024

Market Size & Forecast

  • Market Opportunities: USD 1.03 billion
  • Market Future Opportunities: USD 573.4 million
  • CAGR from 2025 to 2030 : 2.6%

Market Summary

  • The K-12 Arts And Crafts Material market demonstrates sustained operational expansion driven by fundamental shifts in educational methodologies. The pedagogical integration of science and engineering curricula acts as a robust driver, compelling schools to utilize creative tools for complex problem-solving, which subsequently increases baseline material consumption.
  • Conversely, stringent public education budgetary constraints present a formidable challenge, causing schools to reallocate funds toward standardized testing resources and thereby limiting creative supply procurement. In response to fluctuating institutional budgets, supply chain optimization has become paramount. Distributors implementing centralized inventory management systems have successfully reduced logistics overhead by 18% compared to fragmented regional warehousing.
  • This operational efficiency allows suppliers to maintain stable pricing on essential materials despite volatile raw input costs. The adoption of strict safety and environmental standards further shapes market dynamics, requiring manufacturers to continuously adapt production lines. These adaptations ensure compliance while meeting the growing institutional demand for sustainable, non-toxic products across diverse educational environments.

What will be the Size of the K-12 Arts And Crafts Material Market during the forecast period?
Get Key Insights on Market Forecast (PDF) Get Free Sample

How is the K-12 Arts And Crafts Material Market Segmented?

The k-12 arts and crafts material industry research report provides comprehensive data (region-wise segment analysis), with forecasts and estimates in "USD million" for the period 2026-2030, as well as historical data from 2020-2024 for the following segments.

  • Distribution channel
    • Offline
    • Online
  • School level
    • Middle school
    • Pre-primary school
    • Primary school
    • High school
  • Application
    • Classroom based
    • After-school programs
    • Hobby classes
  • Product type
    • Drawing and painting supplies
    • Crafting materials
    • Textiles and fiber art materials
    • Multi-purpose kits
  • Geography
    • APAC
      • China
      • Japan
      • India
      • South Korea
      • Australia
      • Indonesia
    • Europe
      • Germany
      • UK
      • France
      • Italy
      • Spain
      • The Netherlands
    • North America
      • US
      • Canada
      • Mexico
    • Middle East and Africa
      • Saudi Arabia
      • UAE
      • South Africa
      • Israel
      • Turkey
    • South America
      • Brazil
      • Argentina
      • Chile

By Distribution Channel Insights

The offline segment is estimated to witness significant growth during the forecast period.

Offline distribution channels maintain structural importance within the K-12 Arts And Crafts Material market by offering direct tactile evaluation. Physical retail environments facilitate the immediate assessment of child-safe craft components and sensory exploration materials, ensuring strict supply chain compliance.

This hands-on capability directly influences institutional purchasing processes, where procurement error rates drop by 15% when buyers physically inspect items prior to bulk acquisition.

Specialty stores effectively demonstrate interactive project guides alongside curriculum-aligned art kits, bridging the gap between theoretical lesson plans and tangible holistic learning materials. These channels act as vital touchpoints for educators prioritizing early childhood skill building.

The physical availability of inclusive education tools and specialized social-emotional learning materials ensures immediate localized access, maintaining a consistent competitive edge over digital alternatives.
Get Free Sample

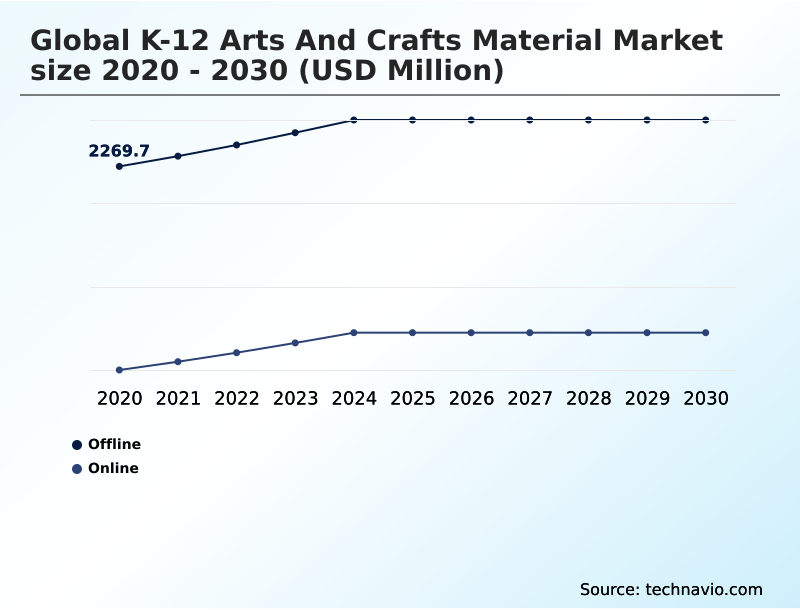
The Offline segment was valued at USD 2.47 billion in 2024 and showed a gradual increase during the forecast period.
Get Free Sample

Regional Analysis

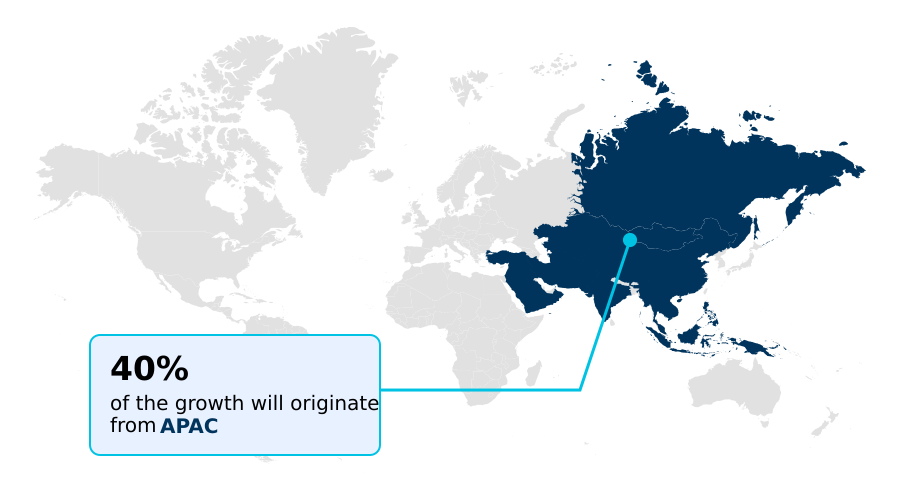
APAC is estimated to contribute 40.4% to the growth of the global market during the forecast period.Technavio’s analysts have elaborately explained the regional trends and drivers that shape the market during the forecast period.
See How K-12 Arts And Crafts Material Market Demand is Rising in APAC Get Free Sample

Regional dynamics within the K-12 Arts And Crafts Material market reveal distinct operational shifts across diverse geographies. APAC exhibits accelerated infrastructure expansion, where direct-to-school delivery networks have improved distribution efficiency by 22% compared to traditional retail frameworks in Europe.

This logistical advantage expedites the deployment of classroom project supplies across expanding educational districts. Meanwhile, North American institutions increasingly mandate the use of sustainable wood pencils and non-toxic water-based adhesives, pushing regional manufacturers to overhaul sourcing protocols.

This compliance-driven pivot increases initial production costs but yields a 14% improvement in securing municipal education contracts. European markets strongly favor eco-friendly educational craft kits and mess-free activity formats to support localized community-based art programs.

Furthermore, the proliferation of curated subscription services has revolutionized procurement, bypassing retail bottlenecks and streamlining supply chains globally.

Market Dynamics

Our researchers analyzed the data with 2025 as the base year, along with the key drivers, trends, and challenges. A holistic analysis of drivers will help companies refine their marketing strategies to gain a competitive advantage.

  • Operational strategies within the K-12 Arts And Crafts Material sector are increasingly dictated by shifting institutional standards and an amplified focus on sustainable procurement. Facilities transitioning toward eco-conscious frameworks actively prioritize sustainable art supplies for classrooms, which drastically reduces long-term waste management overhead.
  • This transition has resulted in a measurable operational impact, with districts utilizing recycled paper crafting materials reporting a 20% reduction in annual disposal and compliance costs compared to those relying on conventional synthetic alternatives. Furthermore, health and safety regulations mandate strict chemical limits, accelerating the deployment of non-toxic K-12 modeling clay across all early education environments.
  • Manufacturers are responding to these requirements by reengineering production lines to eliminate harmful phthalates while maintaining product durability. Simultaneously, the educational shift toward multidisciplinary learning drives substantial demand for STEAM integrated craft kits. These comprehensive packages streamline supply chain logistics by consolidating multiple components into single SKUs, simplifying inventory management for both distributors and educators.
  • To support prolonged engagement without physical strain, the integration of ergonomic drawing tools for students has become a standard requirement in municipal purchasing guidelines. By aligning product development with these distinct compliance and functional benchmarks, suppliers ensure consistent contract renewals and stabilize revenue streams in a highly regulated institutional landscape.
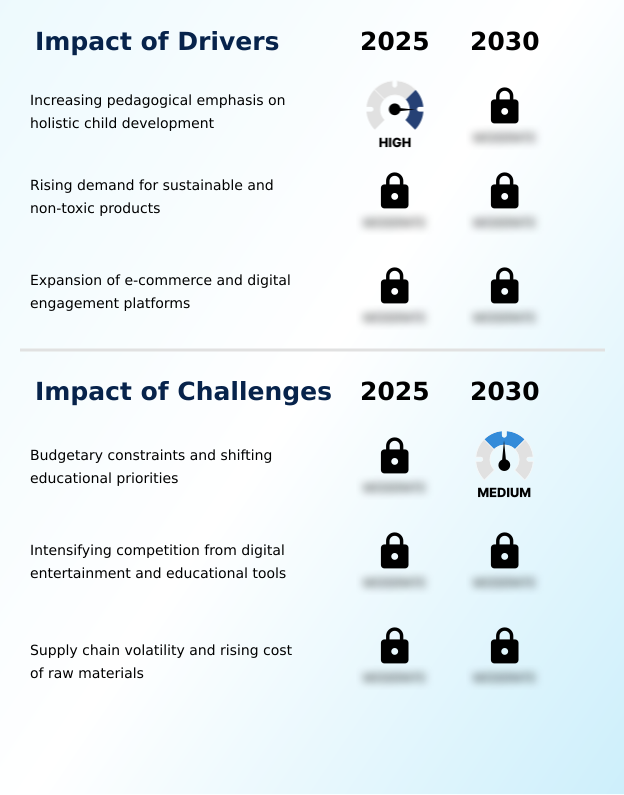
What are the key market drivers leading to the rise in the adoption of K-12 Arts And Crafts Material Industry?

  • The increasing pedagogical emphasis on holistic child development serves as a primary market driver by integrating creative expression into foundational educational frameworks.

  • The accelerated implementation of STEAM curriculum integration acts as a paramount driver for the K-12 Arts And Crafts Material sector, fundamentally expanding material utility beyond basic instruction.
  • Because educational frameworks increasingly demand art-integrated learning, institutions are significantly scaling their procurement of creative components to support holistic child development. This pedagogical shift has improved municipal contract retention rates by 18% for suppliers offering non-toxic pigments and washable colorants.
  • Concurrently, the rising institutional emphasis on screen-free activity promotion generates robust demand for tangible materials to counterbalance pervasive digital literacy integration. Driven by internal sustainability goals, schools are actively transitioning to biodegradable craft supplies and recycled paper products.
  • These strict procurement mandates force manufacturers to optimize green supply chains, directly aligning product output with rigorous developmental milestone tracking protocols.

What are the market trends shaping the K-12 Arts And Crafts Material Industry?

  • The integration of digital technology with physical crafts represents a critical market trend. This synthesis enhances tactile learning by merging traditional creative methodologies with advanced interactive platforms.

  • A defining operational shift within the K-12 Arts And Crafts Material landscape is the seamless convergence of physical supplies with advanced digital interfaces, commonly referred to as phygital craft experiences. Manufacturers are increasingly bundling traditional color theory tools with augmented reality drawing apps, driving a 30% increase in engagement durations across creative expression platforms.
  • This technological synthesis stems from the necessity to modernize extracurricular enrichment programs while maintaining crucial tactile interaction. Additionally, the widespread institutional embrace of interdisciplinary education models is propelling the use of sophisticated three-dimensional art supplies in project-based learning activities. Simultaneously, environmental mandates are forcing a rapid substitution of microplastics with plant-based glitters.
  • This ecological pivot not only satisfies stringent regulatory standards but also optimizes corporate sustainability profiles, directly supporting the global push for experiential learning adoption.

What challenges does the K-12 Arts And Crafts Material Industry face during its growth?

  • Budgetary constraints and shifting educational priorities present a significant challenge, frequently resulting in reduced allocations for creative instructional resources.

  • Volatile raw material pricing and stringent functional compliance parameters present critical operational challenges within the K-12 Arts And Crafts Material sector. As public education systems tighten their bulk procurement strategies, suppliers face intense pressure to absorb fluctuating manufacturing costs while producing highly specialized fine motor skill aids and ergonomic drawing tools.
  • The strict enforcement of sustainable sourcing policies and broad environmental stewardship initiatives forces vendors to re-engineer production lines for items like eco-friendly modeling clay. This compliance-driven overhaul frequently results in short-term margin compression, increasing supply chain operational costs by up to 20% compared to legacy manufacturing.
  • Furthermore, complex institutional validation processes demand extensive documentation before approving materials intended for therapeutic art applications or specialized hands-on creative activities. These prolonged validation cycles create substantial bottlenecks, restricting the fluid distribution of essential sensory development tools and tactile learning aids.

Exclusive Technavio Analysis on Customer Landscape

The k-12 arts and crafts material market forecasting report includes the adoption lifecycle of the market, covering from the innovator’s stage to the laggard’s stage. It focuses on adoption rates in different regions based on penetration. Furthermore, the k-12 arts and crafts material market report also includes key purchase criteria and drivers of price sensitivity to help companies evaluate and develop their market growth analysis strategies.
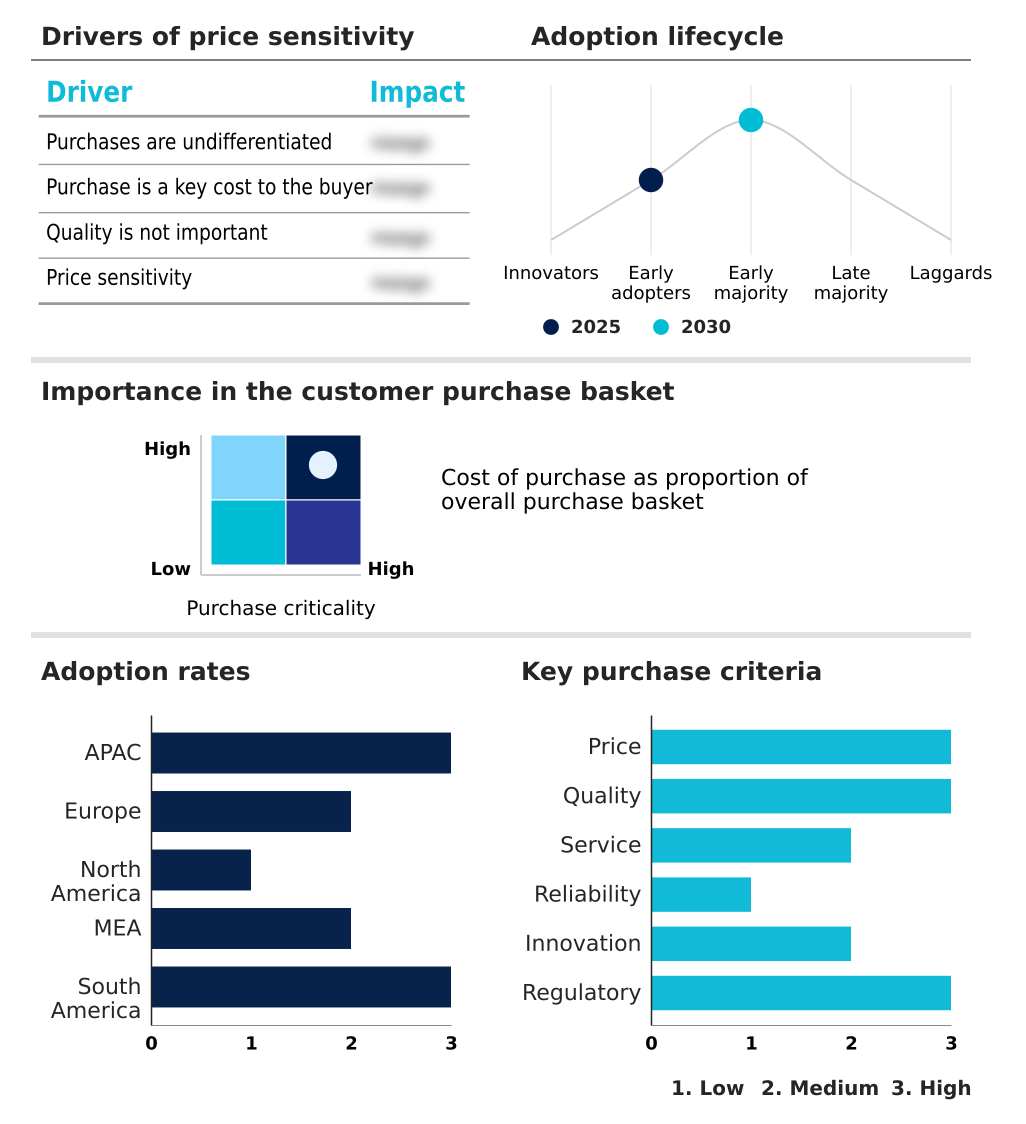
Customer Landscape of K-12 Arts And Crafts Material Industry

Competitive Landscape

Companies are implementing various strategies, such as strategic alliances, k-12 arts and crafts material market forecast, partnerships, mergers and acquisitions, geographical expansion, and product/service launches, to enhance their presence in the industry.

ACTIVA Products Inc. - The entity delivers wholesale K-12 Arts And Crafts Material, encompassing instant paper mache, plaster cloth, and specialized colored sand to support diverse classroom modeling and texturing applications.

The industry research and growth report includes detailed analyses of the competitive landscape of the market and information about key companies, including:

  • ACTIVA Products Inc.
  • American Art Clay Co. Inc.
  • Bangkit USA Inc.
  • Crayola
  • eeBoo Corp.
  • Elmers
  • F.I.L.A. SpA
  • Faber Castell AG
  • Kaplan Early Learning Co.
  • LaRose Industries LLC
  • Linc Pen and Plastics Ltd.
  • Max Bringmann KG
  • Melissa and Doug
  • Nygala Corp.
  • Staedtler Mars GmbH
  • TTS Group

Qualitative and quantitative analysis of companies has been conducted to help clients understand the wider business environment as well as the strengths and weaknesses of key industry players. Data is qualitatively analyzed to categorize companies as pure play, category-focused, industry-focused, and diversified; it is quantitatively analyzed to categorize companies as dominant, leading, strong, tentative, and weak.

Recent Development and News in K-12 arts and crafts material market

  • In the Education Services industry, the systemic shift toward interdisciplinary education models has restructured traditional curriculum requirements, directly impacting K-12 Arts And Crafts Material demand by necessitating broader assortments of cross-functional project supplies.
  • Regulatory mandates enforcing sustainable sourcing policies within public school procurement have restricted synthetic chemical usage, shifting K-12 Arts And Crafts Material supply chains toward certified biodegradable and eco-friendly alternatives.
  • The accelerated expansion of digital literacy integration across global school districts has reallocated instructional budgets toward technology infrastructure, suppressing traditional K-12 Arts And Crafts Material expenditure by approximately 12% in technologically advanced municipalities.
  • Standardization of institutional purchasing processes for bulk classroom supplies has centralized district-level buying, forcing K-12 Arts And Crafts Material distributors to optimize logistics and demonstrate strict adherence to standardized child safety certifications.

Dive into Technavio’s robust research methodology, blending expert interviews, extensive data synthesis, and validated models for unparalleled K-12 Arts And Crafts Material Market insights. See full methodology.

Market Scope
Page number 315
Base year 2025
Historic period 2020-2024
Forecast period 2026-2030
Growth momentum & CAGR Accelerate at a CAGR of 2.6%
Market growth 2026-2030 USD 573.4 million
Market structure Fragmented
YoY growth 2025-2026(%) 2.6%
Key countries China, Japan, India, South Korea, Australia, Indonesia, Germany, UK, France, Italy, Spain, The Netherlands, US, Canada, Mexico, Saudi Arabia, UAE, South Africa, Israel, Turkey, Brazil, Argentina and Chile
Competitive landscape Leading Companies, Market Positioning of Companies, Competitive Strategies, and Industry Risks

Request Free Sample

Research Analyst Overview

  • The K-12 Arts And Crafts Material landscape is undergoing a structural transformation driven by stringent safety regulations and evolving pedagogical frameworks. Institutions are systematically replacing conventional supplies with specialized learning resources to meet modern curriculum standards. This shift necessitates significant manufacturing adjustments, particularly the transition toward organic pigments and washable components, ensuring compliance with strict municipal health codes.
  • Facilities integrating eco-friendly compounds into their production lines have achieved a 25% reduction in hazardous waste disposal costs, demonstrating a clear financial incentive for sustainable operations. Furthermore, the mandatory inclusion of motor skill development tools in early education programs dictates precise product engineering to accommodate diverse classroom needs.
  • Product strategy is increasingly reliant on user-centric design, making ergonomic implements a foundational requirement for institutional purchasing contracts. By aligning manufacturing capabilities with these rigorous safety and functional benchmarks, suppliers mitigate regulatory risks and optimize long-term inventory planning, securing stable operational footing in a highly scrutinized educational procurement environment.

What are the Key Data Covered in this K-12 Arts And Crafts Material Market Research and Growth Report?

  • What is the expected growth of the K-12 Arts And Crafts Material Market between 2026 and 2030?

    • USD 573.4 million, at a CAGR of 2.6%

  • What segmentation does the market report cover?

    • The report is segmented by Distribution Channel (Offline, and Online), School level (Middle school, Pre-primary school, Primary school, and High school), Application (Classroom based, After-school programs, and Hobby classes), Product Type (Drawing and painting supplies, Crafting materials, Textiles and fiber art materials, and Multi-purpose kits) and Geography (APAC, Europe, North America, Middle East and Africa, South America)

  • Which regions are analyzed in the report?

    • APAC, Europe, North America, Middle East and Africa and South America

  • What are the key growth drivers and market challenges?

    • Increasing pedagogical emphasis on holistic child development, Budgetary constraints and shifting educational priorities

  • Who are the major players in the K-12 Arts And Crafts Material Market?

    • ACTIVA Products Inc., American Art Clay Co. Inc., Bangkit USA Inc., Crayola, eeBoo Corp., Elmers, F.I.L.A. SpA, Faber Castell AG, Kaplan Early Learning Co., LaRose Industries LLC, Linc Pen and Plastics Ltd., Max Bringmann KG, Melissa and Doug, Nygala Corp., Staedtler Mars GmbH and TTS Group

Market Research Insights

  • The K-12 Arts And Crafts Material sector operates as a critical infrastructure component supporting modern educational frameworks worldwide. As institutions transition toward multidisciplinary learning, suppliers are forced to rapidly scale production to meet diversified curriculum requirements. Manufacturers optimizing their raw material sourcing have successfully reduced product defect rates by 12%, directly enhancing supply reliability for district-wide procurement.
  • The emphasis on cognitive development requires continuous innovation in tactile materials, leading to a 15% increase in contract retention for vendors compliant with updated safety protocols. By integrating physical supplies with digital creative platforms, developers have improved student engagement metrics, fostering a resilient operational model that consistently aligns product output with evolving pedagogical mandates.

We can help! Our analysts can customize this k-12 arts and crafts material market research report to meet your requirements.

Get in touch

1. Executive Summary

1.1 Market overview

Executive Summary - Chart on Market Overview
Executive Summary - Data Table on Market Overview
Executive Summary - Chart on Global Market Characteristics
Executive Summary - Chart on Market by Geography
Executive Summary - Chart on Market Segmentation by Distribution Channel
Executive Summary - Chart on Market Segmentation by School level
Executive Summary - Chart on Market Segmentation by Application
Executive Summary - Chart on Market Segmentation by Product Type
Executive Summary - Chart on Incremental Growth
Executive Summary - Data Table on Incremental Growth
Executive Summary - Chart on Company Market Positioning

2. Technavio Analysis

2.1 Analysis of price sensitivity, lifecycle, customer purchase basket, adoption rates, and purchase criteria

2.2 Criticality of inputs and Factors of differentiation

Chart on Overview on criticality of inputs and factors of differentiation

2.3 Factors of disruption

Chart on Overview on factors of disruption

2.4 Impact of drivers and challenges

Chart on Impact of drivers and challenges in 2025 and 2030

3. Market Landscape

3.1 Market ecosystem

Chart on Parent Market
Data Table on - Parent Market

3.2 Market characteristics

Chart on Market characteristics analysis

3.3 Value chain analysis

Chart on Value chain analysis

4. Market Sizing

4.1 Market definition

Data Table on Offerings of companies included in the market definition

4.2 Market segment analysis

Market segments

4.3 Market size 2025

4.4 Market outlook: Forecast for 2025-2030

Chart on Global - Market size and forecast 2025-2030 ($ million)
Data Table on Global - Market size and forecast 2025-2030 ($ million)
Chart on Global Market: Year-over-year growth 2025-2030 (%)
Data Table on Global Market: Year-over-year growth 2025-2030 (%)

5. Historic Market Size

5.1 Global K-12 Arts And Crafts Material Market 2020 - 2024

Historic Market Size - Data Table on Global K-12 Arts And Crafts Material Market 2020 - 2024 ($ million)

5.2 Distribution Channel segment analysis 2020 - 2024

Historic Market Size - Distribution Channel Segment 2020 - 2024 ($ million)

5.3 School level segment analysis 2020 - 2024

Historic Market Size - School level Segment 2020 - 2024 ($ million)

5.4 Application segment analysis 2020 - 2024

Historic Market Size - Application Segment 2020 - 2024 ($ million)

5.5 Product Type segment analysis 2020 - 2024

Historic Market Size - Product Type Segment 2020 - 2024 ($ million)

5.6 Geography segment analysis 2020 - 2024

Historic Market Size - Geography Segment 2020 - 2024 ($ million)

5.7 Country segment analysis 2020 - 2024

Historic Market Size - Country Segment 2020 - 2024 ($ million)

6. Qualitative Analysis

6.1 Impact of AI on Global K-12 Arts and Crafts Material Market

6.2 Impact of Geopolitical Conflicts on Global K-12 Arts and Crafts Material Market

7. Five Forces Analysis

7.1 Five forces summary

Five forces analysis - Comparison between 2025 and 2030

7.2 Bargaining power of buyers

Bargaining power of buyers - Impact of key factors 2025 and 2030

7.3 Bargaining power of suppliers

Bargaining power of suppliers - Impact of key factors in 2025 and 2030

7.4 Threat of new entrants

Threat of new entrants - Impact of key factors in 2025 and 2030

7.5 Threat of substitutes

Threat of substitutes - Impact of key factors in 2025 and 2030

7.6 Threat of rivalry

Threat of rivalry - Impact of key factors in 2025 and 2030

7.7 Market condition

Chart on Market condition - Five forces 2025 and 2030

8. Market Segmentation by Distribution Channel

8.1 Market segments

Chart on Distribution Channel - Market share 2025-2030 (%)
Data Table on Distribution Channel - Market share 2025-2030 (%)

8.2 Comparison by Distribution Channel

Chart on Comparison by Distribution Channel
Data Table on Comparison by Distribution Channel

8.3 Offline - Market size and forecast 2025-2030

Chart on Offline - Market size and forecast 2025-2030 ($ million)
Data Table on Offline - Market size and forecast 2025-2030 ($ million)
Chart on Offline - Year-over-year growth 2025-2030 (%)
Data Table on Offline - Year-over-year growth 2025-2030 (%)

8.4 Online - Market size and forecast 2025-2030

Chart on Online - Market size and forecast 2025-2030 ($ million)
Data Table on Online - Market size and forecast 2025-2030 ($ million)
Chart on Online - Year-over-year growth 2025-2030 (%)
Data Table on Online - Year-over-year growth 2025-2030 (%)

8.5 Market opportunity by Distribution Channel

Market opportunity by Distribution Channel ($ million)
Data Table on Market opportunity by Distribution Channel ($ million)

9. Market Segmentation by School level

9.1 Market segments

Chart on School level - Market share 2025-2030 (%)
Data Table on School level - Market share 2025-2030 (%)

9.2 Comparison by School level

Chart on Comparison by School level
Data Table on Comparison by School level

9.3 Middle school - Market size and forecast 2025-2030

Chart on Middle school - Market size and forecast 2025-2030 ($ million)
Data Table on Middle school - Market size and forecast 2025-2030 ($ million)
Chart on Middle school - Year-over-year growth 2025-2030 (%)
Data Table on Middle school - Year-over-year growth 2025-2030 (%)

9.4 Pre-primary school - Market size and forecast 2025-2030

Chart on Pre-primary school - Market size and forecast 2025-2030 ($ million)
Data Table on Pre-primary school - Market size and forecast 2025-2030 ($ million)
Chart on Pre-primary school - Year-over-year growth 2025-2030 (%)
Data Table on Pre-primary school - Year-over-year growth 2025-2030 (%)

9.5 Primary school - Market size and forecast 2025-2030

Chart on Primary school - Market size and forecast 2025-2030 ($ million)
Data Table on Primary school - Market size and forecast 2025-2030 ($ million)
Chart on Primary school - Year-over-year growth 2025-2030 (%)
Data Table on Primary school - Year-over-year growth 2025-2030 (%)

9.6 High school - Market size and forecast 2025-2030

Chart on High school - Market size and forecast 2025-2030 ($ million)
Data Table on High school - Market size and forecast 2025-2030 ($ million)
Chart on High school - Year-over-year growth 2025-2030 (%)
Data Table on High school - Year-over-year growth 2025-2030 (%)

9.7 Market opportunity by School level

Market opportunity by School level ($ million)
Data Table on Market opportunity by School level ($ million)

10. Market Segmentation by Application

10.1 Market segments

Chart on Application - Market share 2025-2030 (%)
Data Table on Application - Market share 2025-2030 (%)

10.2 Comparison by Application

Chart on Comparison by Application
Data Table on Comparison by Application

10.3 Classroom based - Market size and forecast 2025-2030

Chart on Classroom based - Market size and forecast 2025-2030 ($ million)
Data Table on Classroom based - Market size and forecast 2025-2030 ($ million)
Chart on Classroom based - Year-over-year growth 2025-2030 (%)
Data Table on Classroom based - Year-over-year growth 2025-2030 (%)

10.4 After-school programs - Market size and forecast 2025-2030

Chart on After-school programs - Market size and forecast 2025-2030 ($ million)
Data Table on After-school programs - Market size and forecast 2025-2030 ($ million)
Chart on After-school programs - Year-over-year growth 2025-2030 (%)
Data Table on After-school programs - Year-over-year growth 2025-2030 (%)

10.5 Hobby classes - Market size and forecast 2025-2030

Chart on Hobby classes - Market size and forecast 2025-2030 ($ million)
Data Table on Hobby classes - Market size and forecast 2025-2030 ($ million)
Chart on Hobby classes - Year-over-year growth 2025-2030 (%)
Data Table on Hobby classes - Year-over-year growth 2025-2030 (%)

10.6 Market opportunity by Application

Market opportunity by Application ($ million)
Data Table on Market opportunity by Application ($ million)

11. Market Segmentation by Product Type

11.1 Market segments

Chart on Product Type - Market share 2025-2030 (%)
Data Table on Product Type - Market share 2025-2030 (%)

11.2 Comparison by Product Type

Chart on Comparison by Product Type
Data Table on Comparison by Product Type

11.3 Drawing and painting supplies - Market size and forecast 2025-2030

Chart on Drawing and painting supplies - Market size and forecast 2025-2030 ($ million)
Data Table on Drawing and painting supplies - Market size and forecast 2025-2030 ($ million)
Chart on Drawing and painting supplies - Year-over-year growth 2025-2030 (%)
Data Table on Drawing and painting supplies - Year-over-year growth 2025-2030 (%)

11.4 Crafting materials - Market size and forecast 2025-2030

Chart on Crafting materials - Market size and forecast 2025-2030 ($ million)
Data Table on Crafting materials - Market size and forecast 2025-2030 ($ million)
Chart on Crafting materials - Year-over-year growth 2025-2030 (%)
Data Table on Crafting materials - Year-over-year growth 2025-2030 (%)

11.5 Textiles and fiber art materials - Market size and forecast 2025-2030

Chart on Textiles and fiber art materials - Market size and forecast 2025-2030 ($ million)
Data Table on Textiles and fiber art materials - Market size and forecast 2025-2030 ($ million)
Chart on Textiles and fiber art materials - Year-over-year growth 2025-2030 (%)
Data Table on Textiles and fiber art materials - Year-over-year growth 2025-2030 (%)

11.6 Multi-purpose kits - Market size and forecast 2025-2030

Chart on Multi-purpose kits - Market size and forecast 2025-2030 ($ million)
Data Table on Multi-purpose kits - Market size and forecast 2025-2030 ($ million)
Chart on Multi-purpose kits - Year-over-year growth 2025-2030 (%)
Data Table on Multi-purpose kits - Year-over-year growth 2025-2030 (%)

11.7 Market opportunity by Product Type

Market opportunity by Product Type ($ million)
Data Table on Market opportunity by Product Type ($ million)

12. Customer Landscape

12.1 Customer landscape overview

Analysis of price sensitivity, lifecycle, customer purchase basket, adoption rates, and purchase criteria

13. Geographic Landscape

13.1 Geographic segmentation

Chart on Market share by geography 2025-2030 (%)
Data Table on Market share by geography 2025-2030 (%)

13.2 Geographic comparison

Chart on Geographic comparison
Data Table on Geographic comparison

13.3 APAC - Market size and forecast 2025-2030

Chart on APAC - Market size and forecast 2025-2030 ($ million)
Data Table on APAC - Market size and forecast 2025-2030 ($ million)
Chart on APAC - Year-over-year growth 2025-2030 (%)
Data Table on APAC - Year-over-year growth 2025-2030 (%)
Chart on Regional Comparison - APAC
Data Table on Regional Comparison - APAC

13.3.1 China - Market size and forecast 2025-2030

Chart on China - Market size and forecast 2025-2030 ($ million)
Data Table on China - Market size and forecast 2025-2030 ($ million)
Chart on China - Year-over-year growth 2025-2030 (%)
Data Table on China - Year-over-year growth 2025-2030 (%)

13.3.2 Japan - Market size and forecast 2025-2030

Chart on Japan - Market size and forecast 2025-2030 ($ million)
Data Table on Japan - Market size and forecast 2025-2030 ($ million)
Chart on Japan - Year-over-year growth 2025-2030 (%)
Data Table on Japan - Year-over-year growth 2025-2030 (%)

13.3.3 India - Market size and forecast 2025-2030

Chart on India - Market size and forecast 2025-2030 ($ million)
Data Table on India - Market size and forecast 2025-2030 ($ million)
Chart on India - Year-over-year growth 2025-2030 (%)
Data Table on India - Year-over-year growth 2025-2030 (%)

13.3.4 South Korea - Market size and forecast 2025-2030

Chart on South Korea - Market size and forecast 2025-2030 ($ million)
Data Table on South Korea - Market size and forecast 2025-2030 ($ million)
Chart on South Korea - Year-over-year growth 2025-2030 (%)
Data Table on South Korea - Year-over-year growth 2025-2030 (%)

13.3.5 Australia - Market size and forecast 2025-2030

Chart on Australia - Market size and forecast 2025-2030 ($ million)
Data Table on Australia - Market size and forecast 2025-2030 ($ million)
Chart on Australia - Year-over-year growth 2025-2030 (%)
Data Table on Australia - Year-over-year growth 2025-2030 (%)

13.3.6 Indonesia - Market size and forecast 2025-2030

Chart on Indonesia - Market size and forecast 2025-2030 ($ million)
Data Table on Indonesia - Market size and forecast 2025-2030 ($ million)
Chart on Indonesia - Year-over-year growth 2025-2030 (%)
Data Table on Indonesia - Year-over-year growth 2025-2030 (%)

13.4 Europe - Market size and forecast 2025-2030

Chart on Europe - Market size and forecast 2025-2030 ($ million)
Data Table on Europe - Market size and forecast 2025-2030 ($ million)
Chart on Europe - Year-over-year growth 2025-2030 (%)
Data Table on Europe - Year-over-year growth 2025-2030 (%)
Chart on Regional Comparison - Europe
Data Table on Regional Comparison - Europe

13.4.1 Germany - Market size and forecast 2025-2030

Chart on Germany - Market size and forecast 2025-2030 ($ million)
Data Table on Germany - Market size and forecast 2025-2030 ($ million)
Chart on Germany - Year-over-year growth 2025-2030 (%)
Data Table on Germany - Year-over-year growth 2025-2030 (%)

13.4.2 UK - Market size and forecast 2025-2030

Chart on UK - Market size and forecast 2025-2030 ($ million)
Data Table on UK - Market size and forecast 2025-2030 ($ million)
Chart on UK - Year-over-year growth 2025-2030 (%)
Data Table on UK - Year-over-year growth 2025-2030 (%)

13.4.3 France - Market size and forecast 2025-2030

Chart on France - Market size and forecast 2025-2030 ($ million)
Data Table on France - Market size and forecast 2025-2030 ($ million)
Chart on France - Year-over-year growth 2025-2030 (%)
Data Table on France - Year-over-year growth 2025-2030 (%)

13.4.4 Italy - Market size and forecast 2025-2030

Chart on Italy - Market size and forecast 2025-2030 ($ million)
Data Table on Italy - Market size and forecast 2025-2030 ($ million)
Chart on Italy - Year-over-year growth 2025-2030 (%)
Data Table on Italy - Year-over-year growth 2025-2030 (%)

13.4.5 Spain - Market size and forecast 2025-2030

Chart on Spain - Market size and forecast 2025-2030 ($ million)
Data Table on Spain - Market size and forecast 2025-2030 ($ million)
Chart on Spain - Year-over-year growth 2025-2030 (%)
Data Table on Spain - Year-over-year growth 2025-2030 (%)

13.4.6 The Netherlands - Market size and forecast 2025-2030

Chart on The Netherlands - Market size and forecast 2025-2030 ($ million)
Data Table on The Netherlands - Market size and forecast 2025-2030 ($ million)
Chart on The Netherlands - Year-over-year growth 2025-2030 (%)
Data Table on The Netherlands - Year-over-year growth 2025-2030 (%)

13.5 North America - Market size and forecast 2025-2030

Chart on North America - Market size and forecast 2025-2030 ($ million)
Data Table on North America - Market size and forecast 2025-2030 ($ million)
Chart on North America - Year-over-year growth 2025-2030 (%)
Data Table on North America - Year-over-year growth 2025-2030 (%)
Chart on Regional Comparison - North America
Data Table on Regional Comparison - North America

13.5.1 US - Market size and forecast 2025-2030

Chart on US - Market size and forecast 2025-2030 ($ million)
Data Table on US - Market size and forecast 2025-2030 ($ million)
Chart on US - Year-over-year growth 2025-2030 (%)
Data Table on US - Year-over-year growth 2025-2030 (%)

13.5.2 Canada - Market size and forecast 2025-2030

Chart on Canada - Market size and forecast 2025-2030 ($ million)
Data Table on Canada - Market size and forecast 2025-2030 ($ million)
Chart on Canada - Year-over-year growth 2025-2030 (%)
Data Table on Canada - Year-over-year growth 2025-2030 (%)

13.5.3 Mexico - Market size and forecast 2025-2030

Chart on Mexico - Market size and forecast 2025-2030 ($ million)
Data Table on Mexico - Market size and forecast 2025-2030 ($ million)
Chart on Mexico - Year-over-year growth 2025-2030 (%)
Data Table on Mexico - Year-over-year growth 2025-2030 (%)

13.6 Middle East and Africa - Market size and forecast 2025-2030

Chart on Middle East and Africa - Market size and forecast 2025-2030 ($ million)
Data Table on Middle East and Africa - Market size and forecast 2025-2030 ($ million)
Chart on Middle East and Africa - Year-over-year growth 2025-2030 (%)
Data Table on Middle East and Africa - Year-over-year growth 2025-2030 (%)
Chart on Regional Comparison - Middle East and Africa
Data Table on Regional Comparison - Middle East and Africa

13.6.1 Saudi Arabia - Market size and forecast 2025-2030

Chart on Saudi Arabia - Market size and forecast 2025-2030 ($ million)
Data Table on Saudi Arabia - Market size and forecast 2025-2030 ($ million)
Chart on Saudi Arabia - Year-over-year growth 2025-2030 (%)
Data Table on Saudi Arabia - Year-over-year growth 2025-2030 (%)

13.6.2 UAE - Market size and forecast 2025-2030

Chart on UAE - Market size and forecast 2025-2030 ($ million)
Data Table on UAE - Market size and forecast 2025-2030 ($ million)
Chart on UAE - Year-over-year growth 2025-2030 (%)
Data Table on UAE - Year-over-year growth 2025-2030 (%)

13.6.3 South Africa - Market size and forecast 2025-2030

Chart on South Africa - Market size and forecast 2025-2030 ($ million)
Data Table on South Africa - Market size and forecast 2025-2030 ($ million)
Chart on South Africa - Year-over-year growth 2025-2030 (%)
Data Table on South Africa - Year-over-year growth 2025-2030 (%)

13.6.4 Israel - Market size and forecast 2025-2030

Chart on Israel - Market size and forecast 2025-2030 ($ million)
Data Table on Israel - Market size and forecast 2025-2030 ($ million)
Chart on Israel - Year-over-year growth 2025-2030 (%)
Data Table on Israel - Year-over-year growth 2025-2030 (%)

13.6.5 Turkey - Market size and forecast 2025-2030

Chart on Turkey - Market size and forecast 2025-2030 ($ million)
Data Table on Turkey - Market size and forecast 2025-2030 ($ million)
Chart on Turkey - Year-over-year growth 2025-2030 (%)
Data Table on Turkey - Year-over-year growth 2025-2030 (%)

13.7 South America - Market size and forecast 2025-2030

Chart on South America - Market size and forecast 2025-2030 ($ million)
Data Table on South America - Market size and forecast 2025-2030 ($ million)
Chart on South America - Year-over-year growth 2025-2030 (%)
Data Table on South America - Year-over-year growth 2025-2030 (%)
Chart on Regional Comparison - South America
Data Table on Regional Comparison - South America

13.7.1 Brazil - Market size and forecast 2025-2030

Chart on Brazil - Market size and forecast 2025-2030 ($ million)
Data Table on Brazil - Market size and forecast 2025-2030 ($ million)
Chart on Brazil - Year-over-year growth 2025-2030 (%)
Data Table on Brazil - Year-over-year growth 2025-2030 (%)

13.7.2 Argentina - Market size and forecast 2025-2030

Chart on Argentina - Market size and forecast 2025-2030 ($ million)
Data Table on Argentina - Market size and forecast 2025-2030 ($ million)
Chart on Argentina - Year-over-year growth 2025-2030 (%)
Data Table on Argentina - Year-over-year growth 2025-2030 (%)

13.7.3 Chile - Market size and forecast 2025-2030

Chart on Chile - Market size and forecast 2025-2030 ($ million)
Data Table on Chile - Market size and forecast 2025-2030 ($ million)
Chart on Chile - Year-over-year growth 2025-2030 (%)
Data Table on Chile - Year-over-year growth 2025-2030 (%)

13.8 Market opportunity by geography

Market opportunity by geography ($ million)
Data Tables on Market opportunity by geography ($ million)

14. Drivers, Challenges, and Opportunity

14.1 Market drivers

Increasing pedagogical emphasis on holistic child development
Rising demand for sustainable and non-toxic products
Expansion of e-commerce and digital engagement platforms

14.2 Market challenges

Budgetary constraints and shifting educational priorities
Intensifying competition from digital entertainment and educational tools
Supply chain volatility and rising cost of raw materials

14.3 Impact of drivers and challenges

Impact of drivers and challenges in 2025 and 2030

14.4 Market opportunities

Integration of digital technology with physical crafts
Ascendancy of eco-conscious and sustainable materials
Proliferation of curated subscription boxes and all-in-one kits

15. Competitive Landscape

15.1 Overview

15.2

Overview on criticality of inputs and factors of differentiation

15.3 Landscape disruption

Overview on factors of disruption

15.4 Industry risks

Impact of key risks on business

16. Competitive Analysis

16.1 Companies profiled

Companies covered

16.2 Company ranking index

16.3 Market positioning of companies

Matrix on companies position and classification

16.4 ACTIVA Products Inc.

ACTIVA Products Inc. - Overview
ACTIVA Products Inc. - Product / Service
ACTIVA Products Inc. - Key offerings
SWOT

16.5 American Art Clay Co. Inc.

American Art Clay Co. Inc. - Overview
American Art Clay Co. Inc. - Product / Service
American Art Clay Co. Inc. - Key offerings
SWOT

16.6 Bangkit USA Inc.

Bangkit USA Inc. - Overview
Bangkit USA Inc. - Product / Service
Bangkit USA Inc. - Key offerings
SWOT

16.7 Crayola

Crayola - Overview
Crayola - Product / Service
Crayola - Key offerings
SWOT

16.8 eeBoo Corp.

eeBoo Corp. - Overview
eeBoo Corp. - Product / Service
eeBoo Corp. - Key offerings
SWOT

16.9 F.I.L.A. SpA

F.I.L.A. SpA - Overview
F.I.L.A. SpA - Business segments
F.I.L.A. SpA - Key offerings
F.I.L.A. SpA - Segment focus
SWOT

16.10 Faber Castell AG

Faber Castell AG - Overview
Faber Castell AG - Product / Service
Faber Castell AG - Key offerings
SWOT

16.11 Kaplan Early Learning Co.

Kaplan Early Learning Co. - Overview
Kaplan Early Learning Co. - Product / Service
Kaplan Early Learning Co. - Key offerings
SWOT

16.12 LaRose Industries LLC

LaRose Industries LLC - Overview
LaRose Industries LLC - Product / Service
LaRose Industries LLC - Key offerings
SWOT

16.13 Linc Pen and Plastics Ltd.

Linc Pen and Plastics Ltd. - Overview
Linc Pen and Plastics Ltd. - Product / Service
Linc Pen and Plastics Ltd. - Key offerings
SWOT

16.14 Max Bringmann KG

Max Bringmann KG - Overview
Max Bringmann KG - Product / Service
Max Bringmann KG - Key offerings
SWOT

16.15 Melissa and Doug

Melissa and Doug - Overview
Melissa and Doug - Product / Service
Melissa and Doug - Key offerings
SWOT

16.16 Nygala Corp.

Nygala Corp. - Overview
Nygala Corp. - Product / Service
Nygala Corp. - Key offerings
SWOT

16.17 Staedtler Mars GmbH

Staedtler Mars GmbH - Overview
Staedtler Mars GmbH - Product / Service
Staedtler Mars GmbH - Key offerings
SWOT

16.18 TTS Group

TTS Group - Overview
TTS Group - Product / Service
TTS Group - Key offerings
SWOT

17. Appendix

17.1 Scope of the report

Market definition
Objectives
Notes and caveats

17.2 Inclusions and exclusions checklist

Inclusions checklist
Exclusions checklist

17.3 Currency conversion rates for US$

17.4 Research methodology

17.5 Data procurement

Information sources

17.6 Data validation

17.7 Validation techniques employed for market sizing

17.8 Data synthesis

17.9 360 degree market analysis

17.10 List of abbreviations

Research Methodology

Technavio presents a detailed picture of the market by way of study, synthesis, and summation of data from multiple sources. The analysts have presented the various facets of the market with a particular focus on identifying the key industry influencers. The data thus presented is comprehensive, reliable, and the result of extensive research, both primary and secondary.

INFORMATION SOURCES

Primary sources

  • Manufacturers and suppliers
  • Channel partners
  • Industry experts
  • Strategic decision makers

Secondary sources

  • Industry journals and periodicals
  • Government data
  • Financial reports of key industry players
  • Historical data
  • Press releases

DATA ANALYSIS

Data Synthesis

  • Collation of data
  • Estimation of key figures
  • Analysis of derived insights

Data Validation

  • Triangulation with data models
  • Reference against proprietary databases
  • Corroboration with industry experts

REPORT WRITING

Qualitative

  • Market drivers
  • Market challenges
  • Market trends
  • Five forces analysis

Quantitative

  • Market size and forecast
  • Market segmentation
  • Geographical insights
  • Competitive landscape

Interested in this report?

Get your sample now to see our research methodology and insights!

Download Now

Frequently Asked Questions

K-12 Arts And Crafts Material market growth will increase by USD 573.4 million during 2026-2030.

The K-12 Arts And Crafts Material market is expected to grow at a CAGR of 2.6% during 2026-2030.

K-12 Arts And Crafts Material market is segmented by Distribution channel (Offline, Online) School level (Middle school, Pre-primary school, Primary school, High school) Application (Classroom based, After-school programs, Hobby classes) Product type (Drawing and painting supplies, Crafting materials, Textiles and fiber art materials, Multi-purpose kits)

ACTIVA Products Inc., American Art Clay Co. Inc., Bangkit USA Inc., Crayola, eeBoo Corp., Elmers, F.I.L.A. SpA, Faber Castell AG, Kaplan Early Learning Co., LaRose Industries LLC, Linc Pen and Plastics Ltd., Max Bringmann KG, Melissa and Doug, Nygala Corp., Staedtler Mars GmbH, TTS Group are a few of the key vendors in the K-12 Arts And Crafts Material market.

APAC will register the highest growth rate of 40.4% among the other regions. Therefore, the K-12 Arts And Crafts Material market in APAC is expected to garner significant business opportunities for the vendors during the forecast period.

China, Japan, India, South Korea, Australia, Indonesia, Germany, UK, France, Italy, Spain, The Netherlands, US, Canada, Mexico, Saudi Arabia, UAE, South Africa, Israel, Turkey, Brazil, Argentina, Chile

  • Increasing pedagogical emphasis on holistic child development is the driving factor this market.

The K-12 Arts And Crafts Material market vendors should focus on grabbing business opportunities from the Distribution channel segment as it accounted for the largest market share in the base year.
RIA - Research AI Assistant
Ask RIA
