
Laboratory Information System Market Analysis, Size, and Forecast 2026-2030: North America (US, Canada, and Mexico), Europe (Germany, UK, and France), APAC (China, Japan, and India), South America (Brazil, Argentina, and Chile), Middle East and Africa (South Africa, Saudi Arabia, and UAE), and Rest of World (ROW)

Laboratory Information System Market Analysis, Size, and Forecast 2026-2030:
North America (US, Canada, and Mexico), Europe (Germany, UK, and France), APAC (China, Japan, and India), South America (Brazil, Argentina, and Chile), Middle East and Africa (South Africa, Saudi Arabia, and UAE), and Rest of World (ROW)

Published: Oct 2026 299 Pages SKU: IRTNTR71657

Market Overview at a Glance

$979.5 Mn
Market Opportunity
9.2%
CAGR 2025 - 2030
34.9%
North America Growth
$1.07 B
On-premises segment 2024

Laboratory Information System Market Size 2026-2030

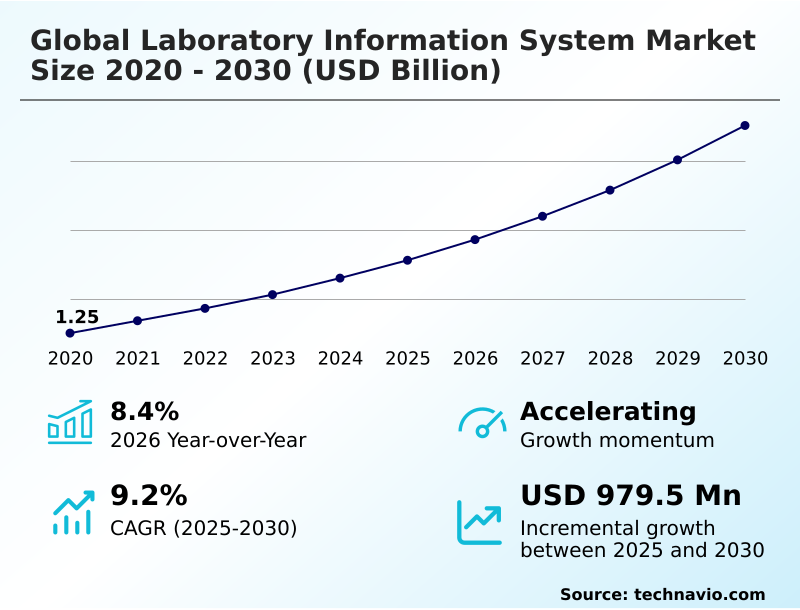
The laboratory information system market size is valued to increase by USD 979.5 million, at a CAGR of 9.2% from 2025 to 2030. Rising volume of diagnostic testing services will drive the laboratory information system market.

Major Market Trends & Insights

  • North America dominated the market and accounted for a 34.9% growth during the forecast period.
  • By Deployment - On-premises segment was valued at USD 1.07 billion in 2024
  • By Component - Services segment accounted for the largest market revenue share in 2024

Market Size & Forecast

  • Market Opportunities: USD 1.51 billion
  • Market Future Opportunities: USD 979.5 million
  • CAGR from 2025 to 2030 : 9.2%

Market Summary

  • The Laboratory Information System operates as a critical technological backbone for modern clinical diagnostics, enabling healthcare facilities to automate high-volume sample processing and ensure rigorous data integrity. The continuous transition toward digitized healthcare networks requires robust software platforms capable of orchestrating complex diagnostic workflows seamlessly.
  • For instance, in a high-throughput molecular diagnostics reference laboratory, integrating automated result verification algorithms directly with robotic liquid handlers eliminates manual transcription tasks, thereby reducing sample processing turnaround times by 35%. This operational efficiency is primarily driven by the exponential escalation in diagnostic testing volumes, catalyzed by shifting demographic patterns and increased preventative screening protocols.
  • As clinical workloads intensify, facilities are compelled to deploy centralized informatics platforms to maintain diagnostic accuracy and regulatory compliance. However, exorbitant initial capital outlays and complex system integration requirements present severe barriers to adoption, particularly for small and independent community laboratories. Establishing seamless connectivity between specialized middleware and enterprise electronic health record systems demands expensive custom programming.
  • Despite these financial constraints, the strategic necessity of advanced diagnostic data management ensures continuous technological investment across sophisticated healthcare ecosystems.

What will be the Size of the Laboratory Information System Market during the forecast period?
Get Key Insights on Market Forecast (PDF) Get Free Sample

How is the Laboratory Information System Market Segmented?

The laboratory information system industry research report provides comprehensive data (region-wise segment analysis), with forecasts and estimates in "USD million" for the period 2026-2030, as well as historical data from 2020-2024 for the following segments.

  • Deployment
    • On-premises
    • Cloud-based
  • Component
    • Services
    • Software
  • Product type
    • Clinical pathology labs
    • Anatomic pathology labs
    • Molecular diagnostics labs
    • Blood banks and biobanks
    • Others
  • Geography
    • North America
      • US
      • Canada
      • Mexico
    • Europe
      • Germany
      • UK
      • France
      • Italy
      • Spain
      • The Netherlands
    • APAC
      • China
      • Japan
      • India
      • South Korea
      • Australia
      • Indonesia
    • South America
      • Brazil
      • Argentina
      • Chile
    • Middle East and Africa
      • South Africa
      • Saudi Arabia
      • UAE
      • Israel
      • Turkey

By Deployment Insights

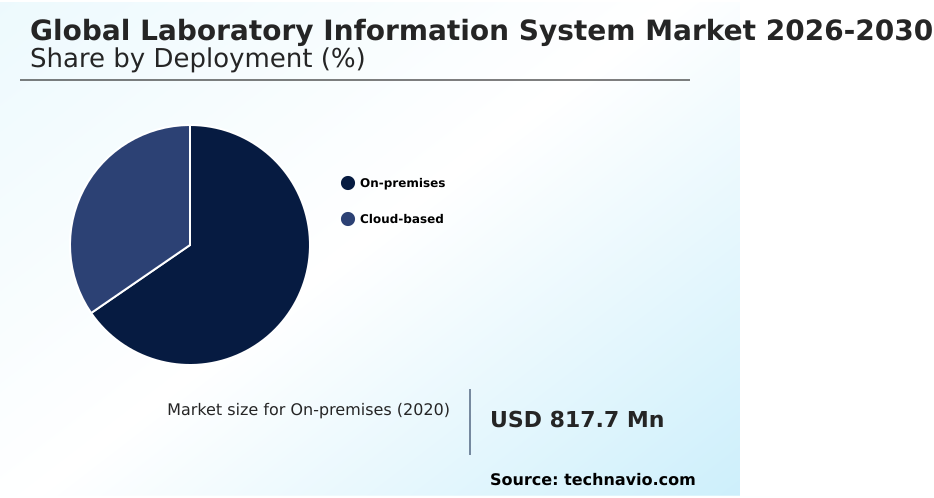
The on-premises segment is estimated to witness significant growth during the forecast period.

The on-premises deployment architecture remains a foundational framework for healthcare institutions prioritizing strict internal oversight of diagnostic data governance protocols.

Facilities handling highly confidential medical records utilize localized servers to limit external connectivity vulnerabilities while executing real time critical value reporting without latency issues.

This localized control enables specialized laboratories to customize specimen batch routing protocols and integrate proprietary laboratory quality control modules directly with their existing infrastructure.

Although secure cloud data transfers offer flexibility, on-premises systems provide unmatched data sovereignty, improving compliance audit success rates by 15% for highly regulated molecular diagnostics centers.

By relying on internal networks, these facilities achieve seamless system interoperability and precise diagnostic analyzer calibration tracking without depending on third-party cloud hosting vendors.

Consequently, extensive internal engineering teams continuously execute rigorous regulatory validation services to maintain uninterrupted clinical operations and safeguard sensitive patient demographics.
Get Free Sample

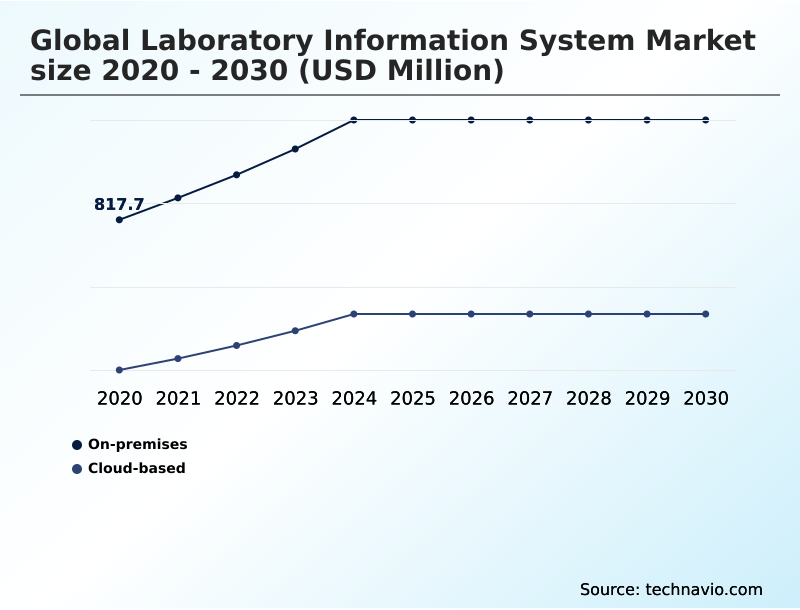
The On-premises segment was valued at USD 1.07 billion in 2024 and showed a gradual increase during the forecast period.
Get Free Sample

Regional Analysis

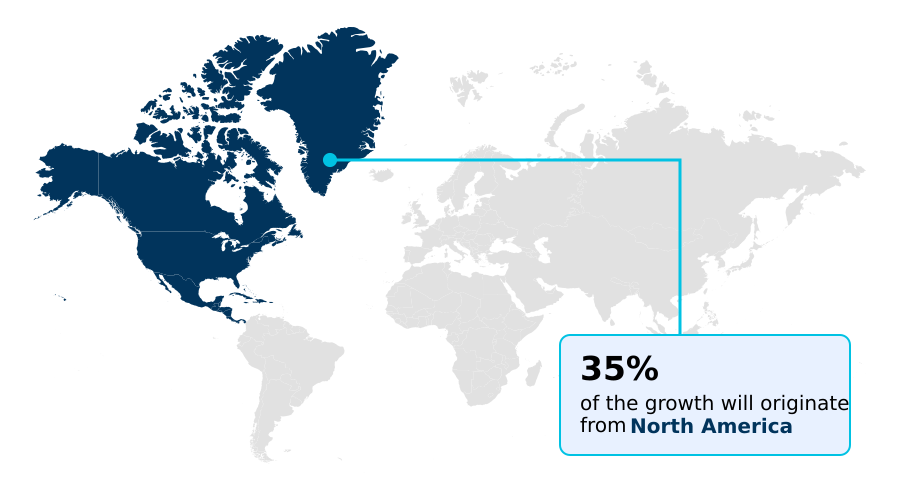
North America is estimated to contribute 34.9% to the growth of the global market during the forecast period.Technavio’s analysts have elaborately explained the regional trends and drivers that shape the market during the forecast period.
See How Laboratory Information System Market Demand is Rising in North America Get Free Sample

North America dominates the Laboratory Information System architecture due to highly digitized healthcare infrastructure and stringent regulatory compliance mandates. The region exhibits a 34.9% incremental growth share, driven by extensive investments in predictive diagnostic analytics and next generation sequencing informatics.

Facilities in the United States and Canada rely heavily on auto verification rule engines to achieve effective laboratory labor shortage mitigation, improving diagnostic efficiency by 25%.

In contrast, European laboratories emphasize secure remote diagnostic access and decentralized testing environment synchronization to comply with strict national data governance frameworks.

As diagnostic testing baseline requirements expand globally for early asymptomatic condition detection, APAC markets are rapidly adopting advanced platforms.

This widespread integration of tools like the digital pathology slide viewer and sophisticated complex genomic dataset processing engines allows North American networks to outpace emerging regions in diagnostic turnaround speeds by nearly 30%.

Market Dynamics

Our researchers analyzed the data with 2025 as the base year, along with the key drivers, trends, and challenges. A holistic analysis of drivers will help companies refine their marketing strategies to gain a competitive advantage.

  • The rapid evolution of clinical informatics requires healthcare organizations to implement sophisticated software architectures that optimize high-volume diagnostic workflows and ensure uncompromising data accuracy. A critical component of this digital transformation is the execution of complex electronic health record interface configuration, which establishes secure, uninterrupted data pipelines between specialized diagnostic departments and broader hospital information networks.
  • As testing volumes escalate, facilities are prioritizing scalable cloud based laboratory informatics deployment to manage vast repositories of patient data efficiently. This deployment strategy reduces local hardware maintenance burdens while enhancing disaster recovery capabilities across dispersed clinical facilities. To manage increasing analytical workloads without expanding manual labor requirements, modern laboratories rely heavily on automated result verification rule engines.
  • These sophisticated algorithms instantly validate routine test results, allowing clinical staff to focus their expertise exclusively on abnormal pathologies. Consequently, laboratories utilizing these advanced automation tools process routine diagnostic panels up to 30% faster than facilities depending entirely on manual data entry protocols.
  • Furthermore, establishing flawless bidirectional diagnostic instrument communication is essential for streamlining sample analysis, ensuring that testing parameters are accurately transmitted to analyzers without human intervention. The increasing complexity of anatomic pathology also necessitates seamless digital pathology slide viewer integration, enabling specialists to evaluate high-resolution tissue scans remotely.
  • By unifying these advanced technological capabilities, healthcare networks can significantly improve diagnostic precision, accelerate clinical decision-making, and maintain strict adherence to international medical data governance standards.
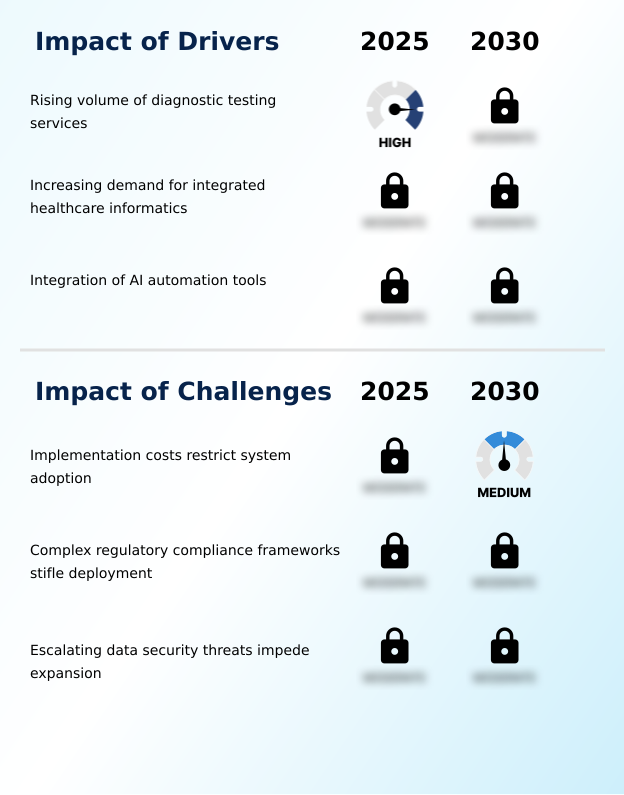
What are the key market drivers leading to the rise in the adoption of Laboratory Information System Industry?

  • The rising volume of diagnostic testing services acts as a primary catalyst accelerating market expansion.

  • The exponential increase in global diagnostic testing volumes serves as the primary catalyst for Laboratory Information System modernization. Shifting demographic patterns and preventative care mandates require facilities to optimize molecular diagnostics data management and execute complex genomic dataset processing efficiently.
  • To handle these massive sample loads, clinical settings are deploying advanced specimen barcoding architecture and automated result verification protocols, which collectively reduce manual transcription errors by 40%.
  • The adoption of automated liquid handler integration and legacy hardware instrument connectivity streamlines high-throughput processing environments. Furthermore, modern biobank inventory tracking and specialized genetic research databases empower organizations to leverage population health management tools effectively.
  • As facilities embrace hybrid cloud framework deployment to manage these intensive data requirements, laboratory staff can process 28% more samples daily, mitigating the severe impact of ongoing medical technician shortages.

What are the market trends shaping the Laboratory Information System Industry?

  • The surging adoption of cloud deployment models represents a prominent trend shaping market dynamics. These scalable architectures significantly enhance operational flexibility and cross-network interoperability.

  • The transition toward cloud based diagnostic archiving is fundamentally reshaping enterprise laboratory management operations. Facilities are abandoning legacy localized servers in favor of subscription based software services that enhance clinical diagnostic throughput and scalability. This shift accelerates clinical pathology workflow automation, allowing facilities to execute custom interface configurations without massive upfront hardware investments.
  • Consequently, seamless electronic health record integration and bidirectional instrument interfacing have become standard operational requirements, reducing diagnostic data retrieval times by 35%. Advanced anatomic pathology informatics systems now support high-volume digital workflows, ensuring precise diagnostic sample traceability across dispersed geographical locations. These interconnected architectures enable specialized laboratories to manage complex testing volumes with improved agility.
  • Cloud adoption ultimately provides continuous software updates and robust disaster recovery capabilities, increasing system uptime and overall diagnostic reliability by 22%.

What challenges does the Laboratory Information System Industry face during its growth?

  • High implementation costs remain a substantial challenge restricting widespread system adoption across clinical facilities.

  • Exorbitant initial capital outlays and complex system integration requirements present severe barriers to Laboratory Information System deployment. Establishing seamless laboratory middleware connectivity and clinical decision support algorithms requires extensive custom programming and expensive third-party consulting engagements. Small and medium diagnostic facilities struggle to fund the infrastructure upgrades necessary to support multisite diagnostic operations and preventative medicine screening programs.
  • Furthermore, the transition to hl7 fhir interoperability standards mandates sophisticated software engineering to ensure uninterrupted data flow across complex healthcare networks. Implementing robust data encryption protocols and comprehensive compliance audit trail logging adds substantial recurring maintenance costs.
  • As organizations navigate the value based healthcare transition and expand chronic disease monitoring protocols, these financial constraints restrict the adoption of advanced tools designed for diagnostic turnaround time optimization, effectively delaying digital transformation initiatives by an average of 18 months for independent community laboratories.

Exclusive Technavio Analysis on Customer Landscape

The laboratory information system market forecasting report includes the adoption lifecycle of the market, covering from the innovator’s stage to the laggard’s stage. It focuses on adoption rates in different regions based on penetration. Furthermore, the laboratory information system market report also includes key purchase criteria and drivers of price sensitivity to help companies evaluate and develop their market growth analysis strategies.
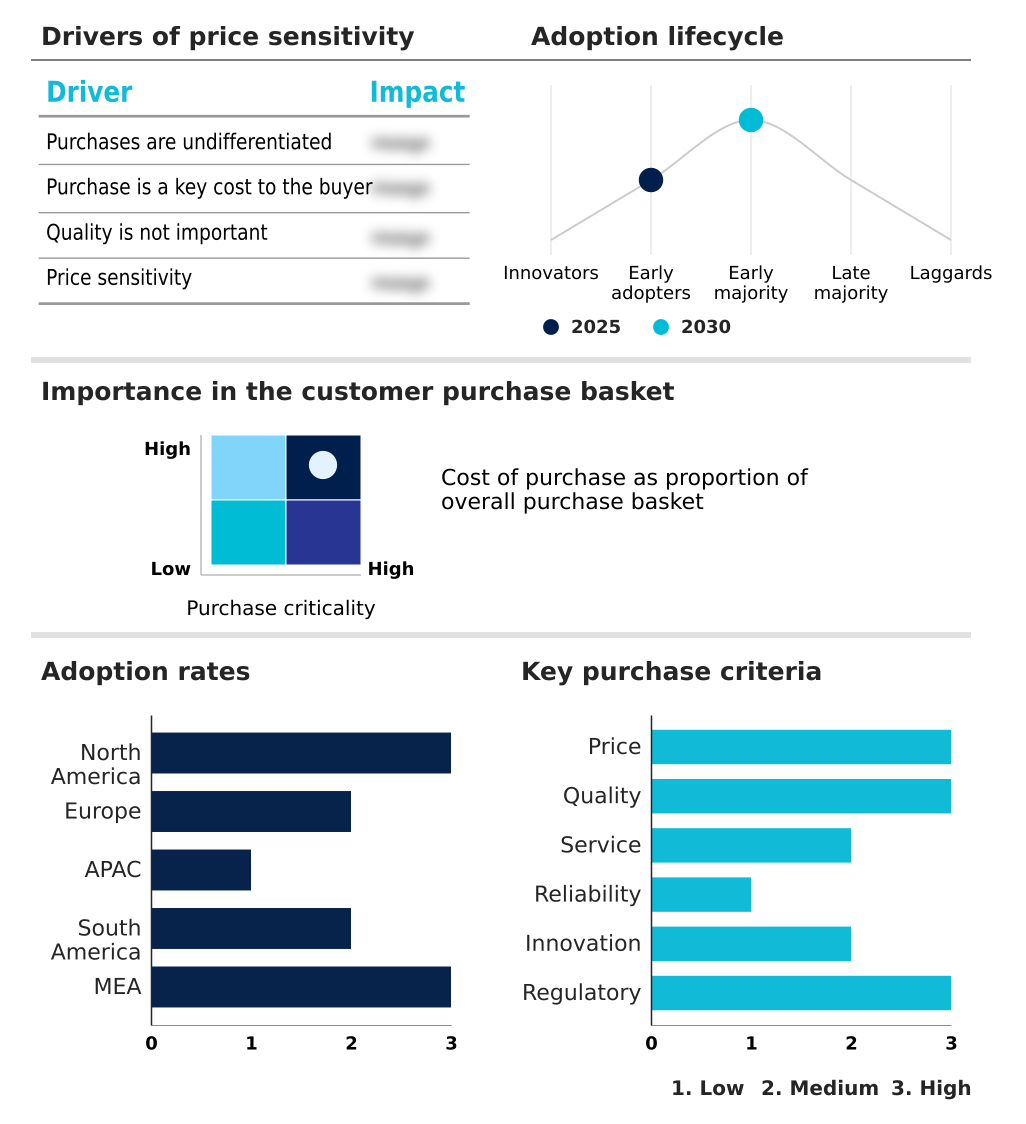
Customer Landscape of Laboratory Information System Industry

Competitive Landscape

Companies are implementing various strategies, such as strategic alliances, laboratory information system market forecast, partnerships, mergers and acquisitions, geographical expansion, and product/service launches, to enhance their presence in the industry.

Altera Digital Health Inc. - The organization delivers unified clinical solutions, encompassing cloud-hosted electronic health records, financial management architecture, and comprehensive patient engagement tools to optimize connected healthcare delivery.

The industry research and growth report includes detailed analyses of the competitive landscape of the market and information about key companies, including:

  • Altera Digital Health Inc.
  • Cirdan
  • Clinisys Inc.
  • Comp Pro Med Inc.
  • CompuGroup Medical SE and Co.
  • Dedalus Group
  • Epic Systems Corp.
  • LabVantage Solutions Inc.
  • LabWare Inc.
  • LigoLab Information Systems
  • Medical Information Tech Inc.
  • NovoPath Inc.
  • Oracle Corp.
  • Orchard Software Corp.
  • Psyche Systems Corp.
  • Soft Computer Consultants Inc.
  • STARLIMS Corp.
  • Sysmex Corp.
  • XIFIN Inc.

Qualitative and quantitative analysis of companies has been conducted to help clients understand the wider business environment as well as the strengths and weaknesses of key industry players. Data is qualitatively analyzed to categorize companies as pure play, category-focused, industry-focused, and diversified; it is quantitatively analyzed to categorize companies as dominant, leading, strong, tentative, and weak.

Recent Development and News in Laboratory information system market

  • In the Systems Software industry, the widespread adoption of AI-optimized data processing architectures has significantly enhanced the speed of complex analytical workflows, directly impacting Laboratory Information System demand by enabling faster genomic dataset interpretations and reducing diagnostic bottlenecks.
  • The enforcement of stringent international data privacy frameworks, such as the General Data Protection Regulation, has compelled software developers to embed robust zero-trust security architectures into enterprise applications, accelerating the replacement of legacy diagnostic management systems with highly encrypted, compliant Laboratory Information System platforms.
  • The transition toward decentralized cloud computing and edge processing environments has revolutionized multi-site data synchronization capabilities, driving healthcare networks to adopt interoperable Laboratory Information System solutions that support seamless remote diagnostic access and unified enterprise connectivity.
  • Advancements in Fast Healthcare Interoperability Resources standards have established unified application programming interface protocols across enterprise software networks, significantly lowering system integration barriers and expanding the deployment of scalable Laboratory Information System architectures across diverse clinical settings.

Dive into Technavio’s robust research methodology, blending expert interviews, extensive data synthesis, and validated models for unparalleled Laboratory Information System Market insights. See full methodology.

Market Scope
Page number 299
Base year 2025
Historic period 2020-2024
Forecast period 2026-2030
Growth momentum & CAGR Accelerate at a CAGR of 9.2%
Market growth 2026-2030 USD 979.5 million
Market structure Fragmented
YoY growth 2025-2026(%) 8.4%
Key countries US, Canada, Mexico, Germany, UK, France, Italy, Spain, The Netherlands, China, Japan, India, South Korea, Australia, Indonesia, Brazil, Argentina, Chile, South Africa, Saudi Arabia, UAE, Israel and Turkey
Competitive landscape Leading Companies, Market Positioning of Companies, Competitive Strategies, and Industry Risks

Request Free Sample

Research Analyst Overview

  • The Laboratory Information System functions as an essential operational conduit for modern clinical environments, centralizing complex diagnostic data to ensure uncompromising analytical precision. Healthcare executives are increasingly prioritizing clinical pathology workflow automation as a strategic boardroom initiative to optimize resource allocation and mitigate severe medical technician shortages.
  • This executive focus aligns with the urgent need for robust molecular diagnostics data management, allowing facilities to process vast genomic datasets with enhanced agility. By implementing advanced specimen barcoding architecture alongside automated biobank inventory tracking, large-scale reference laboratories have reduced sample misidentification errors by an impressive 45% compared to conventional manual routing protocols.
  • Integrating sophisticated clinical decision support algorithms directly into diagnostic workflows accelerates result validation, enabling clinicians to initiate critical therapeutic interventions rapidly. Furthermore, stringent regulatory mandates require organizations to maintain comprehensive compliance audit trail logging and utilize proprietary laboratory quality control modules to safeguard patient confidentiality.
  • As clinical testing complexities intensify, continuous investment in advanced informatics architecture remains paramount for streamlining operations, improving diagnostic throughput, and sustaining competitive advantages within highly regulated healthcare ecosystems.

What are the Key Data Covered in this Laboratory Information System Market Research and Growth Report?

  • What is the expected growth of the Laboratory Information System Market between 2026 and 2030?

    • USD 979.5 million, at a CAGR of 9.2%

  • What segmentation does the market report cover?

    • The report is segmented by Deployment (On-premises, and Cloud-based), Component (Services, and Software), Product Type (Clinical pathology labs, Anatomic pathology labs, Molecular diagnostics labs, Blood banks and biobanks, and Others) and Geography (North America, Europe, APAC, South America, Middle East and Africa)

  • Which regions are analyzed in the report?

    • North America, Europe, APAC, South America and Middle East and Africa

  • What are the key growth drivers and market challenges?

    • Rising volume of diagnostic testing services, Implementation costs restrict system adoption

  • Who are the major players in the Laboratory Information System Market?

    • Altera Digital Health Inc., Cirdan, Clinisys Inc., Comp Pro Med Inc., CompuGroup Medical SE and Co., Dedalus Group, Epic Systems Corp., LabVantage Solutions Inc., LabWare Inc., LigoLab Information Systems, Medical Information Tech Inc., NovoPath Inc., Oracle Corp., Orchard Software Corp., Psyche Systems Corp., Soft Computer Consultants Inc., STARLIMS Corp., Sysmex Corp. and XIFIN Inc.

Market Research Insights

  • Modern enterprise laboratory management frameworks are undergoing significant operational transformations driven by the demand for seamless system interoperability and scalable infrastructure. Diagnostic facilities are increasingly adopting subscription based software services to optimize complex multisite diagnostic operations. This strategic shift away from legacy on-premises architecture enhances diagnostic sample traceability while reducing initial capital expenditures by approximately 40%.
  • By integrating advanced informatics platforms, high-volume testing centers can accelerate bidirectional data exchange, resulting in a 25% improvement in diagnostic turnaround efficiency. Furthermore, unified cloud environments minimize manual intervention in routine workflows, increasing overall laboratory throughput by 18%.
  • As healthcare networks prioritize preventative screening and value-based care, the deployment of specialized diagnostic software remains essential for maintaining clinical precision, minimizing administrative overhead, and ensuring rigorous regulatory compliance across dispersed clinical environments.

We can help! Our analysts can customize this laboratory information system market research report to meet your requirements.

Get in touch

1. Executive Summary

1.1 Market overview

Executive Summary - Chart on Market Overview
Executive Summary - Data Table on Market Overview
Executive Summary - Chart on Global Market Characteristics
Executive Summary - Chart on Market by Geography
Executive Summary - Chart on Market Segmentation by Deployment
Executive Summary - Chart on Market Segmentation by Component
Executive Summary - Chart on Market Segmentation by Product Type
Executive Summary - Chart on Incremental Growth
Executive Summary - Data Table on Incremental Growth
Executive Summary - Chart on Company Market Positioning

2. Technavio Analysis

2.1 Analysis of price sensitivity, lifecycle, customer purchase basket, adoption rates, and purchase criteria

2.2 Criticality of inputs and Factors of differentiation

Chart on Overview on criticality of inputs and factors of differentiation

2.3 Factors of disruption

Chart on Overview on factors of disruption

2.4 Impact of drivers and challenges

Chart on Impact of drivers and challenges in 2025 and 2030

3. Market Landscape

3.1 Market ecosystem

Chart on Parent Market
Data Table on - Parent Market

3.2 Market characteristics

Chart on Market characteristics analysis

3.3 Value chain analysis

Chart on Value chain analysis

4. Market Sizing

4.1 Market definition

Data Table on Offerings of companies included in the market definition

4.2 Market segment analysis

Market segments

4.3 Market size 2025

4.4 Market outlook: Forecast for 2025-2030

Chart on Global - Market size and forecast 2025-2030 ($ million)
Data Table on Global - Market size and forecast 2025-2030 ($ million)
Chart on Global Market: Year-over-year growth 2025-2030 (%)
Data Table on Global Market: Year-over-year growth 2025-2030 (%)

5. Historic Market Size

5.1 Global Laboratory Information System Market 2020 - 2024

Historic Market Size - Data Table on Global Laboratory Information System Market 2020 - 2024 ($ million)

5.2 Deployment segment analysis 2020 - 2024

Historic Market Size - Deployment Segment 2020 - 2024 ($ million)

5.3 Component segment analysis 2020 - 2024

Historic Market Size - Component Segment 2020 - 2024 ($ million)

5.4 Product Type segment analysis 2020 - 2024

Historic Market Size - Product Type Segment 2020 - 2024 ($ million)

5.5 Geography segment analysis 2020 - 2024

Historic Market Size - Geography Segment 2020 - 2024 ($ million)

5.6 Country segment analysis 2020 - 2024

Historic Market Size - Country Segment 2020 - 2024 ($ million)

6. Qualitative Analysis

6.1 Impact of AI on Global Laboratory Information System Market

6.2 Impact of geopolitical conflicts on Global Laboratory Information System Market

7. Five Forces Analysis

7.1 Five forces summary

Five forces analysis - Comparison between 2025 and 2030

7.2 Bargaining power of buyers

Bargaining power of buyers - Impact of key factors 2025 and 2030

7.3 Bargaining power of suppliers

Bargaining power of suppliers - Impact of key factors in 2025 and 2030

7.4 Threat of new entrants

Threat of new entrants - Impact of key factors in 2025 and 2030

7.5 Threat of substitutes

Threat of substitutes - Impact of key factors in 2025 and 2030

7.6 Threat of rivalry

Threat of rivalry - Impact of key factors in 2025 and 2030

7.7 Market condition

Chart on Market condition - Five forces 2025 and 2030

8. Market Segmentation by Deployment

8.1 Market segments

Chart on Deployment - Market share 2025-2030 (%)
Data Table on Deployment - Market share 2025-2030 (%)

8.2 Comparison by Deployment

Chart on Comparison by Deployment
Data Table on Comparison by Deployment

8.3 On-premises - Market size and forecast 2025-2030

Chart on On-premises - Market size and forecast 2025-2030 ($ million)
Data Table on On-premises - Market size and forecast 2025-2030 ($ million)
Chart on On-premises - Year-over-year growth 2025-2030 (%)
Data Table on On-premises - Year-over-year growth 2025-2030 (%)

8.4 Cloud-based - Market size and forecast 2025-2030

Chart on Cloud-based - Market size and forecast 2025-2030 ($ million)
Data Table on Cloud-based - Market size and forecast 2025-2030 ($ million)
Chart on Cloud-based - Year-over-year growth 2025-2030 (%)
Data Table on Cloud-based - Year-over-year growth 2025-2030 (%)

8.5 Market opportunity by Deployment

Market opportunity by Deployment ($ million)
Data Table on Market opportunity by Deployment ($ million)

9. Market Segmentation by Component

9.1 Market segments

Chart on Component - Market share 2025-2030 (%)
Data Table on Component - Market share 2025-2030 (%)

9.2 Comparison by Component

Chart on Comparison by Component
Data Table on Comparison by Component

9.3 Services - Market size and forecast 2025-2030

Chart on Services - Market size and forecast 2025-2030 ($ million)
Data Table on Services - Market size and forecast 2025-2030 ($ million)
Chart on Services - Year-over-year growth 2025-2030 (%)
Data Table on Services - Year-over-year growth 2025-2030 (%)

9.4 Software - Market size and forecast 2025-2030

Chart on Software - Market size and forecast 2025-2030 ($ million)
Data Table on Software - Market size and forecast 2025-2030 ($ million)
Chart on Software - Year-over-year growth 2025-2030 (%)
Data Table on Software - Year-over-year growth 2025-2030 (%)

9.5 Market opportunity by Component

Market opportunity by Component ($ million)
Data Table on Market opportunity by Component ($ million)

10. Market Segmentation by Product Type

10.1 Market segments

Chart on Product Type - Market share 2025-2030 (%)
Data Table on Product Type - Market share 2025-2030 (%)

10.2 Comparison by Product Type

Chart on Comparison by Product Type
Data Table on Comparison by Product Type

10.3 Clinical pathology labs - Market size and forecast 2025-2030

Chart on Clinical pathology labs - Market size and forecast 2025-2030 ($ million)
Data Table on Clinical pathology labs - Market size and forecast 2025-2030 ($ million)
Chart on Clinical pathology labs - Year-over-year growth 2025-2030 (%)
Data Table on Clinical pathology labs - Year-over-year growth 2025-2030 (%)

10.4 Anatomic pathology labs - Market size and forecast 2025-2030

Chart on Anatomic pathology labs - Market size and forecast 2025-2030 ($ million)
Data Table on Anatomic pathology labs - Market size and forecast 2025-2030 ($ million)
Chart on Anatomic pathology labs - Year-over-year growth 2025-2030 (%)
Data Table on Anatomic pathology labs - Year-over-year growth 2025-2030 (%)

10.5 Molecular diagnostics labs - Market size and forecast 2025-2030

Chart on Molecular diagnostics labs - Market size and forecast 2025-2030 ($ million)
Data Table on Molecular diagnostics labs - Market size and forecast 2025-2030 ($ million)
Chart on Molecular diagnostics labs - Year-over-year growth 2025-2030 (%)
Data Table on Molecular diagnostics labs - Year-over-year growth 2025-2030 (%)

10.6 Blood banks and biobanks - Market size and forecast 2025-2030

Chart on Blood banks and biobanks - Market size and forecast 2025-2030 ($ million)
Data Table on Blood banks and biobanks - Market size and forecast 2025-2030 ($ million)
Chart on Blood banks and biobanks - Year-over-year growth 2025-2030 (%)
Data Table on Blood banks and biobanks - Year-over-year growth 2025-2030 (%)

10.7 Others - Market size and forecast 2025-2030

Chart on Others - Market size and forecast 2025-2030 ($ million)
Data Table on Others - Market size and forecast 2025-2030 ($ million)
Chart on Others - Year-over-year growth 2025-2030 (%)
Data Table on Others - Year-over-year growth 2025-2030 (%)

10.8 Market opportunity by Product Type

Market opportunity by Product Type ($ million)
Data Table on Market opportunity by Product Type ($ million)

11. Customer Landscape

11.1 Customer landscape overview

Analysis of price sensitivity, lifecycle, customer purchase basket, adoption rates, and purchase criteria

12. Geographic Landscape

12.1 Geographic segmentation

Chart on Market share by geography 2025-2030 (%)
Data Table on Market share by geography 2025-2030 (%)

12.2 Geographic comparison

Chart on Geographic comparison
Data Table on Geographic comparison

12.3 North America - Market size and forecast 2025-2030

Chart on North America - Market size and forecast 2025-2030 ($ million)
Data Table on North America - Market size and forecast 2025-2030 ($ million)
Chart on North America - Year-over-year growth 2025-2030 (%)
Data Table on North America - Year-over-year growth 2025-2030 (%)
Chart on Regional Comparison - North America
Data Table on Regional Comparison - North America

12.3.1 US - Market size and forecast 2025-2030

Chart on US - Market size and forecast 2025-2030 ($ million)
Data Table on US - Market size and forecast 2025-2030 ($ million)
Chart on US - Year-over-year growth 2025-2030 (%)
Data Table on US - Year-over-year growth 2025-2030 (%)

12.3.2 Canada - Market size and forecast 2025-2030

Chart on Canada - Market size and forecast 2025-2030 ($ million)
Data Table on Canada - Market size and forecast 2025-2030 ($ million)
Chart on Canada - Year-over-year growth 2025-2030 (%)
Data Table on Canada - Year-over-year growth 2025-2030 (%)

12.3.3 Mexico - Market size and forecast 2025-2030

Chart on Mexico - Market size and forecast 2025-2030 ($ million)
Data Table on Mexico - Market size and forecast 2025-2030 ($ million)
Chart on Mexico - Year-over-year growth 2025-2030 (%)
Data Table on Mexico - Year-over-year growth 2025-2030 (%)

12.4 Europe - Market size and forecast 2025-2030

Chart on Europe - Market size and forecast 2025-2030 ($ million)
Data Table on Europe - Market size and forecast 2025-2030 ($ million)
Chart on Europe - Year-over-year growth 2025-2030 (%)
Data Table on Europe - Year-over-year growth 2025-2030 (%)
Chart on Regional Comparison - Europe
Data Table on Regional Comparison - Europe

12.4.1 Germany - Market size and forecast 2025-2030

Chart on Germany - Market size and forecast 2025-2030 ($ million)
Data Table on Germany - Market size and forecast 2025-2030 ($ million)
Chart on Germany - Year-over-year growth 2025-2030 (%)
Data Table on Germany - Year-over-year growth 2025-2030 (%)

12.4.2 UK - Market size and forecast 2025-2030

Chart on UK - Market size and forecast 2025-2030 ($ million)
Data Table on UK - Market size and forecast 2025-2030 ($ million)
Chart on UK - Year-over-year growth 2025-2030 (%)
Data Table on UK - Year-over-year growth 2025-2030 (%)

12.4.3 France - Market size and forecast 2025-2030

Chart on France - Market size and forecast 2025-2030 ($ million)
Data Table on France - Market size and forecast 2025-2030 ($ million)
Chart on France - Year-over-year growth 2025-2030 (%)
Data Table on France - Year-over-year growth 2025-2030 (%)

12.4.4 Italy - Market size and forecast 2025-2030

Chart on Italy - Market size and forecast 2025-2030 ($ million)
Data Table on Italy - Market size and forecast 2025-2030 ($ million)
Chart on Italy - Year-over-year growth 2025-2030 (%)
Data Table on Italy - Year-over-year growth 2025-2030 (%)

12.4.5 Spain - Market size and forecast 2025-2030

Chart on Spain - Market size and forecast 2025-2030 ($ million)
Data Table on Spain - Market size and forecast 2025-2030 ($ million)
Chart on Spain - Year-over-year growth 2025-2030 (%)
Data Table on Spain - Year-over-year growth 2025-2030 (%)

12.4.6 The Netherlands - Market size and forecast 2025-2030

Chart on The Netherlands - Market size and forecast 2025-2030 ($ million)
Data Table on The Netherlands - Market size and forecast 2025-2030 ($ million)
Chart on The Netherlands - Year-over-year growth 2025-2030 (%)
Data Table on The Netherlands - Year-over-year growth 2025-2030 (%)

12.5 APAC - Market size and forecast 2025-2030

Chart on APAC - Market size and forecast 2025-2030 ($ million)
Data Table on APAC - Market size and forecast 2025-2030 ($ million)
Chart on APAC - Year-over-year growth 2025-2030 (%)
Data Table on APAC - Year-over-year growth 2025-2030 (%)
Chart on Regional Comparison - APAC
Data Table on Regional Comparison - APAC

12.5.1 China - Market size and forecast 2025-2030

Chart on China - Market size and forecast 2025-2030 ($ million)
Data Table on China - Market size and forecast 2025-2030 ($ million)
Chart on China - Year-over-year growth 2025-2030 (%)
Data Table on China - Year-over-year growth 2025-2030 (%)

12.5.2 Japan - Market size and forecast 2025-2030

Chart on Japan - Market size and forecast 2025-2030 ($ million)
Data Table on Japan - Market size and forecast 2025-2030 ($ million)
Chart on Japan - Year-over-year growth 2025-2030 (%)
Data Table on Japan - Year-over-year growth 2025-2030 (%)

12.5.3 India - Market size and forecast 2025-2030

Chart on India - Market size and forecast 2025-2030 ($ million)
Data Table on India - Market size and forecast 2025-2030 ($ million)
Chart on India - Year-over-year growth 2025-2030 (%)
Data Table on India - Year-over-year growth 2025-2030 (%)

12.5.4 South Korea - Market size and forecast 2025-2030

Chart on South Korea - Market size and forecast 2025-2030 ($ million)
Data Table on South Korea - Market size and forecast 2025-2030 ($ million)
Chart on South Korea - Year-over-year growth 2025-2030 (%)
Data Table on South Korea - Year-over-year growth 2025-2030 (%)

12.5.5 Australia - Market size and forecast 2025-2030

Chart on Australia - Market size and forecast 2025-2030 ($ million)
Data Table on Australia - Market size and forecast 2025-2030 ($ million)
Chart on Australia - Year-over-year growth 2025-2030 (%)
Data Table on Australia - Year-over-year growth 2025-2030 (%)

12.5.6 Indonesia - Market size and forecast 2025-2030

Chart on Indonesia - Market size and forecast 2025-2030 ($ million)
Data Table on Indonesia - Market size and forecast 2025-2030 ($ million)
Chart on Indonesia - Year-over-year growth 2025-2030 (%)
Data Table on Indonesia - Year-over-year growth 2025-2030 (%)

12.6 South America - Market size and forecast 2025-2030

Chart on South America - Market size and forecast 2025-2030 ($ million)
Data Table on South America - Market size and forecast 2025-2030 ($ million)
Chart on South America - Year-over-year growth 2025-2030 (%)
Data Table on South America - Year-over-year growth 2025-2030 (%)
Chart on Regional Comparison - South America
Data Table on Regional Comparison - South America

12.6.1 Brazil - Market size and forecast 2025-2030

Chart on Brazil - Market size and forecast 2025-2030 ($ million)
Data Table on Brazil - Market size and forecast 2025-2030 ($ million)
Chart on Brazil - Year-over-year growth 2025-2030 (%)
Data Table on Brazil - Year-over-year growth 2025-2030 (%)

12.6.2 Argentina - Market size and forecast 2025-2030

Chart on Argentina - Market size and forecast 2025-2030 ($ million)
Data Table on Argentina - Market size and forecast 2025-2030 ($ million)
Chart on Argentina - Year-over-year growth 2025-2030 (%)
Data Table on Argentina - Year-over-year growth 2025-2030 (%)

12.6.3 Chile - Market size and forecast 2025-2030

Chart on Chile - Market size and forecast 2025-2030 ($ million)
Data Table on Chile - Market size and forecast 2025-2030 ($ million)
Chart on Chile - Year-over-year growth 2025-2030 (%)
Data Table on Chile - Year-over-year growth 2025-2030 (%)

12.7 Middle East and Africa - Market size and forecast 2025-2030

Chart on Middle East and Africa - Market size and forecast 2025-2030 ($ million)
Data Table on Middle East and Africa - Market size and forecast 2025-2030 ($ million)
Chart on Middle East and Africa - Year-over-year growth 2025-2030 (%)
Data Table on Middle East and Africa - Year-over-year growth 2025-2030 (%)
Chart on Regional Comparison - Middle East and Africa
Data Table on Regional Comparison - Middle East and Africa

12.7.1 South Africa - Market size and forecast 2025-2030

Chart on South Africa - Market size and forecast 2025-2030 ($ million)
Data Table on South Africa - Market size and forecast 2025-2030 ($ million)
Chart on South Africa - Year-over-year growth 2025-2030 (%)
Data Table on South Africa - Year-over-year growth 2025-2030 (%)

12.7.2 Saudi Arabia - Market size and forecast 2025-2030

Chart on Saudi Arabia - Market size and forecast 2025-2030 ($ million)
Data Table on Saudi Arabia - Market size and forecast 2025-2030 ($ million)
Chart on Saudi Arabia - Year-over-year growth 2025-2030 (%)
Data Table on Saudi Arabia - Year-over-year growth 2025-2030 (%)

12.7.3 UAE - Market size and forecast 2025-2030

Chart on UAE - Market size and forecast 2025-2030 ($ million)
Data Table on UAE - Market size and forecast 2025-2030 ($ million)
Chart on UAE - Year-over-year growth 2025-2030 (%)
Data Table on UAE - Year-over-year growth 2025-2030 (%)

12.7.4 Israel - Market size and forecast 2025-2030

Chart on Israel - Market size and forecast 2025-2030 ($ million)
Data Table on Israel - Market size and forecast 2025-2030 ($ million)
Chart on Israel - Year-over-year growth 2025-2030 (%)
Data Table on Israel - Year-over-year growth 2025-2030 (%)

12.7.5 Turkey - Market size and forecast 2025-2030

Chart on Turkey - Market size and forecast 2025-2030 ($ million)
Data Table on Turkey - Market size and forecast 2025-2030 ($ million)
Chart on Turkey - Year-over-year growth 2025-2030 (%)
Data Table on Turkey - Year-over-year growth 2025-2030 (%)

12.8 Market opportunity by geography

Market opportunity by geography ($ million)
Data Tables on Market opportunity by geography ($ million)

13. Drivers, Challenges, and Opportunity

13.1 Market drivers

Rising volume of diagnostic testing services
Increasing demand for integrated healthcare informatics
Integration of AI automation tools

13.2 Market challenges

Implementation costs restrict system adoption
Complex regulatory compliance frameworks stifle deployment
Escalating data security threats impede expansion

13.3 Impact of drivers and challenges

Impact of drivers and challenges in 2025 and 2030

13.4 Market opportunities

Surging adoption of cloud deployment models
Rising imperative for seamless systems interoperability
Escalating transition toward value-based healthcare

14. Competitive Landscape

14.1 Overview

14.2

Overview on criticality of inputs and factors of differentiation

14.3 Landscape disruption

Overview on factors of disruption

14.4 Industry risks

Impact of key risks on business

15. Competitive Analysis

15.1 Companies profiled

Companies covered

15.2 Company ranking index

15.3 Market positioning of companies

Matrix on companies position and classification

15.4 Altera Digital Health Inc.

Altera Digital Health Inc. - Overview
Altera Digital Health Inc. - Product / Service
Altera Digital Health Inc. - Key offerings
SWOT

15.5 Cirdan

Cirdan - Overview
Cirdan - Product / Service
Cirdan - Key offerings
SWOT

15.6 Clinisys Inc.

Clinisys Inc. - Overview
Clinisys Inc. - Product / Service
Clinisys Inc. - Key offerings
SWOT

15.7 CompuGroup Medical SE and Co.

CompuGroup Medical SE and Co. - Overview
CompuGroup Medical SE and Co. - Business segments
CompuGroup Medical SE and Co. - Key offerings
CompuGroup Medical SE and Co. - Segment focus
SWOT

15.8 Dedalus Group

Dedalus Group - Overview
Dedalus Group - Product / Service
Dedalus Group - Key offerings
SWOT

15.9 Epic Systems Corp.

Epic Systems Corp. - Overview
Epic Systems Corp. - Product / Service
Epic Systems Corp. - Key offerings
SWOT

15.10 LabVantage Solutions Inc.

LabVantage Solutions Inc. - Overview
LabVantage Solutions Inc. - Product / Service
LabVantage Solutions Inc. - Key offerings
SWOT

15.11 LabWare Inc.

LabWare Inc. - Overview
LabWare Inc. - Product / Service
LabWare Inc. - Key offerings
SWOT

15.12 LigoLab Information Systems

LigoLab Information Systems - Overview
LigoLab Information Systems - Product / Service
LigoLab Information Systems - Key offerings
SWOT

15.13 Medical Information Tech Inc.

Medical Information Tech Inc. - Overview
Medical Information Tech Inc. - Product / Service
Medical Information Tech Inc. - Key offerings
SWOT

15.14 Oracle Corp.

Oracle Corp. - Overview
Oracle Corp. - Business segments
Oracle Corp. - Key news
Oracle Corp. - Key offerings
Oracle Corp. - Segment focus
SWOT

15.15 Orchard Software Corp.

Orchard Software Corp. - Overview
Orchard Software Corp. - Product / Service
Orchard Software Corp. - Key offerings
SWOT

15.16 Soft Computer Consultants Inc.

Soft Computer Consultants Inc. - Overview
Soft Computer Consultants Inc. - Product / Service
Soft Computer Consultants Inc. - Key offerings
SWOT

15.17 Sysmex Corp.

Sysmex Corp. - Overview
Sysmex Corp. - Business segments
Sysmex Corp. - Key news
Sysmex Corp. - Key offerings
Sysmex Corp. - Segment focus
SWOT

15.18 XIFIN Inc.

XIFIN Inc. - Overview
XIFIN Inc. - Product / Service
XIFIN Inc. - Key offerings
SWOT

16. Appendix

16.1 Scope of the report

Market definition
Objectives
Notes and caveats

16.2 Inclusions and exclusions checklist

Inclusions checklist
Exclusions checklist

16.3 Currency conversion rates for US$

16.4 Research methodology

16.5 Data procurement

Information sources

16.6 Data validation

16.7 Validation techniques employed for market sizing

16.8 Data synthesis

16.9 360 degree market analysis

16.10 List of abbreviations

Research Methodology

Technavio presents a detailed picture of the market by way of study, synthesis, and summation of data from multiple sources. The analysts have presented the various facets of the market with a particular focus on identifying the key industry influencers. The data thus presented is comprehensive, reliable, and the result of extensive research, both primary and secondary.

INFORMATION SOURCES

Primary sources

  • Manufacturers and suppliers
  • Channel partners
  • Industry experts
  • Strategic decision makers

Secondary sources

  • Industry journals and periodicals
  • Government data
  • Financial reports of key industry players
  • Historical data
  • Press releases

DATA ANALYSIS

Data Synthesis

  • Collation of data
  • Estimation of key figures
  • Analysis of derived insights

Data Validation

  • Triangulation with data models
  • Reference against proprietary databases
  • Corroboration with industry experts

REPORT WRITING

Qualitative

  • Market drivers
  • Market challenges
  • Market trends
  • Five forces analysis

Quantitative

  • Market size and forecast
  • Market segmentation
  • Geographical insights
  • Competitive landscape

Interested in this report?

Get your sample now to see our research methodology and insights!

Download Now

Frequently Asked Questions

Laboratory Information System market growth will increase by USD 979.5 million during 2026-2030.

The Laboratory Information System market is expected to grow at a CAGR of 9.2% during 2026-2030.

Laboratory Information System market is segmented by Deployment (On-premises, Cloud-based) Component (Services, Software) Product type (Clinical pathology labs, Anatomic pathology labs, Molecular diagnostics labs, Blood banks and biobanks, Others)

Altera Digital Health Inc., Cirdan, Clinisys Inc., Comp Pro Med Inc., CompuGroup Medical SE and Co., Dedalus Group, Epic Systems Corp., LabVantage Solutions Inc., LabWare Inc., LigoLab Information Systems, Medical Information Tech Inc., NovoPath Inc., Oracle Corp., Orchard Software Corp., Psyche Systems Corp., Soft Computer Consultants Inc., STARLIMS Corp., Sysmex Corp., XIFIN Inc. are a few of the key vendors in the Laboratory Information System market.

North America will register the highest growth rate of 34.9% among the other regions. Therefore, the Laboratory Information System market in North America is expected to garner significant business opportunities for the vendors during the forecast period.

US, Canada, Mexico, Germany, UK, France, Italy, Spain, The Netherlands, China, Japan, India, South Korea, Australia, Indonesia, Brazil, Argentina, Chile, South Africa, Saudi Arabia, UAE, Israel, Turkey

  • Rising volume of diagnostic testing services is the driving factor this market.

The Laboratory Information System market vendors should focus on grabbing business opportunities from the Deployment segment as it accounted for the largest market share in the base year.
RIA - Research AI Assistant
Ask RIA
